Tasmanian School of Business and Economics
University of Tasmania
Discussion Paper Series N 2014
‐
01
A Review of the Australian Mortgage Market
Maria Belen YANOTTI
University of TasmaniaISBN 978‐1‐86295‐748‐0
A Review of the Australian Mortgage Market
María Belén Yanotti
August 2013
Abstract
During the two decades prior to the global financial crisis, Australian households and investors increased their housing credit demand as a consequence of deregulation (along with competition between lenders, greater access to credit and new products), a stable economic environment (reflected by low inflation and low nominal interest rates, low unemployment, rising incomes and wealth accompanied by rising house prices), attractive taxation arrangements, and, arguably, national housing policies.
This scenario changed with the preamble of the global financial turmoil in 2007. Australia was `lucky' in avoiding a recession during the global financial crisis, but banks were exposed to liquidity risk. As a result, credit growth and house price appreciation have decelerated and the financial sector is more concentrated than before the financial turmoil. The trend towards relaxed lending standards reversed. Borrowers, both owner occupier and investors are still cautious under the uncertain environment.
This paper gives an overview of these developments in the Australian housing credit market and presents relevant responsive policies. A description of current mortgage products available in Australia is also offered.
I would like to thank Mardi Dungey, Graeme Wells, Judy Yates, Chris Stewart and participants at the
2
Introduction
During the 1980s, Australia experienced a series of reforms that would transform its economy. From the early 1980s to 1996, financial markets were freed from price controls, entry was liberalised, and the regulatory structure was renovated. By 1996, the transition from discretionary monetary policy to an inflation-targeting regime was complete.
The first major reform was in December 1983, when the Australian Government decided to float the exchange rate and remove most capital controls; since then, the Reserve Bank has only intervened in foreign exchange markets to prevent `disorderly’ market behaviour. The second step was the process of deregulation and opening capital markets. Interest rates controls on loans were removed in April 1985.1 Another aspect of deregulation was the relaxation of foreign-bank entry restrictions in 1984, allowing 15 new overseas banks to license and participate in the Australian financial market over the following year.2
By 1988, Australia had the foundations of a modern economic and financial era. This era would include freer trade, deregulated markets, lower tax rates, low inflation and a more market-oriented economy, see Kelly (2000). Deregulation was expected to deliver more effective monetary policy and increased access to credit and financial innovation.
However, the foundations for a modern and stable financial system were incomplete without a modern regulatory regime. The large losses experienced by several banks in the late 1980s and beginning of 1990s highlighted the weaknesses of risk management within financial institutions. As a consequence, the 1990s saw the beginning of new arrangements for prudential supervision of these institutions. During the first half of that decade, the RBA conducted targeted, risk-based, on-site bank reviews. The Wallis Inquiry in 1996 set the basis for the development of the structure for a prudentially regulated financial system.
1 Controls over interest rates on certificates of deposits and other bank deposits were removed in 1973 and 1980, respectively.
2 Before 1985 only two foreign institutions operated as authorised banks in Australia in the post-war period. Overseas banks assumed subsidiary status (rather than a branch structure) which requires capital to be held locally. For more details see RBA (2007).
3
The last major reform was the formal adoption of an inflation-targeting regime. After a period of unsatisfactory discretionary monetary policy, the RBA, by agreement with the Federal Treasurer, announced in 1996 it would target a 2%-3% inflation band. For more discussion on deregulation in these early stages, and in particular a detailed timeline of the reforms, see de Brouwer (1999). By 1998, with the implementation of inflation targeting and the establishment of a regulatory oversight of risk-taking by banks and other financial institutions, the main features of Australia’s modern financial markets were in place.
The rest of the paper proceeds as follows. Section 2 presents a review of the Australian mortgage market during the twenty years prior to the global financial crisis; with particular focus on the demand for housing credit. Section 3 discusses the impact of the global financial crisis on the mortgage market. It concentrates firstly on relevant policy responses to the global turmoil, and then analyses the demand for, and supply of, mortgages during the crisis period. A fourth section provides an overview of mortgage products currently offered in Australia. Section 5 concludes.
2. Australian mortgage market: 20 years before the global financial crisis
By 1988, some of the modern features of Australia’s financial system were in place but the framework for prudential regulation was still underdeveloped. Deregulation increased the number of financing institutions and was accompanied by new financial products. Greater competition and easier access to funds facilitated rapid growth in the balance sheets of institutions, which resulted in a rapid expansion of credit, particularly for commercial property investment. Commercial property prices were simultaneously increasing quickly. However, prudential standards did not keep pace with these market developments and, in 1989 high interest rates and a deceleration of commercial property prices, exposed risky loans. The economy fell into recession between 1990 and 1992. Several financial institutions experienced large losses; see Gizycki and Lowe (2000).3
3 Total individual losses in the banking system represented 36% of the aggregate level of shareholders’ funds. In particular, state government owned banks individual losses represented 187% of shareholders’ funds. Some major banks, such as Westpac and ANZ also experienced significant losses.
4
This experience uncovered the need for regulatory reform and motivated the Financial System (`Wallis’) Inquiry in June 1996.4 The Wallis Inquiry set the basis for a tightening of regulatory oversight of risk-taking financial institutions; in this way, all banks were set to manage risk on a consolidated basis.
Since 1998, Australian financial institutions have been regulated by the Australian Prudential Regulation Authority (APRA),5 which assumed prudential regulation functions previously undertaken by the Reserve Bank (RBA). While APRA focuses on the stability of authorised deposit-taking institutions (ADIs), 6 since 2001 the Australian Securities and Investment Commission (ASIC) has been responsible for the regulation of financial products. The RBA retains responsibility for monetary policy and systemic stability in the whole financial system.7 Senior representatives of the RBA, APRA, ASIC and the Department of the Treasury comprise the Council of Financial Regulators, which is the coordinating body for Australia's main financial regulatory agencies.
After the financial instability of the early 1990s, banks shifted their focus towards lower risk-weighted assets such as housing loans. Prior to 1980, on average 60% of owner occupier housing finance commitments were held by banks; this share rose through the 1980s and 1990s. By 1994, the domestic banking system provided 92% of the residential housing credit; see figure 1.
4
See Harper (1997).
5 APRA regulates banks, general and life insurance companies, superannuation funds, credit unions, building societies and friendly societies to ensure that these institutions remain financially sound and able to meet their obligations to depositors, fund members and policy holders. www.apra.gov.au
6 Authorised Deposit-taking Institutions (ADIs) are institutions that are licensed and regulated by APRA under the Banking Act 1959. APRA has focused on the balance sheet soundness of these financial institutions through specific balance sheet requirements such as capital adequacy rules and general supervisory oversight following Basel Committee recommendations.
7 A Payments System Board was established within the RBA with the responsibility to promote safety, competition and efficiency within the payments system. Other important players in Australian financial regulation are: Auditing and Assurance Standards Board (AUASB), Australian Accounting Standards Board (AASB), Australian Transaction Reports and Analysis Centre (AUSTRAC), Financial Reporting Council (FRC), Financial Reporting Panel (FRP), Insolvency and Trustee Service Australia (ITSA), and the Australian Department of Treasury.
5
Figure 1: Housing Finance Commitments
(% of Total Housing Finance Commitments for owner-occupiers)
During the second half of the 1990s, competition increased with the introduction of new players in the market. International lenders, who entered the market between 1985 and 1993, and wholesale mortgage originators and mortgage brokers, who joined around 1996, stimulated competition further. Financial deregulation and the entry of new lenders gave rise to a wider range of financial products offered. Traditionally, mortgages were a fully documented, full recourse, variable rate loan, while fixed rate mortgages represented less than a quarter of the mortgage market. Non-bank lenders introduced low-documentation loans, along with riskier loans such as interest-only loans and revolving credit lines. Home equity loans8 were introduced to the market around 1996, but grew in popularity from 2003.
Lending standards relaxed over the period. Lending standards before the deregulation were quite conservative with a maximum debt service-to-income ratio of 30%,9 and loan-to-value ratios (LVR) of a maximum of 80%. As a result of deregulation and increased competition, measures of disposable income and property valuation methods were redefined and relaxed. Higher LVRs were available, backed by loan mortgage insurance (LMI). High LVR loans attracted a 100% risk weight under APRA’s capital adequacy rules. ADIs could obtain a concessional risk weight of 50% on high LVR
8 Described in Section 4.
6
loans (over 80%) with approved private LMI. The increase in the number of loan arrears in the first part of the 21st century could be attributed to the relaxation of lending standards; nevertheless, loan arrears are very low relative to international standards.
The overall effect of deregulation for the financial system was an increase in the supply of credit and a reduction in the cost of credit. The next subsection focuses on the players in the housing credit market before the global financial crisis, by first discussing the providers of housing credit and then giving an overview of the demand for housing loans.
2.1 Mortgage Lenders
The housing credit market has always played an important role in Australia’s financial system. Historically, mortgage originators, principally ADIs, held around half of the total assets in the financial system.
ADIs comprise domestic and foreign banks, building societies and credit unions; although banks hold around 96% of the total ADI assets. The top panel of table 1 provides a snapshot of the evolution of the number of ADIs in the Australian mortgage market. Traditionally, the Australian banking system has been concentrated around four major domestic banks.10 During the fifteen years leading up to 2007, the major Australian banks held over 60% of ADI assets. The lower panel of table 1 shows the share of total ADI assets by type of institution. After 1990, the demutualisation of building societies together with mergers amongst both small and major deposit-taking institutions of all types, transformed the composition of ADIs in the credit market. In general, foreign banks operating in Australia have shown relatively little interest in retail banking, focusing mainly on wholesale funding and funds management.
10 The four major banks are, in alphabetical order: Australian and New Zealand Bank (ANZ), Commonwealth Bank of Australia (CBA), National Australia Bank (NAB), and Westpac Bank Corporation (WBC).
7
Table 1: Authorised Deposit-taking Institutions (ADIs)
Number 1990 1999 2005 2010
Major Australian Banks 4 4 4 4
Other domestic banks 13 8 9 7
Building Societies and Credit Unions 330 238 170 116
Foreign owned Banks
- subsidiaries 15 11 11 9
- branches 3 25 28 34
Total 365 286 222 170
Per cent of total assets 1990 1999 2005 2010
Major Australian Banks 59% 63% 65% 75%
Other domestic banks 21% 17% 14% 9%
Building Societies and Credit Unions 9% 5% 4% 3%
Foreign owned Banks
- subsidiaries 10% 6% 7% 4%
- branches 1% 10% 10% 9%
Sources: Gizycki and Lowe (2000); Donovan and Gorajek (2011).
Prior to 1980, whilst 60% of owner occupier housing finance commitments were held by banks, building societies held a further 25% (see Figure 1), and were offering larger average loan sizes relative to banks.11 During the 1980s, with the introduction of foreign banks in the market, banks became even more dominant. By 1996, mortgage managers took over part of the market share previously held by building societies and credit unions. Figure 1 shows the change in the composition in the non-banking sector share of housing finance commitments; prior to 1996, building societies provided the majority of loans originated in this sector, but were overtaken by wholesale lenders thereafter. Many building societies and credit unions became banks or merged with banks, thus, by mid-1990s, the domestic banking system provided 92% of the residential housing credit. Wholesale lenders also captured some bank-originated loans by offering, on average, larger mortgages than banks.
By the early 21st century, while major banks approved around 60% of owner occupier home loans, smaller banks held around 20% of residential home loan approvals, credit unions and building
8
societies had less than 10% market share, and wholesale mortgage originators a little bit over 10%, see Davies (2009).
Mortgage managers have been in the market since the 1960s, holding only around 1% of total loan approvals. Around 1995 their participation in the market grew to holding 8% of new housing loans; see Edey and Gray (1996). A likely reason for the increasing share of the mortgage market appropriated by wholesale mortgage originators and mortgage brokers post-1996 – in particular, their rising share of refinanced mortgages -- was the, on average, larger loans accompanied by lower lending rates that they offered; see figure 2. They also introduced low-documentation loans, interest only loans and revolving credit lines.
Figure 2: Standard Variable Interest Rates
The participation of wholesale mortgage originators in the market was enhanced with technological advances, but in particular, with the growth of the residential mortgage backed securities (RMBS) market – which provided a relatively cheap funding source. The first MBS programs in Australia were developed around the mid-1980s by state governments to finance loans to low income households. The RMBS12 market developed further with the growth of wholesale mortgage managers. The Australian securitisation market expanded rapidly between the mid-1990s and the recent financial
12 Australian RMBS are prime loans covered by mortgage insurance and excess spreads; see RBA (2006), `The Performances of Australian Residential Mortgage-backed Securities', Reserve Bank of Australia Financial Stability Review, March, 63-68.
9
crisis, reaching up to 7% of the total assets in the financial system by mid-2007. During this period, 23% of outstanding housing loans had been securitised; see Davies (2009: graph 11). Securitising some part of on-balance sheet residential mortgage loans also helped ADIs to manage credit risk, release capital and manage shareholder return to investment. However, the share of securitisation in the funding composition of ADIs was always below 8%. The secondary market played an important role in mortgage funding for wholesale mortgage originators and, to a lesser degree for small ADIs.
The major banks sourced most of their funding from deposits (see table 2), but the expansion of households’ demand for credit and the reduction in the growth of deposits forced financial institutions to increasingly rely on wholesale markets for funding, mainly by issuing debt securities to non-residents. The share of the banking system’s total liabilities owned by non-residents rose from below 10% in 1990 to over 25% in 2007; see figure 3.
Figure 3: Banks’ Liabilities (% of Total Liabilities)
The first panel in table 2 presents total deposits as a share of total assets for the four major banks and for some smaller domestic banks. Major banks funded above 40% of their assets with resident deposits, smaller banks relied more on deposits as a source of funding. The second panel displays the proportion of households deposits held by banks. One third of major banks’ deposits were household
10
deposits -- except for Commonwealth Bank. The last panel shows the proportion of securitised assets held by banks. Securitised assets represent a marginal share of the major banks’ resident assets.
Table 2: Assets and Liabilities of ADIs
Deposit-to-Resident Assets ratio 2002 2005 2007 2009 2012
ANZ 49.5% 49.6% 49.1% 54.2% 60. 5%
Commonwealth Bank 64.1% 55.4% 52.9% 56.9% 58.8%
National Australia Bank 43.0% 45.2% 41. 6% 49. 5% 53.7%
Westpac 53.6% 54.7% 55.7% 52.7% 52.6% Adelaide Bank 87.2% 81.5% 75.6% (c) (c) Bank of Queensland 80.6% 74.4% 78.0% 79.7% 80.2% Bendigo Bank 78.5% 78.1% 78.2% 77.3% 85.7% Macquarie Bank 37.8% 31.3% 30.1% 35.4% 67.7% St George 69.6% 63.8% 64.2% 53.3% (d) Suncorp 56.7% 60.4% 55.8% 41.4% 63.7%
Per cent of deposits from households 2002 2005 2007 2009 2012
ANZ 34.4% 29.2% 27.2% 31.9% 33.2%
Commonwealth Bank 53.4% 57.0% 52.7% 45.3% 43.5%
National Australia Bank 33.6% 32.0% 33.0% 29.6% 30.6%
Westpac 36.2% 33.3% 31.1% 29.4% 39.5% Adelaide Bank 43.0% 31.8% 28.2% (c) (c) Bank of Queensland 39.0% 48.5% 54.4% 61.4% 55.0% Bendigo Bank 63.5% 58.3% 56.8% 54.0% 47.6% Macquarie Bank 4.8% 6.0% 2.8% 13.2% 20.8% St George 55.6% 55.2% 49.7% 57.3% (d) Suncorp 39.9% 41.1% 36.0% 43.6% 41.9%
Securitised Assets-to-Resident Assets 2002(a) 2005(a) 2007(b) 2009(b) 2012(b)
ANZ 1.7% 1.0% 0.4% 0.1% 0.0%
Commonwealth Bank 4.0% 5.3% 7.2% 1.7% 0.7%
National Australia Bank 0.6% 0.9% 1.9% 0.5% 0.1%
Westpac 2.8% 1.4% 2.8% 0.9% 1.1% Adelaide Bank 41.9% 49.2% 47.7% (c) (c) Bank of Queensland 18.9% 21.6% 25.4% 18.2% 7.6% Bendigo Bank 12.4% 3.7% 2.4% 15.6% 13.6% Macquarie Bank 37.2% 57. 0% 46.8% 27.3% 14.1% St George 10.0% 15.6% 21.0% 9.2% (d) Suncorp 1.9% 9.7% 14.6% 6.5% 4.3% Source: APRA. (a)
Outstanding value of all assets that have been securitised as a per cent of total resident assets.
(b)
Outstanding principal balance of securitised assets as a per cent of total resident assets.
(c)
In November 2007 Adelaide Bank merged with Bendigo Bank forming Bendigo and Adelaide Bank Limited.
(d)
In November 2008 St. George Bank and its branch Bank of South Australia, became part of Westpac Group. In 2011 Westpac announced the relaunch of its subsidiary Bank of Melbourne, which will replace St. George Bank in Victoria.
11
During the first half of the new century, the banks sourced 45% of their funding from domestic deposits, 30% from short-term wholesale debt and 15% from long-term wholesale debt; see Deans and Stewart (2012: graph 1). Regional banks, small credit unions and building societies relied mainly on deposits, but had been active in sourcing their funding from the securitisation market.
Increased competition in the housing mortgage market can be evidenced by a narrowing in the spread between the standard variable housing loan interest rate and the RBA cash rate, and also in decreasing banks profit margins and the proliferation of new mortgage products. As shown in Figure 4, the spread between the standard variable home loan interest rate and the cash rate fell from over 400 basis points in 1993-1994, to 180 basis points between 1997 and 2008. Net interest margins13 have been falling between 1996 and 2007, from above 4% to just above 2% for major banks, and from 3% to under 2% for smaller banks; see Deans and Stewart (2012: graph 11).
Figure 4: Standard Variable Interest Rates (Spread to RBA Cash Rate)
13 Net interest margins is the difference between the interest income generated by a financial institution and the amount of interest paid out to their lenders, relative to the interest-earning assets.
12
2.2 Australian demand for housing credit
Home ownership in Australia has been around 70% for more than two decades.14 Housing debt accounts for three quarters of the personal sector borrowing,15 and at any one time, approximately one third of the housing stock is financed by a mortgage.
Australia has experienced a period of exceptional expansion over the past twenty years. There have been no recessions since 1990-1992, inflation has remained low and stable along with nominal interest rates, and unemployment fell from 11% in 1993 to 4.3% in 2006.16 Over the same period, household financial assets relative to disposable income doubled from 170% to 350%; see left panel of figure 5. In the two decades prior to 2007, the household debt-to-income ratio increased from below 50% to around 150% and has since stabilized: see right panel of figure 5. Most of the household debt accumulation was housing debt. Property debt accounted for 84% of all household debt in mid-2000s. During the same period, 60% of total household assets were held in residential property; see Kohler and Rossiter (2005).
Figure 5: Credit in Australia
14 See ABS Housing Occupancy and Costs, 2007-2008, 4130.0. Half of homeowners hold a mortgage while the other half are out-right homeowners, 25% of Australians are renters, and 5% live in public housing arrangements.
15 See Edey and Gray (1996).
13
Between 1980 and 1990, real net national disposable income grew by 3.1% per annum on average, while, between 2002 and 2011 it grew by 4.1% per annum on average. 17 Households that experienced higher income were prepared to increase their spending on housing. From this perspective, household income growth can explain part of the rise in debt and assets held on households’ balance sheets. However, Fox and Finlay (2012: graph 1) report that during this period the dwelling price-to-income ratio had doubled, suggesting that the growth in income was not explaining all the increase in households balance sheet accumulation.
Households increasingly invested in housing wealth, with little evidence of other household savings, with the net savings rate as low as minus 2% as a proportion of disposable income during this period.18 Households’ savings have been more oriented towards managed funds than to bank deposits, as a consequence of compulsory superannuation and tax incentives for voluntary contributions.19
The rise in household asset (and debt) accumulation was likely due to increased leverage and increasing valuations of assets such as housing and equities. Between 1980 and 1995, average annual real house price growth was 1.1%, but between 1995 and 2005 this average annual growth rate was 6%; see Yates (2011).20 As in other countries, housing prices have risen faster than consumer prices; see figure 6. Australia's nominal house prices rose by 63% between 2003 and 2009. Bank lending for housing finance increased by 14.2% per annum during the same period. Ellis (2006) argues that as a result of disinflation, deregulation and financial innovation the housing credit growth resulted in an increase in housing demand which in turn increased housing prices in the face of a highly inelastic supply. Caldera and Johånsson (2013) show that the long-run price-elasticity of new housing supply in Australia is around 0.52. The rise in house prices was channelled through an increase in construction costs, increase in the price of existing dwellings, and mainly an increase in the price of
17 See ABS, National Accounts: National Income, Expenditure and Product Mar 2013, 5206.0. Real net national disposable income per capita increased from $28000 in 1992 to $45000 in 2009.
18 See RBA (2011). The net saving rate is measured as the residual by subtracting consumption and depreciation from household disposable income. This is complicated by the existence of compulsory superannuation savings in Australia, which may have a crowding out effect in survey data. A savings rate calculated as the annual change in the household net financial wealth as a proportion of household disposable income is more volatile and does not exhibit a downward trend.
19 See Connolly and Kohler (2004).
20 Nominal house prices were growing on average at an 8% rate per annum between 1993 and 2005 according to Hansen (2006).
14
land; it also reflects a higher average quality of dwellings. Supply side rigidity of housing is discussed in depth by Hsieh et al (2012) and Kulish et al (2012). At the same time, higher housing prices generated borrowers’ need for greater housing credit in an environment of rising housing equity and low interest rates. The RBA had begun to notice this vicious cycle and decided to start increasing interest rates as early as 2002, as an attempt to cool the housing market down and deflate a potential housing bubble.21
Figure 6: House Price Indexes (Index, 2003-04 = 100) and Growth in Dwelling Index
Households' greater willingness to take on debt can then be explained by rising house prices simultaneously accompanied by the expansion of housing credit and the low and stable nominal interest rates environment – which reduced the initial real repayments for standard mortgage loans and increased borrowing capacity, see Ellis (2006).
In addition, the Australian tax system provides incentives to households to make leveraged investments when asset prices are expected to increase, making owner-occupied housing and, in particular residential investment attractive. It gives property investors incentives to participate in the housing market through `negative gearing’ of related expenses against other income.22 Since 1999, the capital gains tax for investors apply to nominal gains at 50% of their marginal tax rate for housing assets held for at least a year. Investors can deduct the interest on mortgage payments and other
21 On the 8th May 2002, the RBA announced an increase in its cash rate on the basis of overheating of the housing market amongst other concerns; see RBA media release `Statement by the Governor, Mr Ian Macfarlane: Monetary Policy’. http://www.rba.gov.au/media-releases/2002/mr-02-10.html. Accessed 16 August 2013.
22 Residential investors and landlords returns are not restricted by rent control, as is the case in many European countries.
15
cash depreciation expenses from their taxable income. Owner-occupiers have no mortgage interest deductibility, but do not have to pay capital gains tax and imputed rent is non-taxable. State stamp duty tax was levied both on the value of a purchased dwelling and on the mortgage contract for most of the period.23 However, many state and territory governments have provided stamp duty concessions to first home buyers, to facilitate their introduction to homeownership.
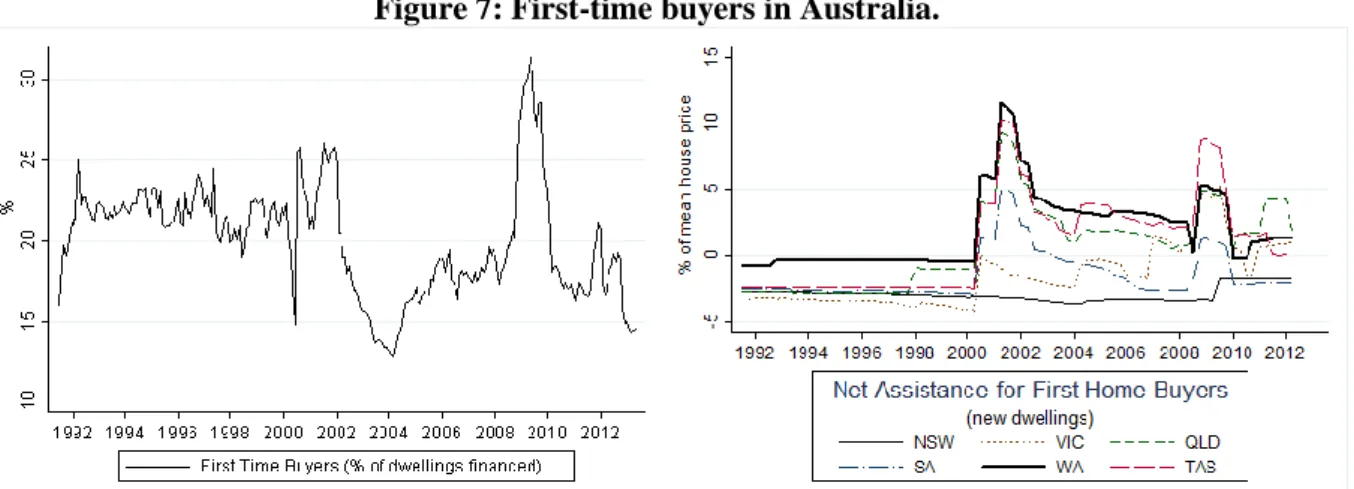
Other policy efforts have been implemented to promote homeownership. The First Home Owner Grant (FHOG) was introduced by the Australian Government in July 2000, initially to offset the introduction of the goods and services tax. Under this scheme, first home buyers could access an $A7000 cash grant when buying or building a dwelling. This Federal grant was then supplemented by state and territory government additional grants, and in some cases stamp duty concessions; for a review of first-home buyer government assistance in Australia, see Dungey, Wells and Thompson (2011). The FOHG cash grant amount has varied over the years, giving preference to new buildings over existing ones, particularly in less urbanized areas, see figure 7.
Figure 7: First-time buyers in Australia.
The proportion of dwellings financed for first time buyers was around 22% until the end of 2002, as shown in figure 7. Many have argued that the grant scheme was effective only in bringing forward housing purchases that would have been made in the absence of the scheme. Wood, Watson and Flatau (2003) suggest that the major contribution of the FHOG was that it relaxed borrowing
16
constraints and reduced the deposit gap. This is because mortgage lenders relaxed their savings requirements, allowing part of the deposit to be the FHOG.24
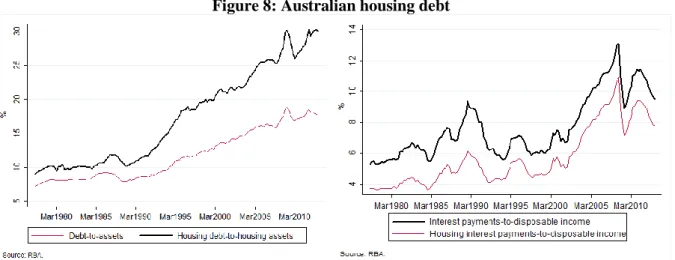
Aggregate household debt to gross assets rose from around 12% in 1995 to reach 25% in 2008. The debt-service to income ratio rose from 7% to 13% between 1995 and 2007, although interest rates had been falling; see figure 8.
Figure 8: Australian housing debt
Existing home owners could afford the mortgages and constituted the main actors in the lending boom in Australia. These borrowers purchased higher valued properties with larger loans or became residential investors following the incentives given by the rise in house prices and the tax system. Most of them were aged in their 40s and had low levels of debt and a strong capacity to service new debt, see Yates (2010). In fact, the RBA reports that the arrears rate in Australia for bank's non-performing housing loans has remained under 0.5% since the mid-1990s.25 In mid-2007, only 0.38% of bank’s housing loans were not performing and in December 2007 the 90-day arrears rate on securitised housing loans represented around 0.47% of outstanding loans as well; see Davies (2009).26
24 LMI credit parameters normally required the borrower to have at least 3%-5% genuine equity to contribute towards the purchase, as evidence of genuine saving capabilities. In 2000, LMI agreed to recognise the FHOG as genuine equity for the purposes of their credit parameters.
25 Box B: Measurement of Housing Arrears, Reserve Bank of Australia Financial Stability Review, September 2009.
26 In Australia, housing loans are defined as non-performing if they are either `past due’ (repayments are at least 90 days past due, but the loan is well covered by collateral) or `impaired’ (at least 90 days past due or not in arrears but otherwise doubtful, and the loan is not well covered by collateral).
17
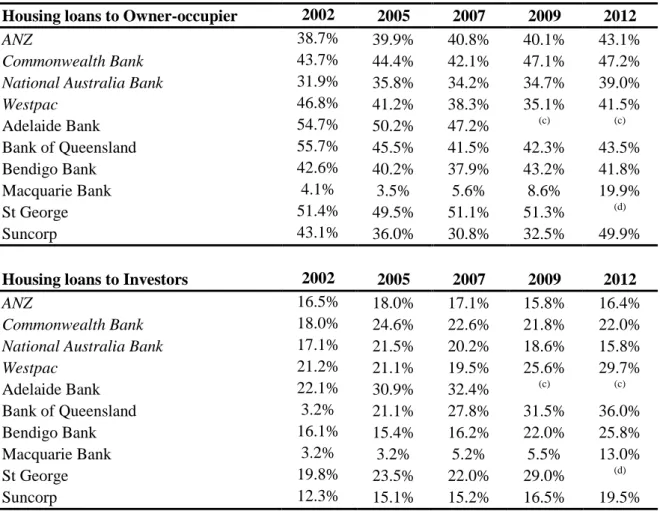
Rising dwelling prices and the negative gearing incentives provided by the tax system led to growth in bank lending to investors at an annual rate of 21% in the 1990s, compared with 13.5% for lending to owner occupiers, see RBA (2002). Around the mid-1990s, the spread between the interest rates charged on investor loans and owner occupier loans practically disappeared. A sizable share of financing products taken by investors has been interest only loans. Table 3 shows housing loans made to owner occupiers and to investors as a proportion of total ADI loans to households during the last decade. Major banks oriented around 40% of their loans to households on residential housing, and 20% on investment housing. Smaller banks focused more on residential housing lending.
Table 3: ADIs Total Loans to Households
Housing loans to Owner-occupier 2002 2005 2007 2009 2012
ANZ 38.7% 39.9% 40.8% 40.1% 43.1%
Commonwealth Bank 43.7% 44.4% 42.1% 47.1% 47.2%
National Australia Bank 31.9% 35.8% 34.2% 34.7% 39.0%
Westpac 46.8% 41.2% 38.3% 35.1% 41.5% Adelaide Bank 54.7% 50.2% 47.2% (c) (c) Bank of Queensland 55.7% 45.5% 41.5% 42.3% 43.5% Bendigo Bank 42.6% 40.2% 37.9% 43.2% 41.8% Macquarie Bank 4.1% 3.5% 5.6% 8.6% 19.9% St George 51.4% 49.5% 51.1% 51.3% (d) Suncorp 43.1% 36.0% 30.8% 32.5% 49.9%
Housing loans to Investors 2002 2005 2007 2009 2012
ANZ 16.5% 18.0% 17.1% 15.8% 16.4%
Commonwealth Bank 18.0% 24.6% 22.6% 21.8% 22.0%
National Australia Bank 17.1% 21.5% 20.2% 18.6% 15.8%
Westpac 21.2% 21.1% 19.5% 25.6% 29.7% Adelaide Bank 22.1% 30.9% 32.4% (c) (c) Bank of Queensland 3.2% 21.1% 27.8% 31.5% 36.0% Bendigo Bank 16.1% 15.4% 16.2% 22.0% 25.8% Macquarie Bank 3.2% 3.2% 5.2% 5.5% 13.0% St George 19.8% 23.5% 22.0% 29.0% (d) Suncorp 12.3% 15.1% 15.2% 16.5% 19.5% Source: APRA. (c)
In November 2007 Adelaide Bank merged with Bendigo Bank forming Bendigo and Adelaide Bank Limited.
(d)
In November 2008 St. George Bank and its branch Bank of South Australia, became part of Westpac Group. In 2011 Westpac announced the relaunch of its subsidiary Bank of Melbourne, which will replace St. George Bank in Victoria.
Overall, during the two decades prior to the global financial crisis, Australian households and investors increased their housing credit demand as a consequence of deregulation (along with
18
competition between lenders, greater access to credit and new products), a stable economic environment (reflected by low inflation and low nominal interest rates, low unemployment, rising incomes and wealth accompanied by rising house price expectations), attractive taxation arrangements, and, arguably, national housing policies. However, there has been no sign of deterioration in credit quality during this period.
3. Global Financial Crisis and Australia
Australia avoided a recession following the global financial crisis (GFC), an outcome often attributed to a strong financial system with prudential lending standards and a stable institutional environment domestically, accompanied by a resource boom linked to China's demand and responsive and timely policy actions; see Davies (2013), IMF (2012) and Yates (2010). However, the GFC exposed the heavy reliance of Australian banks on capital-market funding and affected the housing credit market through increased liquidity risk for lenders. Banks played an important role in facilitating foreign investment through capital inflows, since they were heavily reliant on the overseas wholesale debt market. By corollary, the `credit crunch' closed funding avenues for mortgage lenders, and in turn they contracted the credit given to households.
The main effects of the global recession on Australia were: (1) an increase in the cost of funding for lenders, (2) a deceleration in households’ debt and asset growth, as a consequence of a slow-down in credit growth and (3) a drop in policy interest rates. We first discuss the policy responses to the international financial turmoil, and then focus particularly on the supply of, and demand for, housing finance.
19
3.1 Policy Responses
The first policy action to the crisis was taken by the RBA, who began cutting the policy rate from September 2008, and continued doing so for a year,27 see figure 9. However, between October 2009 and October 2011, interest rates crawled up to 4.75%. In November 2011 the RBA decided to cut interest rates again to support demand as a reaction to uncertainty surrounding the European debt crisis and the slow-down in Chinese growth.28 The most recent drops in interest rates have been aimed at maintaining credit growth and house prices growth, amongst other concerns.29
Figure 9: RBA’s Cash Rate
With the intention of supporting the RMBS market and with it wholesale mortgage lenders, in September 2008, the Australian Office of Financial Management (AOFM) purchased $A8 billion in RMBS. Half of the amount purchased was targeted to non-ADI mortgage originators. This measure was a reaction to the limited issuance by securitisers within Australia -- which was initially restricted with the contraction of liquidity in international capital markets. The program was reinforced in
27 During September 2009 the cash rate was 3%, a historic minimum. More recently, in August 2013, the RBA cut interest rates further to 2.5%, which represents a 50-year minimum.
28 See RBA announcement on November 1 2011, `Statement by Glenn Stevens, Governor: Monetary Policy Decision ’. http://www.rba.gov.au/media-releases/2011/mr-11-24.html. Accessed 16 August 2013.
29 See RBA announcement on August 6 2013, `Statement by Glenn Stevens, Governor: Monetary Policy Decision ’. http://www.rba.gov.au/media-releases/2013/mr-13-15.html. Accessed 16 August 2013.
20
October 2009 with a new purchase of $A8 billion in RMBS, and another $A4 billion in December 2010. To further support liquidity in the market, the RBA expanded the range of securities for its repurchase agreements to include RMBS.
Fiscal policy also contributed to supporting the economy with a $A10.4 billion fiscal stimulus in October 2008.30 This Economic Security Strategy was oriented first to households, through a direct one-off payment incentive to encourage consumption expenditure; it then targeted the construction industry through first home buyer grant incentives; while the last stage was focused on fostering long term infrastructure investment. The Government supported this strategy in February 2009 with the
Nation Building and Jobs Plan stimulus package, worth $A42 billion, to be implemented over four years; see Swan and Tanner (2009).
While monetary policy aimed at supporting the sources of funding for mortgage providers, fiscal policy stimulated housing consumption.
Financial system support also played a very important role. Some basic structures were already in place. The financial system was regulated and controlled by the Council of Financial Regulators -- APRA, ASIC, RBA and Australian Treasury. APRA's capital standards for ADIs closely follow those set by the Basel Committee, and APRA has enforced compliance more stringently (and earlier) than in many other countries. For example, APRA and RBA had been assessing financial stability through stress tests during 2003 and 2005, as a result of emerging concern on the rise in household debt and the growth of house prices;31 see APRA (2003), Coleman et al (2005), APRA (2010).
Lenders Mortgage Insurance (LMI) has been in place since 1965.32 It provides private insurance to lenders in the event of borrower default on a residential mortgage loan; the cost is borne by the borrower. Its initial objective was to facilitate the entry of first home buyers to the mortgage market.
30
For more details see Commonwealth Ombudsman (2009), `Administration of the Economic Security Strategy Payment. An examination of the implementation, monitoring and review of the scheme', Report No. 16/2009.
http://www.ombudsman.gov.au/files/investigation\_2009\_16.pdf. Accessed 4th August 2013.
31 APRA had also experienced the need for more regulatory supervision with the failure of a major insurance company (HIH) in March 2001.
32 Lenders Mortgage Insurance (LMI) is regulated by APRA under the Insurance Act 1973 and the General
21
High LVR loans attract a 100% risk weight under APRA's implementation of Basel capital adequacy rules; but ADIs could obtain a concessional risk weight of 50% on high LVR (over 80%) loans with approved private LMI. ADIs and wholesale mortgage lenders also decided to acquire LMI in order to transfer credit risk from their loan books and as a credit enhancement tool to gain access to wholesale funding through the mortgage backed securitisation markets. While non-bank mortgage managers and originators insure all loans irrespective of the LVR,33 major banks insure 20% of their mortgages, see ICA (2003).
The response to the financial turmoil in late 2008 was aided by the existing regulatory standards. APRA had implemented the Basel II framework through prudential standards and prudential practice guides from 1 January 2008. The AOFM securities lending facility, established in 2004 to prevent failure in the secondary market trades, was heavily used when the Commonwealth Government Securities market became illiquid during 2008. However, a range of new policies were also developed as a reaction to the international crisis.
In October 2008 the Commonwealth Government introduced the Financial Claims Scheme (FCS) which established a guarantee of deposits of up to $A1 million per account holder per Australian ADI. At the same time, a fee-based Guarantee Scheme for wholesale funding (with a rolling maturity of five years) and large deposits34 (over $A1 million) was also introduced with the intention to assure ADIs' access to funding. These guarantee schemes not only assisted ADIs to access funding, but also provided confidence in the capital markets and insure that Australian financial institutions were not disadvantaged compared with international institutions with existing deposit guarantee schemes.35 The fee for the Guarantee Scheme was lower for higher rated institutions. By 2010, the Guarantee Scheme
covered 7.5% of total ADI liabilities, mainly long-term wholesale funding; it covered 15% of the value of all wholesale liabilities and 1% of the value of total large deposits (more than A$1 million). The wholesale funding guarantee was removed for new liabilities from March 2010, and banks have
33 Generally when LVRs are above 80% mortgage managers pass the LMI premium onto the borrower.
34 Formally known as Australian Government Guarantee Scheme for Large Deposits and Wholesale Funding. For an insight on the scheme see Schwartz (2010).
35 See Schwartz (2010), Claessens et al (2010: Table 1) and Demirgüҫ-Kunt, et al (2008) – Chapter 11 Deposit Insurance around the World: A Comprehensive Database, Chapter 11, 263.
22
been `buying back’ insured bond issues as international interest rates have fallen. FCS remains a guarantee for deposits up to $A250000 since February 2012.
All of these measures helped domestic financial institutions, but as the global financial crisis advanced more adjustments have been made. In October 2011 the Government introduced legislation to allow ADIs to issue covered bonds.36 The intention with this legislation was to facilitate funding diversification by allowing ADIs to access low risk (and lower funding cost) and longer maturity debt securities held on issuer’s balance sheet. RBA reports that as of March 2013 banks have issued $A50 billion in covered bonds since their introduction, with AAA credit rating.
With the intention of easing the potential customer transition between lenders, on July 2011 the Federal Government banned exit fees on variable home loans; see Rudd and Stewart (2011).
Currently, Australia has a well-capitalized, although concentrated, banking system. APRA intends to implement Basel III standards for capital ahead of schedule. The RBA will create a committed liquidity facility in 2015 under which ADIs will be able to access liquidity using repurchase agreements outside normal market operations in exchange for a fee. This initiative will help ADIs meet the Basel III proposed liquidity coverage ratio.
3.2 Market reaction – supply of housing credit
The impact of the crisis for Australian ADIs resulted in increases in wholesale funding costs, particularly for longer maturities, and reduced access to longer-term funding sources; see Deans and Stewart (2012).37 The left panel of figure 10 portrays the spread between the bank bill yield and the overnight index swap (OIS) yield, showing high peaks commencing in late 2007, reflecting high credit and liquidity risks.
36 The legislation is the Banking Amendment (Covered Bonds) Act 2011. Under the legislation ADIs must limit the value of its cover pools to a maximum of 8% of its assets.
37 For more information on the recent developments in the domestic market for short-term debt securities see Boge and Wilson (2011).
23
Figure10: Money Market Rates
Major banks increased their use of deposits and reduced their use of short-term debt, even though they could still access expensive short- and long-term debt given their strong credit ratings. The regional banks cut the use of securitization and increased their use of deposits, as shown previously in table 2. Foreign banks have also reduced their use of long-term wholesale debt and domestic deposits. Credit unions and building societies continue to raise the vast majority of their funds via deposits, with no support from an inactive securitisation market; see Brown, Davies, Fabbro and Hanrick (2010: table 1). Banks have been also trying to increase their common equity in recent years by retaining earnings and by share placements. Major banks have also raised funding from covered bonds since October 2011.
The securitisation market was strongly affected by the global financial crisis. The developments in the credit default swap (CDS) market are a good indication of this impact, as the perceived risk of banks around the world peaked, see figure 11. The previously rapid growth in domestic securitisation (of primarily residential mortgages) slowed dramatically, while international issues largely ceased despite the low risk nature of Australian securitised products. Between July 2007 and early 2009, the securitisation market in Australia was disrupted. Non-ADI mortgage originators relied heavily on this source of funding, while small regional banks, credit unions and building societies had been increasing their sourcing from the secondary market. As previously mentioned, major banks used securitisation only marginally. Consequently, wholesale mortgage originators, smaller banks, building
24
societies and credit unions became less competitive, finding it harder to raise funding and offer competitive interest rates. To maintain some level of securitisation activity, particularly for smaller ADIs and non-ADI mortgage lenders, the Treasurer directed the AOFM to invest up to $A20 billion to support securitisation markets, as discussed in the sub-section 3.1. Since 2009 the securitisation market has recovered but remains below pre-crisis intensity.
Figure 11: 5 year Spread AA CDS
The increasing share of funding sourced from deposits and the shift away from short-term wholesale funding towards long-term wholesale funding -- facilitated by government guarantees -- suggest both that the alternative sources for funding were restricted or hard to access, and that major banks have sought to reduce their rollover risk -- the risk associated with replacing maturing wholesale debt. These trends are consistent with the objectives of the Basel III global liquidity standards. If banks are taking more long-term debt, rather than short-term debt, they are expecting interest rates to increase -- taking a fixed rate position and offering a variable rate to consumers to gain by speculating with a rise in interest rates. This hypothesis is supported by the drop in the numbers and proportion of fixed-rate
25
mortgages transacted.38 Figure 12 shows that the proportion of fixed rate mortgages committed reached a minimum between 2007 and 2009.
Figure 12: Fixed Rate Mortgages
(% of all dwellings with housing finance commitments)
Major banks have focused on domestic deposit funding, mainly through term deposits.39 Domestic deposits increased from around 43% of liabilities to around 53%. The increased usage of deposit funding is likely to be reinforced by Basel III liquidity requirements which, in general, give greater weight to retail deposits as stable sources of funds and also induce use of longer term funding instruments. This competition for domestic term deposits has pushed term deposit rates up, as shown in figure 13.
38 In Australia, fixed-rate mortgages are defined as loans with a set interest rate that cannot be varied for a minimum period of two years.
26
Figure 13: Bank Term Deposit Rates ($A10000)
Major banks’ competition for domestic deposit funding has significant implications for smaller institutions that primarily rely on this source of funding. This competition effect, supported by the implicit government guarantee which allows major banks to enjoy a funding cost advantage, has contributed in a higher concentration of the mortgage market around the major banks;40 this argument is supported by the lower panel of table 1. While in 2011 major banks accounted for approximately 75% of ADI assets, and approved around 80% of residential home loans, Donovan and Gorajek (2011), in 2012 the four major banks held 80% of banking assets and 88% of residential mortgages, see IMF (2012).
As shown in Figure 4, the increased cost of wholesale debt funding together with the higher term deposit rates in the domestic market as a result of increased competition, have been reflected in higher loan interest rates. Prior to 2007, banks’ costs of funds followed the cash rate and generally banks adjusted variable rate mortgage interest rates when the cash rate was reviewed. With the global financial crisis this relationship weakened and the spread between the standard variable rate and the cash rate widened as costs of funds increased for lending institutions. Further potential contributor to
40 IMF (2012) argues that major banks are systemically risky given their size, interconnectedness and complexity.
27
higher mortgage interest rates could be an increase in default risk. However, major banks reported that the expected loss rate for residential mortgage lending rose by only about 5 basis points from March 2008 to a peak in March 2010, Fabbro and Hack (2011).
Funding costs rose more than the RBA target rate. The cumulative change in the cost of funding for banks spreads to the cash rate in 2012 was estimated to be about 120-130 basis points higher than mid-2007, see Deans and Stewart (2012: graph 8). 41 Most of the increase occurred during 2008 and early 2009 when the financial crisis was at its most intense. Since mid-2011 bank's funding costs fell, but by less than the reduction in the cash rate. There were particularly pronounced increases in the cost of term deposits and long-term wholesale debt relative to the cash rate, which reflects competition, mainly for term deposits, and sentient concerns about the global banking industry.
Major banks have been experiencing a small increase in their net interest margin, which reached pre-crisis heights by the end of 2009, see Brown et al (2010). On the other hand, regional banks have been facing declining net interest margins, see Robertson and Rush (2013: graph 14).
3.3 Market reaction – demand for housing credit
Growth in both household assets and household debt decelerated with the international financial tightening. The fall in equity values particularly affected retired, or near retired, households through their retirement savings. The increasing trend in the proportion of assets to disposable income was curtailed by the global financial developments, as shown in the left panel of Figures 5. Household debt-to-disposable income growth also stopped as evidenced in the right panel of Figure 5. Credit conditions tightened, although households may have also become more risk averse after the global financial crisis. The sharp increase in the debt-to-asset ratio in 2008 could be attributed to the decline in the value of housing assets, see left panel of Figure 8 and Figure 6. The price of existing houses dropped between 2008 and 2009, and it then increased to remain 50% higher than in 2003-2004.
28
However, household deposits in the ADI sector have been growing since 2007, as shown for example in the middle panel of Table 2.42 Households direct deposit holdings have increased mainly because of asset price declines and poor returns on investments during the financial crisis, but also because of strong competition between banks for household deposits to replace international wholesale borrowings, and the deposit guarantee provided by the Government. The household net saving ratio as a per cent of household disposable income has been rising since 2004 from around -2% to 10% in 2011, see RBA (2011: graph C1).
On the other hand, the drop in nominal interest rates has facilitated debt servicing for existing mortgages, see right panel of Figure 8. However, Yates (2012) argues that asymmetries in borrowers' responses to increases and decreases in interest rates could exist, as borrowers maintained their scheduled repayments even when interest rates have dropped, to reduce their debt faster. This suggests a passive reaction to drops in interest rates and therefore, a maintenance of repayment schedules which implies a faster payment of principal outstanding. Australian households tend to have prepayment buffers and be ahead of their scheduled repayments.43 RBA (2012) reports that 22% of indebted household made substantial principal early repayments on their mortgages in 2010, compared to an average of 15% between 2002 and 2007.
The FHOG scheme was boosted by the fiscal stimulus policy in 2008 in order to stimulate construction of new dwellings as previously discussed. Under the Economic Security Strategy first home buyers were eligible for grants up to $A21000 for the purchase of newly constructed homes. In 2008 prices, the grant represented 5% of the median house price.44 Many first home owners took advantage of the boost; the left panel of Figure 7 shows that the proportion of first time buyers doubled during this period. Nevertheless, with house prices still relatively high, and expectation of
42
Also see Connolly, Fleming and Jääskelä (2012).
43 Given the tax incentives, over half of owner-occupiers are estimated to be ahead on their mortgage repayments compared to less than 40% of investors.
44 The $A21000 grant provided to first home buyers who were building or purchasing new homes represented a 4.5% of the median price for established houses in Sydney and 5.5% for established houses in Melbourne, while in rural areas such as Hobart it represented 7% of the median house prices, see ABS, House Price Indexes: Eight Capital Cities, Jun 2013, 6416.02.
29
higher house price growth, tighter lending standards and uncertainty in the real markets, the number of dwelling financed for first time buyers is currently below 15%.
Loan arrears increased with the global financial crisis, but they remain at relatively low levels by international standards. Banks’ on-balance sheet non-performing loans increased from 0.3% of all outstanding loans in 2007 to 0.6% in 2009. Securitised loans in arrears increased from around 0.6% to 1.1% during the same period. Non-conforming loans in arrears rose from 6.5% of all outstanding loans in arrears in 2007 to over 9.4% in 2009.
The aftermath of the financial turmoil was a deceleration and stagnation of housing credit and a tightening of lending standards. Households shifted from being net borrowers to net lenders. Despite policies aimed at encouraging housing market activity, borrowers, both owner occupier and investors, remain cautious in the uncertain environment.
4. Current mortgage products in Australia
Through the twenty five years of financial deregulation the menu of mortgage products from which Australian borrowers may choose has been extended. We present an overview of mortgage products offered in Australia in 2013.
Currently, the most common home loan product offered in Australia is the variable home loan, accounting for approximately 85% of all mortgages and 60% of all home loans for owner-occupiers. Ellis (2006) observes that in countries where mortgage interest payments are not deductible for owner-occupiers (as is the case in Australia) variable rate loans are the predominant mortgage type. Non-interest deductibility gives incentives to owner-occupier mortgagees to make frequent pre-payments and fixed rate mortgages tend to have high prepayment costs. Variable rate mortgages offer a variable interest rate that fluctuates following the cost of funds of the mortgage originator and the interbank cash rate reported by the RBA. The major banks have typically added a spread of around 180 basis points to the RBA cash rate; however, in recent years this spread has been wider, reaching
30
300 basis points, see Figure 4. For an overview of the features and costs of a standard variable rate mortgage see Table 4 in the Appendix.
Other variable rate products are also available. `Honeymoon’ mortgages generally provide some discount from the variable rate for a fixed period of time, also called a `teaser’ rate, and have fewer loan features -- for example offset accounts45 are not offered. `Honeymoon’ loans have the lowest associated advertised interest rates;46 see Table 5.
For these variable rate mortgage products, early or additional repayments are not generally penalized, and repayments can sometimes be redrawn. Because mortgage interest is not tax deductible, a redraw facility offers a relatively high risk-free after-tax vehicle for short-term saving for many households. The maximum loan amount is 80% of the valuation of the property, but it could be up to 90-95% if borrowers take loan mortgage insurance (LMI). These types of loans require an establishment fee and a monthly loan service fee, which sometimes is waived or negotiated by loan officers according to borrowers' characteristics. These loans do not offer the rate lock option47, but they may offer an interest only option. Interest only loans are more common for investor mortgages. Ellis (2006) suggests that the mortgage interest deductibility for investors in Australia allows them to consider an interest-only loan in the expectation that the post-tax returns exceed the interest paid on the interest only loan.
Fixed rate home loans represent currently around 20% of the mortgages taken in Australia, see Figure 12.48 These mortgage products offer certainty of repayment for a fixed period and then reset into a variable interest rate mortgage. Interest rates are generally fixed between 1-5 years, but could be fixed for up to 10-15 years.49 Interest rates increase with the length of the fixed period. Early repayment is
45
Offset accounts are a savings or transaction account associated with the mortgage account. The credit balance of the transaction account is offset daily against the outstanding loan balance, reducing the interest payable on the mortgage.
46
Houston et al (1991) argue that the cost of a teaser adjustable-rate mortgage is typically built into the contract rate after the teaser has expired and lenders may also offset the teaser rate through upfront fees and points. 47 Rate lock option refers to the advertised interest rate at the time of application being kept fixed for a maximum of 90 days in exchange of a fee.
48 Historically, fixed-rate mortgages have represented around 12% of all mortgages in Australia. The current high proportion of fixed rate home loans is likely due to current low interest rates.
31
highly penalized, with the borrower compensating the bank for the present discounted value of its lost income stream. A rate lock option, offset account and additional repayments are accessible during the fixed term of the loan, but the latter can only be made up to a pre-set tolerance amount. A repayment redraw option can only be used once the fixed rate period is over, and an interest-only option may be available; see Table 6.
In general, all these mortgage products can be taken for a maximum term of 30 years, but the typical loan term is 25 years; interest is compounded daily, and repayments can be made weekly, fortnightly or monthly. The aggregate average loan-to-value ratio (LVR) is 67%.50 Options to switch loans and loan portability are generally available, although not commonly exercised.
Home equity loans,51 secured on a registered mortgage over the residential property, originated in the mid-1990s, and became relatively popular around 2006, probably as a result of the strong growth in house prices. A home equity loan is a line of credit secured on the equity of the existing property. These are very distinctive loans. Therefore, borrowers taking a home equity loan need to be existing mortgage holders with the institution or out-right owners of their property, and most of them would be re-negotiating their terms. Line of credit funds from the home equity are available for any personal use, and they can be accessed in diverse ways. The advertised interest rates for home equity loans are
50 The median LVR is around 72%; see APRA (2008).
51 Besides home equity loans, there are three other types of equity release products which are not very popular in Australia: (1) under a shared appreciation mortgage, the borrower gives up the right to some of the capital gain on the property in return for paying reduced or no interest on the loan; (2) reverse mortgages are contracts where the borrower accesses a loan against the equity of their home, and the principal and interest need not be repaid until the home is sold (in the event of death of the borrower or voluntary eviction); (3) in a home reversion scheme, homeowners sell a part or all of their home below market value, but can remain in the property until the event of death or voluntary inhabitation -- a sale-lease model and sale-mortgage model are available. These products reappeared in the Australian housing credit market around 2004, after previous limited acceptance; see ASIC (2005) and Alai et al (2013).
Reverse mortgages are the most popular of these three equity release products, and are mainly distributed by mortgage brokers (also see Australian Government Pension Loans Scheme). Reverse mortgages allow senior homeowners (over 60 years old) to access the equity of their home until they decide not to live in their homes anymore or in the event of death; the lender then recovers the loan either by payment of the debt or by acquiring the property securing the loan. Repayments are not scheduled; interest and fees accumulate until the loan is repaid. The maximum loan amount and the LVR increase with age -- the loan amount is capped and the maximum LVR is generally 45%. On 18 September 2008 the Government introduced `negative equity protection' on all reverse mortgage contracts, which means that the borrower can't owe more than the equity of their home. Establishment fees and interest rates are relatively high; this possibly is explained by the fact that lenders need to bear longevity risk, as well as consider adverse selection and moral hazard; see Davidoff and Welke (2004).
32
relatively high; and an establishment fee and annual service fee are required. The repayment frequency is not scheduled: it can be a once-off payment or a regular payment. Repayments can sometimes be redrawn, the rate lock option is not offered, but the interest only option is available; see Table 7.
Banks also offer home loan packages with discounts -- subject to the size of the loan and the risk profile of the borrower -- and different loan features. Examples of features include: extra repayments without penalty, repayment redraw facility, top ups, repayment holidays, and an interest off-set account. Some other home loans offered include construction loans, residential land loans, improvement loans, split loans and residential investment property loans (RIPL). A split loan assigns a portion of the loan amount to a variable interest rate, and another portion to a fixed interest rate.
Interest-only loans do not require borrowers to make repayments of principal for up to 10-15 years. The RBA reports that 15% of owner-occupier loans were interest-only loans in 2005, compared to 10% in 2003. 52 In 2005, the share of interest-only investor loans was around 60%, compared to around 50% in 2003. IMF (2012) reports that in 2012 30% of new mortgages are interest-only mortgages and 55% of those mortgages are interest-only investor loans. The interest-only option is also available for low-documentation loans and non-conforming loans.
Low-documentation loans are those where borrowers self-report their financial position, and may be used for example by unincorporated businesses which are using the family home as security. During the five years from 2000, approximately 10% of the value of the loans approved arose from low-doc loans based on self-certification of repayment capacity, compared with less than 0.5% in 2000. Non-conforming loans provided by non-authorised deposit-taking institutions, where borrowers do not meet standard lending criteria,53 accounted for less than 1% of outstanding housing loans in 2007. Between 2000 and 2007 the proportion of banks' on-balance sheets loans classified as non-conforming rose from 0.2% to 0.4%; and by 2011 this increased to 0.8%. Most non-non-conforming loans were issued in around 2005 when lending standards were relaxed. The average LVR for these loans is
52 Box B: Interest-only Housing Loans, Reserve Bank of Australia Financial Stability Review, September 2006. 53 Borrowers typically either have poor credit histories or are seeking a loan with a LTV above 95%. The first specialist non-conforming mortgage provider entered the Australian market in 1997.