Prevention and Detection of Financial Statement
Fraud – An Implementation of Data Mining
Framework
Rajan Gupta
Research Scholar, Dept. of Computer Sc. & Applications, MaharshiDayanand University,
Rohtak (Haryana) – India.
Nasib Singh Gill
Professor,Dept. of Computer
Sc. & Applications, MaharshiDayanand University, Rohtak (Haryana), India.
Abstract— Every day, news of financial statement fraud is adversely affecting the economy worldwide. Considering the influence of the loss incurred due to fraud, effective measures and methods should be employed for prevention and detection of financial statement fraud. Data mining methods could possibly assist auditors in prevention and detection of fraud because data mining can use past cases of fraud to build models to identify and detect the risk of fraud and can design new techniques for preventing fraudulent financial reporting. In this study we implement a data mining methodology for preventing fraudulent financial reporting at the first place and for detection if fraud has been perpetrated. The association rules generated in this study are going to be of great importance for both researchers and practitioners in preventing fraudulent financial reporting. Decision rules produced in this research complements the prevention mechanism by detecting financial statement fraud. Keywords- Data mining framework; Rule engine; Rule monitor.
I. INTRODUCTION
Financial statement fraud is a deliberate misstatement of material facts by the management in the books of accounts of a company with the aim of deceiving investors and creditors. This illegitimate task performed by management has a severe impact on the economy throughout the world because it significantly dampens the confidence of investors.
The magnitude of this problem can be evaluated by the fact that a number of Chinese companies listed on US stock exchanges have of faced accusations accounting fraud, and in June 2011, the U.S. Securities and Exchange Commission warned investors against investing with Chinese firms listing via reverse mergers. While over 20 US listed Chinese companies have been de-listed or halted in 2011, a number of others have been hit by the resignation of their auditors [1].
Association of certified fraud examiners (ACFE) in its report to the nation on occupational fraud and abuse (2012) [2] suggests that the typical organization loses 5% of its revenue to fraud each year. The median loss caused by occupational fraud cases was $140,000.
This study by ACFE reveals that perpetrators with higher levels of authority tend to cause much larger losses. The median loss among frauds committed by owner / executives
was $573,000, the median loss caused by managers was $180,000 and the median loss caused by employees was $60,000. The report by the ACFE also measured the common methods of detecting fraud and found that in more than 43 % cases tips and complaints have been the most effective means of detecting frauds.
Prevention and detection of financial statement fraud has become a major concern for almost all organisations globally. Though, it is a fact that prevention of financial statement fraud is the best way to reduce it, but detection of fraudulent financial reporting is critical in case of failure of prevention mechanism.
The aim of this paper is to provide a methodology for prevention and detection of financial statement fraud and to present the empirical results by implementing the framework. In this research, we test the applicability of data mining framework for prevention and detection of financial statement fraud. As per the recommendations of the framework we apply descriptive data mining for prevention and predictive data mining techniques for detection of financial statement fraud.
This paper is organized as follows. Section 2 summarizes the contribution in the field of prevention and detection of financial statement fraud. Section 3 implements the data mining framework for detection of fraud if prevention techniques have failed followed by conclusion (Section 4).
II. RELATED WORK
Cost of financial statement fraud is very high both in terms of finance as well as the goodwill of the organization and related country. In order to curb the chances of fraud and to detect the fraudulent financial reporting, number of researchers had used various techniques from the field of statics, artificial intelligence and data mining.
For instance, Spathis et al [3] compared multi-criteria decision aids with statistical techniques such as logit and discriminant analysis in detecting fraudulent financial statements. Neural Network based support systems was proposed by Koskivaara [4] in 2004. He demonstrated neural network as a possible tool for use in auditing and found that the main application areas of NN were detection of material errors, and management fraud.
A decision tree was constructed by Koh and Low [5] in order to predict the hidden problems in financial statements by examining the following six variables: quick assets to current liabilities, market value of equity to total assets, total liabilities to total assets, interest payments to earnings before interest and tax, net income to total assets, and retained earnings to total assets. Kirkos et al [6], carry out an in-depth analysis of publicly available data of 76 Greek manufacturing firms for detecting fraudulent financial statements by using three Data Mining classification methods namely Decision Trees, Neural Networks and Bayesian Belief Networks. They investigated the usefulness of these techniques in identification of FFS.
In 2007, a genetic algorithm approach to detecting financial statement fraud was presented by Hoogs et al [7]. An innovative fraud detection mechanism is developed by Huang et al. [8] on the basis of Zipf’s Law. This technique reduces the burden of auditors in reviewing the overwhelming volumes of datasets and assists them in identification of any potential fraud records. A novel financial kernel using support vector machines for detection of management fraud was developed by Cecchini et al [9].
In 2008, the effectiveness of CART on identification and detection of financial statement fraud was examined by Belinna et al [10] and found CART as a very effective technique in distinguishing fraudulent financial statement from non-fraudulent. Juszczak et al. [11] apply many different classification techniques in a supervised two-class setting and a semi-supervised one-class setting in order to compare the performances of these techniques and settings.
Further, Zhou & Kapoor [12] in 2011 applied four data mining techniques namely regression, decision trees, neural network and Bayesian networks in order to examine the effectiveness and limitations of these techniques in detection of financial statement fraud. They explore a self – adaptive framework based on a response surface model with domain knowledge to detect financial statement fraud.
Ravisankar et al [13] applied six data mining techniques namely Multilayer Feed Forward Neural Network (MLFF), Support Vector Machines (SVM), Genetic Programming (GP), Group Method of Data Handling (GMDH), Logistic Regression (LR), and Probabilistic Neural Network (PNN) to identify companies that resort to financial statement fraud on a data set obtained from 202 Chinese companies. They found Probabilistic neural network as the best techniques without feature selection. Genetic Programming and PNN outperformed others with feature selection and with marginally equal accuracies.
Recently, Johan Perols [14] compares the performance of six popular statistical and machine learning models in detecting financial statement fraud. The results show, somewhat surprisingly, that logistic regression and support vector machines perform well relative to an artificial neural network in detection and identification of financial statement fraud.
The review of the existing literature reveals that the research conducted till date is solely in the field of detection and identification of financial statement fraud and a very little
or no work has been done in the field of prevention of fraudulent financial reporting.
Therefore, in the present research we implement a data mining framework for prevention along with detection of financial statement fraud.
The major objective of this research is to test the applicability of predictive and descriptive data mining techniques for detection and prevention of fraud respectively by implementing a data mining framework. In order to feel the sense of fraud, we implement association rule mining and to detect fraudulent financial reporting we apply three classification techniques namely decision trees, naïve Bayesian classifier and Genetic programming.
III. THE METHODOLOGY:APPLICABILITY &ITS IMPLEMENTATION
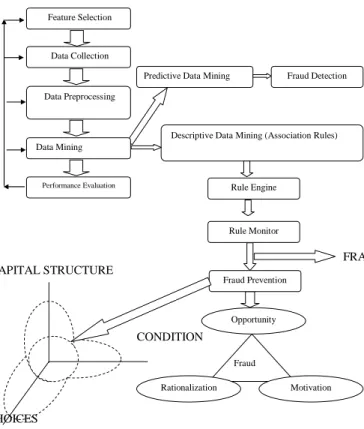
The methodology applied in this paper is a data mining framework of Gupta & Gill (2012) [15]. The framework is presented as Fig 1.
The first step of the framework is feature selection. We selected 62 financial ratios / variables as features to be used as input vector in further analysis.
These features represent behavioural characteristics along with measures of liquidity, safety, profitability and efficiency of the organisations under consideration. Table 1 present the list of 62 features.
Figure 1: A data mining framework for prevention and detection of financial statement fraud.
Feature Selection
Data Collection
Data Preprocessing
Performance Evaluation
Predictive Data Mining Fraud Detection
Descriptive Data Mining (Association Rules)
Opportunity Fraud Risk Rationalization Motivation Rule Engine Rule Monitor Fraud Prevention Data Mining FRAUD ALERT CAPITAL STRUCTURE CONDITION S CHOICES
Table 1: Features For Prevention & Detection Of Financial Statement Fraud
S.No. Financial Items / Ratios
1 Debt 2. Total assets 3 Gross profit 4 Net profit
5 Primary business income 6 Cash and deposits 7 Accounts receivable
8 Inventory/Primary business income 9 Inventory/Total assets
10 Gross profit/Total assets 11 Net profit/Total assets 12 Current assets/Total assets 13 Net profit/Primary business income
14 Accounts receivable/Primary business income 15 Primary business income/Total assets 16 Current assets/Current liabilities 17 Primary business income/Fixed assets 18 Cash/Total assets
19 Inventory/Current liabilities 20 Total debt/Total equity 21 Long term debt/Total assets 22 Net profit/Gross profit 23 Total debt/Total assets 24 Total assets/Capital and reserves 25 Long term debt/Total capital and reserves 26 Fixed assets/Total assets
27 Deposits and cash/Current assets 28 Capitals and reserves/Total debt 29 Accounts receivable/Total assets 30 Gross profit/Primary business profit 31 Undistributed profit/Net profit
32 Primary business profit/Primary business profit of last year 33 Primary business income/Last year's primary business income 34 Account receivable /Accounts receivable of last year 35 Total assets/Total assets of last year
36 Debit / Equity
37 Accounts Receivable / Sales 38 Inventory / Sales
39 Sales – Gross Margin 40 Working Capital / Total Assets 41 Net Profit / Sales
42 Sales / Total Assets 43 Net income / Fixed Assets 44 Quick assets / Current Liabilities 45 Revenue /Total Assets 46 Current Liabilities / Revenue 47 Total Liability / Revenue 48 Sales Growth Ratio 49 EBIT
50 Z – Score
51 Retained Earnings / Total Assets 52 EBIT / Total Assets
53 Total Liabilities / Total assets 54 Cash return on assets
55 Interest expense / Total Liabilities 56 EBIT / sales
57 Age of the company (Number of years since first filing available from provider)
58 Change in cash scaled to total assets
59 Change in current assets scaled by current liabilities 60 Change in total liabilities scaled by total assets 61 Size of company on the basis of assets 62 Size of company on the basis of revenue
During the second step of Data Collection, all the financial ratios of Table 1 have been collected from financial statements namely balance sheet, income statement and cash flow statement for 114 companies listed in different stock exchanges globally. The dataset used in this study has been collected from www.wikinvest.com. The companies accused of fraudulent financial reporting has been identified by analysing Accounting and Auditing Enforcement Releases published by S.E.C. (U.S. Securities and Exchange Commission) for the period of five years starting from 2007. All the incidents of violation of the Foreign Corrupt Practices Act (FCPA) have been removed from the sample, because FCPA prohibits the practice of bribing foreign officials and most of the AAERs issued because of FCPA do not reflect which financial statement viz. balance sheet or income statement, is affected.
We identified 29 organisations with charges of issuing fraudulent financial statements and hence termed as fraudulent in this study. 85 organisations out of total of 114 have been marked as non – fraudulent since no indication or proof of falsifying financial statement has been reported. However, absence of any proof does not guarantee that these firms have not falsified their financial statements or will not do the same in future.
In order to make dataset ready for mining, data need to be pre - processed. Data has been transformed in to an appropriate format for mining during the step of Data preprocessing. Dataset is cleaned further by replacing missing values with the mean of the variable. Each of the independent financial variables has been normalized by using range transformation (min = 0.0, max = 1.0).
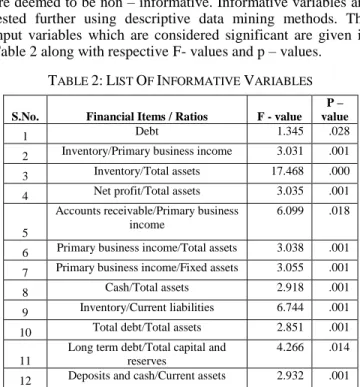
We compiled all the 62 input variables given in Table 1.In order to reduce dimensionality of the dataset we applied one way ANOVA. The variables with p – value <=0.05 are considered significant and informative and with high p – value are deemed to be non – informative. Informative variables are tested further using descriptive data mining methods. The input variables which are considered significant are given in Table 2 along with respective F- values and p – values.
TABLE 2:LIST OF INFORMATIVE VARIABLES
S.No. Financial Items / Ratios F - value
P – value
1 Debt 1.345 .028
2 Inventory/Primary business income 3.031 .001 3 Inventory/Total assets 17.468 .000 4 Net profit/Total assets 3.035 .001
5
Accounts receivable/Primary business income
6.099 .018
6 Primary business income/Total assets 3.038 .001 7 Primary business income/Fixed assets 3.055 .001
8 Cash/Total assets 2.918 .001
9 Inventory/Current liabilities 6.744 .001 10 Total debt/Total assets 2.851 .001 11
Long term debt/Total capital and reserves
4.266 .014 12 Deposits and cash/Current assets 2.932 .001
13 Capitals and reserves/Total debt 2.213 .003 14 Gross profit/Primary business profit 3.847 .008 15 Accounts Receivable / Sales 1.702 .021 16 Working Capital / Total Assets 2.906 .001 17 Sales / Total Assets 12.818 .003 18 Net income / Fixed Assets 3.038 .001 19 Quick assets / Current Liabilities 1.839 .050 20 Revenue /Total Assets 12.818 .003 21 Capital and Reserves / Total Debt 1.130 .049 22 Retained Earnings / total assets 3.039 .001
23 EBIT 4.363 .023
24 EBIT / Total Assets 3.043 .001
25 Z – score 3.054 .001
26 Total liabilities / Total Assets 3.154 .002 27 Cash flow from operations 1.720 .018 28 Cash return on assets 3.940 .002
29 Interest Expenses 1.806 .010
30 Interest exp / Total Liabilities 1.440 .042 31
Size of the company on the basis of assets
1.179 .043 32 Change in cash scaled by total assets 2.967 .001 33
Current Liabilities of the previous year
1.391 .028 34 Total Liabilities of the previous year 1.346 .022 35
Change in Total Liabilities scaled by Total Assets
3.188 .001
The step of data preprocessing is followed by selection of an appropriate data mining technique. The framework suggests the use of descriptive data mining technique for prevention and predictive methods for detection of financial statement fraud. Therefore, we first apply association rule mining for preventing fraudulent financial reporting at the first place.
We implement association rules by using RapidMiner version 5.2.3. All the informative variables have been converted into nominal variables. Nominal variables further converted into binomial variables because it is the preliminary requirement for rule engine. In the next stage of the framework, Rule engine generates the required association rules.
In the process of rule generation, frequent itemsets is being generated using FP Growth. The minimum support for FP Growth has been set to 0.95. The frequent itemsets generated has been used for creating the association rules. The minimum confidence for generating rules is 0.8. Table 3 lists the association rules generated by rule engine.
Now, the rule monitor module will monitor the financial ratios of each organisation and compare the values of the ratios with the values given in the association rules for indicating the anomaly. Anomalies detected by rule monitor are reflected as number of non fraud companies identified as fraud in Table 3. The results generated by rule monitor are able to raise an alarm regarding fraud.
In view of the whistle blown by rule monitor, organisations should consider the presence or absence of conditions which refers to certain financial pressures exhibited by the management. Such organisations should think in terms of providing employees the working environment that values honesty because irresponsible and ineffective corporate governance could increase the chances of financial statement fraud. The absence of effective corporate governance may provide enough opportunity to the managers / employees for selecting an option of fraudulent financial reporting. Hence, this unlawful practice of fraudulent financial reporting could be prevented by checking or taking away the opportunity to commit fraud and by avoiding the combination of opportunity, pressure and motive in an organisation.
TABLE 3:ASSOCIATION RULE
S.N Association Rule Support Confidence Lift Conviction Number of non-fraud companies identified as fraud
1. Inventory / total assets > 0.033 Fraud 43% 86% 1.153 1.812 30 2. Cash / Total Assets <0.198 Fraud 42.1% 84.2% 1.129 1.611 36 3. Inventory / Current Liabilities >0.190 Fraud 43.9% 87.7% 1.176 2.071 31 4. Deposits and cash / Current Assets <0.408
Fraud
43.9% 87.7% 1.176 2.071 33
5. Sales / Total Assets >.553 Fraud 44.7% 89.5% 1.200 2.417 23 6. Revenue / Total Assets >.553 Fraud 44.7% 89.5% 1.200 2.417 25 7. Inventory / current Liabilities >0.190 &&
Deposits and cash / Current Assets < 0.408 Fraud
Once the prevention mechanism has failed to prevent fraud then the framework suggest the usage of predictive data mining for detection and identification of financial statement fraud. In this study three data mining techniques namely CART, Naive Bayesian Classifier and Genetic Programming have been used for detection of fraudulent financial statements and differentiating between fraud and non fraud reporting.In order to have better reliability of the result, ten – fold cross validation has been implemented.
A decision tree (CART) has been constructed in this study by using SIPINA Research edition software version – 32 bit. The complete dataset has been used as training data for constructing the tree given as Figure 2. The confidence level was set to 0.05. CART manages to classify 95 % cases. This method well classifies 98 % non fraud cases and misclassifies only 4 fraud cases. The percentage of classification for fraud cases is 86 %.
The financial ratio namely Deposits and cash to current assets has been used as the first splitter by the decision tree constructed in this research. This ratio is an indicator for the measurement of capability of a company in converting its non – liquid assets into cash. At second level of the tree, retained earnings / total assets (t2) and net profit / total assets has been used as a splitter. The ratios used by tree are given in Table 4.
TABLE 4
S. No. Financial Ratios / Items
1 Net profit/Total assets 2
Size of the company on the basis of assets (Total Assets P)
3 Deposits and cash/Current assets 4 Capital & Reserves / Total Assets 5 Inventory / Current Liabilities
6. Cash return on Assets
7. Cash / Total Assets
8. Inventory / Total Assets 9. Retained earnings / Total Assets (t2)
We applied Naïve Bayesian Classifier, the second method of classification by using SIPINA Research edition software version – 32 bit. The method correctly classifies 88% cases.
Third method of classification, Genetic programming has been implemented using a data mining tool Discipulus version 5.1. The process begins with division of dataset in to two datasets namely training data and validation data. The training data set has been used to train the sample and validation dataset is used exclusively for the purpose of validation. In this study, 80% of the whole dataset is designated as training data for training the sample, whereas, rest 20% is assigned exclusively for the purpose of validation. Since our dependent variable (target output) is binary, we select “hits then fitness” as a fitness function. Every single run of Discipulus has been set to terminate after it has gone 50 generations with no improvement in fitness.
Performance evaluation, the final step of the framework is used for measuring the performance and judging the efficacy of data mining methods. Performance of association rules generated in this study has been measured with the help of support, confidence, lift and conviction (Table 3). The rules generated by rule engine have support of more than 40% and confidence more than 80%.
Sensitivity and specificity have been used as a metrics for performance evaluation of classification techniques used in this research. The confusion matrix for Decision trees, Naïve Bayesian classifier and Genetic programming is given below.
TABLE: 5 (CONFUSION MATRIX FOR DECISION TREE)
Label Non Fraud Fraud
NF (Non Fraud) 83 2
F (Fraud) 4 25
TABLE: 6 (CONFUSION MATRIX FOR NAIVE BAYSIAN CLASSIFIER)
Label Non Fraud Fraud
NF 79 6
F 8 21
TABLE: 7 (CONFUSION MATRIX FOR GENETIC PROGRAMMING)
Label Non Fraud Fraud
NF 84 1
F 13 16
Performance matrix indicating the sensitivity (type 1 error) and specificity (type II error) of the three methods used in this study is given in Table 8.
Table: 8 (Performance Matrix)
S.No. Predictor Sensitivity
(%) Specificity (%) 1 Decision Tree 86.2 97.7% 2 Naïve Bayesian Classifier 84 92.9 3 Genetic Programming 53 99.2
Decision tree (CART) classifies 25 fraud cases as fraud from a total of 29 such cases correctly therefore, produces best sensitivity. The following are the decision rules generated by using decision tree (Figure 2).
1. If ((Deposits and cash / Current assets >=0.16) && (Retained Earnings / Total Assets> = -0.46) && (Inventory / Total Assets > = 0.23)) then Fraud 2. If ((Deposits and cash / Current assets >=0.16) &&
(Retained Earnings / Total Assets> = -0.46) && (Inventory / Total Assets < 0.23) && (Size of the company on the basis of assets >=45.05) &&(Inventory / Current Liabilities >=1.22)) then Fraud
3. If ((Deposits and cash / Current assets >=0.16) && (Retained Earnings / Total Assets> = -0.46) &&
(Inventory / Total Assets < 0.23) && (Size of the company on the basis of assets >=45.05) && (Inventory / Current Liabilities >=1.22) && (Capital and Reserves / Total Assets > = 5855.00)) then Fraud 4. If ((Deposits and cash / Current assets < 0.16) && (Retained Earnings / Total Assets> = -1.88) && (Net profit / Total Assets < 0.09)) then Fraud
5. If ((Deposits and cash / Current assets >=0.16) && (Retained Earnings / Total Assets< -0.46) && (Cash return on Assets < 0.01)) then Fraud
Genetic programming outperforms the other two techniques by correctly classifying 84 cases out of 85 non fraud organisations, hence produces best specificity. Table 9 represents the input impact of various input parameters on the model generated by Genetic Programming.
TABLE: 9 IMPACT OF INPUT VARIBALES (GENETIC PROGRAMMING)
S.No. Variable Frequency Average Impact Maximum
Impact
1 Debt 0.06 00.00000 00.00000
2 Inventory/Primary business income 0.35 22.52747 53.84615
3 Inventory/Total assets 0.35 09.70696 20.87912
4 Net profit/Total assets 0.06 02.19780 02.19780
5 Cash/Total assets 0.29 03.84615 05.49451
6 Total debt/Total assets 0.12 00.00000 00.00000
7 Fixed assets/Total assets 0.00 00.00000 00.00000
8 Deposits and cash/Current assets 0.18 06.59341 06.59341
9 Working Capital / Total Assets 0.06 00.00000 00.00000
10 Sales / Total Assets 0.00 00.00000 00.00000
11 Net income / Fixed Assets 0.41 07.69231 09.89011
12 Revenue /Total Assets 0.29 09.01099 14.28571
13 EBIT 0.06 05.49451 05.49451
14 Z score 0.06 19.78022 19.78022
15 Accounts receivable/Primary business income 0.29 00.54945 01.09890
16 Primary business income/Total assets 0.18 02.74725 03.29670
17 Primary business income/Fixed assets 0.41 03.29670 08.79121
18 Capitals and reserves/Total debt 0.00 00.00000 00.00000
19 Gross profit/Primary business profit 0.53 05.65149 09.89011
20 Accounts Receivable / Sales 0.00 00.00000 00.00000
21 Retained earnings / Total Assets 0.18 02.93040 04.39560
22 EBIT / Total Assets 0.24 03.29670 05.49451
Since Decision trees are capable of identifying type 1 error in more than 86% and Genetic programming correctly detect type II error for almost all the cases present in the dataset, therefore, we arrive at a conclusion that data mining techniques used in this study are capable enough for identification and detection of financial statement fraud in case of failure of prevention mechanism.
IV. CONCLUSION
Prevention along with detection of financial statement fraud would be of great value to the organizations throughout the world. Considering the need of such a mechanism, we employ a data mining framework for prevention and detection of financial statement fraud in this study. The framework used in this research follow the conventional flow of data mining.
We identified and collected 62 features from financial statements of 114 organizations. Then we find 35 informative variables by using one way ANOVA.
These informative variables are being used for implementing association rule mining for prevention and three predictive mining techniques namely Decision Tree, Naïve Bayesian Classifier, Genetic programming for detection of financial statement fraud. Rule Engine module of the framework generated 7 association rules. These rules are used by rule monitor module for raising an alarm regarding fraud and hence preventing it at the first place.
The three data mining methods used for detection of financial statement fraud are compared on the basis of two important evaluation criteria namely sensitivity and specificity. Decision tree produces best sensitivity and Genetic programming best specificity as compared with other two methods. These techniques will detect the fraud in case of failure of prevention mechanism. Hence, the framework used in this research is able to prevent fraudulent financial reporting and detect it if management of the organization is capable of perpetrating financial statement fraud despite the presence of anti fraud environment.
REFERENCES
[1] Atkins Matt, Accounting Fraud in US listed Chinese companies (September 2011). Available at: http://www.financierworldwide.com [2] ACFE, 2012 ACFE Report to the nations on ocupational fraud and
abuse, Technical report- Global fraud survey 2012, 2012.
[3] C. Spathis, M. Doumpos, C. Zopounidis, Detecting falsified financial statements: a comparative study using multicriteria analysis and multivariate statistical techniques, European Accounting Review 11 (3) (2002) 509–535.
[4] E. Koskivaara, Artificial neural networks in auditing: state of the art, The ICFAI Journal of Audit Practice 1 (4) (2004) 12–33.
[5] H.C. Koh, C.K. Low, Going concern prediction using data mining techniques, Managerial Auditing Journal 19 (3) (2004) 462–476. [6] Efstathios Kirkos, Charalambos Spathis &Yannis Manolopoulos
(2007), Data mining techniques for the detection of fraudulent financial statements. Expert Systems with Applications 32 (23) (2007) 995–1003
[7] Hoogs Bethany, Thomas Kiehl, Christina Lacomb and DenizSenturk
(2007). A Genetic Algorithm Approach to Detecting Temporal
Patterns Indicative Of Financial Statement Fraud, Intelligent systems in
accounting finance and management 2007; 15: 41 – 56, John Wiley & Sons, USA, available at: www.interscience.wiley.com
[8] S.-M. Huang, D.C. Yen, L.-W.Yang, J.-S.Hua, An investigation of Zipf's Law for fraud detection.Decision Support Systems 46 (1) (2008) 70–83.
[9] M. Cecchini, H. Aytug, G.J. Koehler, and P. Pathak. Detecting
Management Fraud in Public
Companies.http://warrington.ufl.edu/isom/docs/papers/DetectingMana gementFraudInPublicCompanies.pdf
[10] BelinnaBai, Jerome yen, Xiaoguang Yang, False Financial Statements: Characteristics of china listed companies and CART Detection Approach, International Journal of Information Technology and Decision Making , Vol. 7, No. 2(2008), 339 – 359
[11] Juszczak, P., Adams, N.M., Hand, D.J., Whitrow, C., & Weston, D.J. (2008). Off-the-peg and bespoke classifiers for fraud detection‖, Computational Statistics and Data Analysis, vol. 52 (9): 4521-4532
[12] Wei Zhou, G. Kappor, Detecting evolutionary financial statement fraud. Decision Support Systems 50 (2011) 570 – 575.
[13] P.Ravisankar, V. Ravi, G.RaghavaRao, I., Bose, Detection of financial statement fraud and feature selection using data mining techniques, Decision Support Systems, 50(2011) 491 – 500
[14] Johan Perols, Financial Statement Fraud Detection: An Analysis of Statistical and Machine Learning Algorithms, A Journal of Practice & Theory 30 (2), 19 (2011), pp. 19-50
[15] Gupta Rajan& Gill Nasib S. “ A data mining framework for prevention and detection of financial statement fraud”, International Journal of Computer Application, 50(8): 7 - 14, July 2012. Published by Foundation of computer science, New York, U.S.A.
AUTHORS PROFILE
Rajan Gupta obtained master’s degree in computer application from Department of Computer Science & Application, Guru Jambheshwar University, Hisar, Haryana, India and Master Degree of Philosophy in Computer Science from Madurai Kamraj University, Madurai, India. He is currently pursuing Doctorate degree in Computer Science from Department of Computer Science & Application, Mahrshi Dayanand University, Rohtak, Haryana, India.
Dr Nasib S. Gill obtained Doctorate degree in computer science and Post-doctoral research in Computer Science from Brunel Univerrsity, U.K. He is currently working as Professor and Head in the Department of Computer Science and Application, Mahrshi Dayanand University, Rohtak, Haryana, India. He is having more than 22 years of teaching and 20 years of research experience. His interest areas include software metrics, component based metrics, testing, reusability, Data Mining and Data warehousing, NLP, AOSD, Information and Network Security.