Review
PEM fuel cell electrodes
S. Litster
1, G. McLean
∗Angstrom Power Inc., 106 980 W. 1st-St, North Vancouver, BC, Canada V7P 3N4 Received 13 November 2003; accepted 14 December 2003
Abstract
The design of electrodes for polymer electrolyte membrane fuel cells (PEMFC) is a delicate balancing of transport media. Conductance of gas, electrons, and protons must be optimized to provide efficient transport to and from the electrochemical reactions. This is accomplished through careful consideration of the volume of conducting media required by each phase and the distribution of the respective conducting network. In addition, the issue of electrode flooding cannot be neglected in the electrode design process. This review is a survey of recent literature with the objective to identify common components, designs and assembly methods for PEMFC electrodes. We provide an overview of fabrication methods that have been shown to produce effective electrodes and those that we have deemed to have high future potential. The relative performances of the electrodes are characterized to facilitate comparison between design methodologies.
© 2004 Elsevier B.V. All rights reserved.
Keywords: Polymer electrolyte membrane fuel cell (PEMFC); Catalyst layer; Gas diffusion layer; Thin-film electrodes; PTFE-bound electrodes; Sputtered electrodes
1. Introduction
The first application of a proton exchange membrane (PEM), also referred to as a polymer electrolyte membrane, in a fuel cell was in the 1960s as an auxiliary power source in the Gemini space flights. Subsequently, advances in this technology were stagnant until the late 1980s when the fun-damental design underwent significant reconfiguration. New fabrication methods, which have now become conventional, were adopted and optimized to a high degree. Possibly, the most significant barrier that PEM fuel cells had to overcome was the costly amount of platinum required as a catalyst. The large amount of platinum in original PEM fuel cells is one of the reasons why fuel cells were excluded from com-mercialization. Thus, the reconfiguration of the PEM fuel cell was targeted rather directly on the electrodes employed and, more specifically, on reducing the amount of platinum in the electrodes. This continues to be a driving force for further research on PEM fuel cell electrodes.
A PEM fuel cell is an electrochemical cell that is fed hy-drogen, which is oxidized at the anode, and oxygen that is reduced at the cathode. The protons released during the ox-idation of hydrogen are conducted through the proton
ex-∗Corresponding author. Tel.:+1-604-980-9936; fax:+1-604-980-9937.
E-mail address: [email protected] (G. McLean).
1Present address: Institute for Integrated Energy Systems, University of Victoria, Vic., Canada V8W 3P6.
change membrane to the cathode. Since the membrane is not electrically conductive, the electrons released from the hydrogen travel along the electrical detour provided and an electrical current is generated. These reactions and pathways are shown schematically inFig. 1.
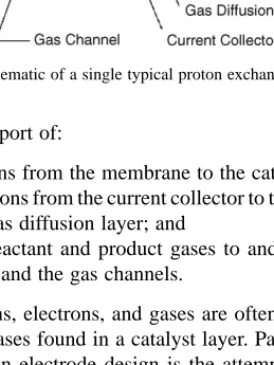
At the heart of the PEM fuel cell is the membrane electrode assembly (MEA). The MEA is pictured in the schematic of a single PEM fuel cell shown in Fig. 1. The MEA is typically sandwiched by two flow field plates that are often mirrored to make a bipolar plate when cells are stacked in series for greater voltages. The MEA consists of a proton exchange membrane, catalyst layers, and gas diffusion layers (GDL). Typically, these components are fabricated individually and then pressed to together at high temperatures and pressures.
As shown inFig. 1, the electrode is considered herein as the components that span from the surface of the membrane to gas channel and current collector. A schematic of an elec-trode is illustrated in Fig. 2. Though the membrane is an integral part of the MEA, a review of the design and fabrica-tion of polymer electrolyte membranes is beyond the scope of this paper. However, the interface between the membrane and the electrode is critical and will be given its due atten-tion. Current collectors and gas channels, typically in the form of bipolar plates, will not be reviewed herein.
An effective electrode is one that correctly balances the transport processes required for an operational fuel cell, as shown inFig. 2. The three transport processes required are
0378-7753/$ – see front matter © 2004 Elsevier B.V. All rights reserved. doi:10.1016/j.jpowsour.2003.12.055
Fig. 1. Schematic of a single typical proton exchange membrane fuel cell.
the transport of:
1. protons from the membrane to the catalyst;
2. electrons from the current collector to the catalyst through the gas diffusion layer; and
3. the reactant and product gases to and from the catalyst layer and the gas channels.
Protons, electrons, and gases are often referred to as the three phases found in a catalyst layer. Part of the optimiza-tion of an electrode design is the attempt to correctly dis-tribute the amount of volume in the catalyst layer between the transport media for each of the three phases to reduce transport losses. In addition, an intimate intersection of these
Fig. 2. Transport of gases, protons, and electrons in a PEM fuel cell electrode.
transport processes at the catalyst particles is vital for ef-fective operation of a PEM fuel cell. Each portion of the electrode will now be introduced.
1.1. Catalyst layer
The catalyst layer is in direct contact with the membrane and the gas diffusion layer. It is also referred to as the active layer. In both the anode and cathode, the catalyst layer is the location of the half-cell reaction in a PEM fuel cell. The catalyst layer is either applied to the membrane or to the gas diffusion layer. In either case, the objective is to place the cat-alyst particles, platinum or platinum alloys (shown as black ellipses inFig. 2), within close proximity of the membrane. The first generation of polymer electrolyte membrane fuel cells (PEMFC) used PTFE-bound Pt black electrocatalysts that exhibited excellent long-term performance at a pro-hibitively high cost.[1]. These conventional catalyst layers generally featured expensive platinum loadings of 4 mg/cm2. A generous amount of research has been directed at reduc-ing Pt loadreduc-ing below 0.4 mg/cm2 [2,3]. This is commonly achieved by developing methods to increase the utilization of the platinum that is deposited. Recently, platinum load-ings as low as 0.014 mg/cm2have been reported using novel sputtering methods[4,5]. As a consequence of this focused effort, the cost of the catalyst is no longer the major barrier to the commercialization of PEM fuel cells.
In addition to catalyst loading, there are a number of cat-alyst layer properties that have to be carefully optimized to achieve high utilization of the catalyst material: reactant diffusivity, ionic and electrical conductivity, and the level of hydrophobicity all have to be carefully balanced. In ad-dition, the resiliency of the catalyst is an important design constraint[1].
1.2. Gas diffusion layer
The porous gas diffusion layer in PEM fuel cells ensures that reactants effectively diffuse to the catalyst layer. In ad-dition, the gas diffusion layer is the electrical conductor that transports electrons to and from the catalyst layer. Typi-cally, gas diffusion layers are constructed from porous car-bon paper, or carcar-bon cloth, with a thickness in the range of 100–300m. The gas diffusion layer also assists in water management by allowing an appropriate amount of water to reach, and be held at, the membrane for hydration. In ad-dition, gas diffusion layers are typically wet-proofed with a PTFE (Teflon) coating to ensure that the pores of the gas diffusion layer do not become congested with liquid water.
1.3. Electrode designs
Proven and emerging methods that are used to con-struct integrated membrane–electrodes are illuminated in this review. Two widely employed electrode designs are the PTFE-bound and thin-film electrodes. Emerging
meth-ods include those featuring catalyst layers formed with electrodeposition and vacuum deposition (sputtering). In general, electrode designs are differentiated by the structure and fabrication of the catalyst layer. As well, we highlight recent accomplishments in the development of gas diffusion layers. However, most commercial PEM fuel cells and the majority of those reported herein still employ conventional carbon cloth or paper. There has been a significant amount of research conducted on producing composite gas diffu-sion layers with graded porosity and wet-proofing, as well as the optimization of carbon and PTFE loading in the gas diffusion layer. This report also includes a section describ-ing some recent advances in increasdescrib-ing the surface area of the catalyst by optimization of catalyst supports.
It is evident throughout the report that the most com-mon electrode design currently employed is the thin-film design. The thin-film design is characterized by the thin Nafion film that binds carbon supported catalyst particles. The thin Nafion layer provides the necessary proton trans-port in the catalyst layer. This is a significant improvement over its predecessor, the PTFE-bound catalyst layer, which requires the less effective impregnation of Nafion. However, one fault of the Nafion thin-film method is its reduced re-siliency. Methods of increasing this resiliency, such as using a thermoplastic form of the ionomer, have been found and are reported herein. Sputter deposited catalyst layers have been shown to provide some of the lowest catalyst loadings, as well as the thinnest layers. The short conduction distance of the thin sputtered layer dissipates the requirement of a proton-conducting medium, which can simplify production. The performance of the state of the art sputtered layer is only slightly lower than that of the present thin-film convention. The performances of many of the electrodes reviewed are reported to accommodate comparison between designs. The performances are provided in the form of power den-sities at 200 mA/cm2 and 0.6 V. These power densities are benchmarked because they typically represent two charac-teristics of the electrode. At 200 mA/cm2, the losses can be associated to activation overpotential (the losses associated with the irreversibilities of the chemical reaction). The 0.6 V benchmark depicts the resistive components of the cell and its ability to provide adequate transport of gases, electrons, and protons to the catalyst sites. Together, these two bench-marks provide an overall picture of a PEM fuel cell’s elec-trode performance. However, when comparing elecelec-trode de-signs it is important to weigh the operating characteristics such temperatures, pressures, and the purity of the gases as they can have an overriding effect on the fuel cell perfor-mance.
2. PTFE-bound methods
Before the development of the thin-film catalyst layer[3], PTFE-bound catalyst layers were the convention [6–9]. In these catalyst layers, the catalyst particles were bound by
a hydrophobic PTFE structure commonly cast to the dif-fusion layer. This method was able to reduce the platinum loading of prior PEM fuel cells by a factor of 10; from 4 to 0.4 mg/cm2[9]. In order to provide ionic transport to the catalyst site, the PTFE-bound catalyst layers are typically impregnated with Nafion by brushing or spraying. However, platinum utilization in PTFE-bound catalyst layers remains approximately 20% [8,10]. Nevertheless, researchers have continued to work on developing new strategies for Nafion impregnation[7].
Some of the original low-platinum loading PEM fuel cells featuring PTFE-bound catalyst layers were fabricated by Ti-cianelli et al. [9] at the Los Alamos National Laboratory. Chun et al.[10]fabricated conventional PTFE-bound cata-lyst layer electrodes for direct comparison with the current thin-film method. The process employed for forming the PTFE-bound catalyst layer MEA in their study is detailed below.
1. 20 wt.% percent of Pt/C catalyst particles were mechan-ically mixed for 30 min in a solvent.
2. PTFE emulsion was added until it occupied 30% of the mixture.
3. A bridge-builder and a peptization agent were added, followed by 30 min of stirring.
4. The slurry was coated onto the wet-proofed carbon paper using a coating apparatus.
5. The electrodes were subsequently dried for 24 h in am-bient air, and then baked at 225◦C for 30 min.
6. The electrodes were rolled and then sintered at 350◦C for 30 min.
7. A 5 wt.% Nafion solution was brushed onto the electro-catalyst layer (2 mg/cm2).
8. The Nafion-impregnated electrodes were placed in an oven at 80◦C and allowed to dry for an hour in ambient air.
9. Once dry, the electrodes were bonded to the H+form of the polymer electrolyte membrane through hot pressing at 145◦C for 3 min at a pressure of 193 atm to complete the membrane electrode assembly.
2.1. Nafion impregnation
Lee et al. [7] investigated the effect of Nafion impreg-nation on commercial low-platinum loading PEMFC elec-trodes. The researchers employed a conventional MEA with PTFE-bound catalyst layers featuring platinum loadings of 0.4 mg/cm2. Nafion was impregnated in electrode structures, with the Nafion loadings varying from 0 to 2.7 mg/cm2, by a brushing method. The results presented by Lee et al. depict a non-linear relationship between performance and Nafion loading. In addition, the polarization curves showed the ef-fect that the oxidant composition has on the optimum amount of Nafion loading. When the oxidant was air, there was a sharp increase in performance as the Nafion loading was in-creased to 0.6 mg/cm2. However, performance dropped as
additional Nafion was added. The researchers found that 0.6 mg/cm2was the ideal Nafion loading when operating on air. When pure oxygen was employed as the oxidant, the per-formance increased with Nafion loading up to 1.9 mg/cm2. This difference is due to mass transport being the limiting rate when air is the oxidant, as the partial pressure of oxygen is much lower. Without the addition of some Nafion, the ma-jority of the catalyst sites were inactive. However, as more Nafion is added the porosity of the composite decreases and limits mass transfer. The same phenomenon was originally presented by Ticianelli et al.[9].
3. Thin-film methods
The present convention in fabricating catalyst layers for PEM fuel cells is to employ thin-film methods. In his 1993 patent, Wilson[3]described the thin-film technique for fab-ricating catalyst layers for PEM fuel cells with catalyst load-ings less than 0.35 mg/cm2. In this method the hydrophobic PTFE traditionally employed to bind the catalyst layer is replaced with hydrophilic perfluorosulfonate ionomer (Nafion). Thus, the binding material in the catalyst layer is composed of the same material as the membrane. Even though PTFE features effective binding qualities and imparts beneficial hydrophobicity in the gas diffusion layers, there is no particular benefit to its presence in the catalyst layer
[11]. The resilient binding of PTFE catalyst layer is traded for the enhanced protonic conductivity of a Nafion-bound thin-film catalyst layer. Thin-film catalyst layers have been found to operate at almost twice the power density of PTFE-bound catalyst layers. This correlates with an active area increase from 22 to 45.4% when a Nafion-impregnated and PTFE-bound catalyst layer is replaced with a thin-film catalyst layer [10]. Moreover, thin-film MEA manu-facturing techniques are more established and applica-ble to stack fabrication [6]. However, an active area of 45% suggests there is still significant potential for improvement.
The procedure for forming a thin-film catalyst layer on the membrane, according to Wilson’s 1993 patent[3], is as follows:
1. Combine a 5% solution of solubilized perfluorosulfonate ionomer (such as Nafion) and 20% wt Pt/C support cat-alyst in a ratio of 1:3 Nafion/catcat-alyst.
2. Add water and glycerol to weight ratios of 1:5:20 carbon–water–glycerol.
3. Mix the solution with ultrasound until the catalyst is uni-formly distributed and the mixture is adequately viscous for coating.
4. Ion-exchange the Nafion membrane to the Na+form by soaking it in NaOH, then rinse and let dry.
5. Apply the carbon–water–glycerol ink to one side of the membrane. Two coats are typically required for adequate catalyst loading.
6. Dry the membrane in a vacuum with the temperature of approximately 160◦C.
7. Repeat Steps 5 and 6 for the other side of the membrane. 8. Ion-exchange the assembly to the protonated form by lightly boiling the MEA in 0.1 M H2SO4 and rinsing in
de-ionized water.
9. Place carbon paper/cloth against the film to produce a gas diffusion layer.
Alternatively, the catalyst layer can be applied using a transfer printing method in which the catalyst layer is cast to a PTFE blank. The catalyst layer is then decaled on to the membrane. This process is mainly used to ease fabri-cation in a research laboratory [1]. Moreover, direct coat-ing methods (catalyst layer is cast directly onto the mem-brane) have been shown to provide higher performance be-cause they offer better ionic connection between the mem-brane and the ionomer in the catalyst layer[6]. To improve platinum utilization, Qi and Kaufman (QK)[12] boiled or steamed the electrodes as the last step in the fabrication of their thin-film electrodes. Their paper presented a significant increase in the performance over the entire spectrum of cur-rent densities when the electrodes were steamed or boiled for 10 min. Gamburzev and Appleby (GA) [13] also ap-plied a thin-film catalyst layer to the carbon cloth gas diffu-sion layer. Their methodology is schematically described in
Fig. 3.
Paganin et al. [14]documented the results of a fuel cell with a thin-film catalyst layer. Alternatively to Wilson’s 1993 patent [3], the research group brushed the catalyst slurry (containing isopropanol instead of glycerol to achieve the desired viscosity) onto the gas diffusion layer rather than the membrane. The group was able to achieve good performance with platinum and Nafion loadings of 0.4 and 1.1 mg/cm2, respectively, using 20 wt.% Pt/C catalyst particles.
Fig. 3. Preparation of a gas diffusion electrode employing the thin-film methodology. Reproduced from[13].
The DLR research group in Germany[15,16]has devel-oped a dry layer preparation method for fabricating catalyst layers bound by either PTFE or Nafion. Their method con-sists of dry mixing either supported or unsupported catalyst with PTFE or Nafion powder and spraying the atomized dry mixture in a nitrogen stream onto either the porous carbon diffusion layer or the membrane. Subsequently, the assem-bly would be hot-pressed or rolled. Some of the benefits of the dry layer technique are its simplicity because of the lack of evaporation steps, and its ability to create graded layers with multiple mixture streams. In addition, the plat-inum loading in the electrode fabricated is reported to be as low as 0.08 mg/cm2. The cell performance results presented by the DLR group depict a preparation method with good future potential for use in MEA mass production.
Qi and Kaufman (QK) [17] of the H Power Corpora-tion reported in 2003 on low Pt loading high performance cathodes for PEM fuel cells. The method used was of the thin-film variety, in which supported catalyst was mixed into a Nafion and water solution without the addition of or-ganic solvents. The viscous solution was then applied to an ELAT gas diffusion layer and dried at moderate tempera-tures. The carbon-supported catalysts were purchased from E-TEK. QK achieved some of the highest power densities reported in this review (0.72 W/cm2 at 75◦C)[17]. All of QK’s test cells featured Nafion 112 membranes.
The power densities listed inTable 1demonstrate the con-trast between the performance of thin-film catalyst layers and PTFE-bound catalyst layers in the study performed by Chun et al.[6]. There is a dramatic increase in the perfor-mance when the catalyst layer is formed via the thin-film method. In addition, the polarization curves show the in-crease in performance obtained when the catalyst layer is directly coated onto the membrane instead of transfer print-ing with a PTFE blank. This enhancement is a result of the intimate interface formed between the Nafion in the cata-lyst ink and the membrane when the direct coating of the membrane is employed.
Paganin et al.[14]investigated the effect of platinum load-ing on their thin-film cell with a Pt/C weight ratio 20 wt.%. They found that the performance in the cathode improved significantly when the loading was increased from 0.1 to
Table 1
Comparison of the performance of various MEAs (Nafion 115 membrane, H2/O2 pressure=1/1 atm, H2/O2 feed rate=8.5/3.8 l/min)[6] Type of electrode Power density at
200 mA/cm2 (mW/cm2) Power density at 0.6 V (mW/cm2) Commercial 140 233 PTFE-bound 114 93
Thin-film, direct membrane coating
145 200
Thin-film, transfer printing (20% Pt/C)
129 147
Thin-film, transfer printing (40% Pt/C)
123 132
Fig. 4. Effect of Pt loading on performance for electrodes made using E-TEK 20% Pt/C, 35/45/45◦C[17].
0.3 mg/cm2. This is an effect of the increased active area. Conversely, there was a slight reduction in performance when the loading was increased to 0.4 mg/cm2. No explana-tion was given for this response, but it could be caused by re-duced reactant transport to the areas closest to the membrane. They compared loadings of 0.1 and 0.4 mg/cm2in the anode and found the lower loading to provide better performance. QK[17]found the highest performance with a Pt/C weight ratio 20 wt.% and a platinum loading of 0.20±0.05 mg/cm2. The influence of platinum loading on QK’s cell is presented inFig. 4.
3.1. Nafion loading
Paganin et al.[14]ascertained that, in their thin-film cat-alyst layer, when the Nafion loading was increased from 0.87 to 1.75 mg/cm2the performance improved significantly. Moreover, the performance deteriorated at higher current densities when the Nafion loading was increased beyond 2.2 mg/cm2, which is equivalent to an optimum Nafion per-centage of 33% of the catalyst layer weight. These val-ues have been supported by several other recent studies
[13,17,18]. Fig. 5is a schematic of the catalyst layer that depicts the effect of Nafion loading. The effect of Nafion loading, as found by QK[17], is presented inFig. 6.
The effect of Nafion loading on performance is aptly depicted by the results of Song et al. [19], who varied the Nafion content from 0.2 to 2.0 mg/cm2 in a thin-film catalyst layer featuring a platinum loading 0.4 mg/cm2.
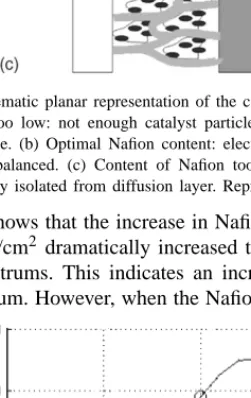
Fig. 5. Schematic planar representation of the catalyst layer. (a) Content of Nafion too low: not enough catalyst particles with ionic connection to membrane. (b) Optimal Nafion content: electronic and ionic connec-tions well balanced. (c) Content of Nafion too high: catalyst particles electronically isolated from diffusion layer. Reproduced from[18]. Table 2shows that the increase in Nafion loading from 0.2 to 0.8 mg/cm2 dramatically increased the power density in both spectrums. This indicates an increased utilization of the platinum. However, when the Nafion concentration was
Fig. 6. Effect of Nafion content in the catalyst layer on performance. E-TEK 20% Pt/C, 35/45/45◦C[17].
Table 2
Power densities of thin-film electrodes, with a Pt loading of 0.4 mg/cm2, containing various Nafion ionomer concentrations in the catalyst layer [19] Nafion ionomer concentration (mg/cm2) Power density at 200 mA/cm2 (mW/cm2) Power density at 0.6 V (mW/cm2) 0.2 110 72 0.8 144 240 2.0 140 204
further increased to 2.0 mg/cm2, the only change was a sharp drop in the power density at higher current densities. This is because additional Nafion is blocking reactant gases and the hydrophilic Nafion is likely trapping water in the catalyst layer.
3.2. Organic solvents
Organic solvents such as Glycerol are typically added to the ink mixture to improve paintability. Chun et al.[6]
investigated the effect of glycerol in the catalyst ink on the performance of their thin-film electrodes. They found that high glycerol content (3:1 glycerol–5% Nafion solution) in the catalyst ink causes a significant drop in performance at current densities above 350 mA/cm2. Chun et al. suggest that high glycerol loading reduces the contact area between the catalyst and the Nafion, and limits the charge transfer.
3.3. Pore formers in the catalyst layer
Fischer et al. [20] investigated the effect of additional porosity in the catalyst layers of thin-film catalyst layer fuel cells. They constructed their electrodes using a hot spray method, in which catalyst slurry containing catalyst and Nafion was sprayed on to the gas diffusion layer. To cre-ate additional porosity, several types of pore formers were added to the slurry, including:
• low temperature decomposable (ammonium carbonate);
• high temperature decomposable (ammonium oxalate); and
• soluble additives (lithium carbonate).
Without pore formers, the porosity of the catalyst layer was 35%. Ammonium carbonate and ammonium oxalate in-creased the porosity to 42 and 48%, respectively. With the addition of lithium carbonate, the porosity increased to 65%. However, it was shown that the electrical conductivity de-creased (from 1.64 to 0.44 S/cm2) with these increases in porosity. This change in the conductivity was shown to have little influence. It was found that the addition of pore form-ers made a negligible difference on performance when the cell is supplied with oxygen. However, there was a signif-icant performance improvement when the oxidant was air (reactant transport became the limiting factor).
GA[13]documented an enhanced gas transport and fuel cell efficiency by the addition of proprietary pore formers
in the catalyst layer. The pore former is mixed with the ink that forms the catalyst layer. Following the painting of the catalyst layer, the pore former material is dissolved and pores are formed. Calcium carbonate is a typical pore former[21]. Increased efficiency was found with the addition of pore former until the ink held 44 wt.% pore former. At this point, the efficiency was lower than that of the no pore former case. With more pore former present, the mass transfer rate increases. However, the electron and proton transport rates readily decrease when pore former is the added. GA found the optimum pore former content to be 33 wt.%.
Contrary to the previously discussed increase in perfor-mance with the addition of pore former in the catalyst layer, Yoon et al. [22]found a decrease in performance with the addition of either 27 or 60 wt.% ethylene glycol as a pore forming agent. However, no explanation was given for this and it can only be assumed that ethylene glycol is a poor choice for a pore forming agent.
3.4. Thermoplastic ionomers
Wilson et al.[1]introduced a method of using thermoplas-tic ionomers into the catalyst layer to counter the steadily de-caying performance of fuel cells with poorly bound catalyst layers. This work was prompted by the discovery that Nafion can be converted to a thermoplastic form by ion-exchanging the Nafion with large hydrophobic counter ions such as tetrabutylammonium (TBA+). In the thermoplastic form, the ionomer can be processed in a melted phase, which leads to the possibility of fabricating ionomer structures by mold-ing and extrudmold-ing. The fabrication of the thermoplastic cat-alyst layer is similar to the thin-film method described by Wilson [3] (with the inclusion of TBA+ in the mixing of the ink). However, ion-exchanging the MEA to the proto-nated (H+) was hindered by the hydrophobic TBA+. Conse-quently, the thermoplastic ionomer requires a more rigorous ion-exchanging process than conventional thin-film catalyst layers. The results presented depict a fuel cell with an ad-equate power density and low Pt loadings (0.12 mg/cm2). In addition, the power density decreases by only 10% after 4000 h of operation. Chun et al.[6]also ion-exchanged the catalyst layer ionomer to the TBA+ form during the cata-lyst layer preparation. However, no conclusions on mold-ing or extrudmold-ing techniques were made. The effect of the ion-exchange on the resiliency of the catalyst layer was not explored in this paper.
Yoon et al. [22] recently experimented with the effect of ion-exchanging the catalyst layer Nafion ionomer to the TBA+form. This was achieved through the addition of tetra-butylammonium hydroxide (TBAOH) to the original catalyst slurry containing electrocatalyst, Nafion ionomer, and water. Both the conventional and TBA+versions of thin-film cata-lyst layers were sprayed on the gas diffusion layers at vari-ous droplet sizes. It was visible in scanning electron micro-graphs that the grain size in the catalyst increases two-fold with the addition of TBAOH. The change in performance
Table 3
Power densities of thin-film electrodes prepared with conventional catalyst ink and with the addition of TBAOH to produce the thermoplastic form of the Nafion ionomer[22]
Ink preparation Power density at 200 mA/cm2 (mW/cm2) Power density at 0.6 V (mW/cm2) Conventional ink 142 252 Addition of TBAOH 146 288
due to the addition of TBAOH is depicted in Table 3. In addition, it can be seen that the optimal case of the ther-moplastic form of the ionomer performs moderately better than the non-thermoplastic case between current densities of 200–500 mA/cm2. At high current densities the thermoplas-tic form of ionomer performs markedly better. Yoon et al.’s results also show that too fine or too coarse of droplet size can have a significant effect on the performance.
3.5. Colloidal method
An alternative method to conventional thin-film tech-niques is the colloidal method. Typically, the catalyst layers are applied as a solution. It is well understood that Nafion forms a solution in solvents with dielectric constants greater than 10. A typical solvent is isopropyl alcohol, which has a dielectric constant of 18.3. When normal-butyl acetate, which has a dielectric constant of 5.01, is employed as the solvent, a colloid forms in lieu of a solution. Shin et al.[23]
suggested that in the conventional solution method the cat-alyst particles could be excessively covered with ionomer, which leads to under-utilization of platinum. In addition, it was proposed that in the colloidal method the ionomer colloid absorbs the catalyst particles and larger Pt/C ag-glomerates are formed. The colloidal method is known to cast a continuous network of ionomer that enhances proton transport.
Shin et al. [23] prepared colloidal catalyst ink with a method similar to the conventional thin-film approach. A mixture of Pt/C powder and Nafion ionomer was dripped drop by drop into the normal-butyl acetate solvent to form the ionomer colloids. The ink was then treated ultrasonically to allow the colloids to absorb the Pt/C powder. The ink was then sprayed via air brushing onto the carbon paper, which was to be used as the gas diffusion layer. It was stated that the colloidal method is the preferred ink for spraying meth-ods, as it forms larger agglomerates. Small agglomerates formed by the solution method have a tendency to penetrate too far into the gas diffusion layer, blocking pores needed for gas transport.
The thickness of a catalyst layer that Shin et al. [23]
formed by the colloidal ink was twice that of the 0.020 mm thick layer formed with solution ink. In addition, the size of Pt/C agglomerates increased from 550 to 736 nm with the introduction of the colloidal method. The catalyst layers formed with colloidal ink were hot-pressed to a Nafion 115
Table 4
Effect of the catalyst ink preparation method on the cell performance (Pt loading=0.4 mg/cm2, H
2/O2=1/1 atm, andT=80◦C)[23] Ink preparation Power density at
200 mA/cm2 (mW/cm2)
Power density at 0.6 V (mW/cm2)
Ionomer solution method 153 417
Ionomer colloidal method 157 516
membrane and tested in a single cell test apparatus, along with a similar cell featuring catalyst layers formed by the solution method. The colloidal method dramatically outper-formed the solution method at high current densities (see
Table 4for power densities). This is attributed to a signifi-cant increase in the proton conductivity, as well as a moder-ate enhancement of the mass transport in the catalyst layer formed with the colloidal ink. Shin et al. quantified these improvements by inserting resistance layers, formed from inactive catalyst layers, between either the membrane and active catalyst layer or the active catalyst layer and the gas diffusion layer. The increase in proton conductivity is due to the continuous network of ionomer in the colloidal catalyst layer. The increased mass transport is a product the larger agglomerates of Pt/C in the colloidal catalyst layer, which translates to a higher porosity, allowing a greater flux of the reactant and product gases.
3.6. Controlled self assembly
Middelman[24]of Nedstack fuel cell technology reported on the development of a catalyst layer that features a con-trolled morphology to enhance performance. A fabrication method to create a highly oriented catalyst morphology was revealed as an alternative to conventional methods that typi-cally create a random morphology. To create highly oriented structures, Middelman increased the mobility of the catalyst layer with high temperatures and chemical additives. Then an electric field was employed as the driving force to ori-ent the strands. Middelman suggests that this method could increase Pt utilization to almost 100%, and states that in-creases in voltages of 20% are obtained with this process.
4. Vacuum deposition methods
Common vacuum deposition methods include chemical vapor deposition, physical or thermal vapor deposition, and sputtering. Sputtering is commonly employed to form cat-alyst layers and is known for providing denser layers than the alternative evaporation methods[25]. The sputtering of catalyst layers consists of a vacuum evaporation process that removes portions of a coating material (the target) and de-posits a thin and resilient film of the target material onto an adjacent substrate. A schematic of the sputtering apparatus is shown inFig. 7. In the case of sputtered catalyst layers, the target material is the catalyst material and the substrate
Fig. 7. Schematic of sputtering in argon plasma for fabricating PEM fuel cell electrodes.
can be either the gas diffusion layer or the membrane. Sput-tering provides a method of depositing a thin catalyst layer (onto either the membrane or the gas diffusion layer) that delivers high performance combined with a low Pt loading. The entire catalyst layer is in such intimate contact with the membrane that the need for ionic conductors in the catalyst layer is resolved[4]. Moreover, platinum and its alloys are easily deposited by sputtering[26]. The success of the sput-tering method on reducing platinum loading depends heav-ily on the reduction in the size of catalyst particles below 10 nm. State of the art thin-film electrodes feature Pt loading of 0.1 mg/cm2[4]. A 5 nm sputtered platinum film amounts to a platinum loading of 0.014 mg/cm2. However, the perfor-mance of a fuel cell with a sputtered catalyst layer can vary by several orders of magnitude depending on the thickness of the sputtered catalyst layer[5].
According to Weber et al.[26], fuel cells with sputter de-posited catalyst layers were first investigated by Cahan and Bockris in the late 1960s. Half a decade later, the method was further refined by Asher and Batzold, but without adequate power density. In 1987, Weber et al. continued to explore the belief that electrode fabrication could be significantly streamlined if platinum was applied directly to a wet-proofed substrate by vacuum deposition (i.e. sputtering). In their study, they sputtered platinum onto wet-proofed, porous sub-strates that were then used as hydrogen and oxygen trodes. Their early results showed that the hydrogen elec-trodes were limited by the rate of mass transfer at low current densities (5–20 mA/cm2). However, their oxygen electrodes performed considerably better; to current densities as high as 500 mA/cm2. They found that the performance of their sputtered electrodes depended more on the substrate prepa-ration than on the sputtering process. Substrate prepaprepa-ration includes the impregnation of PTFE and carbon powder into
the porous substrate. Typical Pt loadings in this study were 0.15 mg/cm2and reached as high as 0.6 mg/cm2.
In 1997, Hirano et al. [27] documented their study of sputter-deposited catalyst layers in high performance PEM fuel cells. The cathode featured an uncatalyzed E-TEK elec-trode with a sputtered catalyst layer featuring loadings be-tween 0.04 and 0.1 mg Pt/cm2. The anode they employed was always a commercial E-TEK electrode. The anode and cathode catalyst layers both featured a Nafion loading of 0.6 mg/cm2 to improve protonic conductivity. The perfor-mance of the cells with a sputtered platinum loading of 0.1 mg/cm2was nearly equivalent to that of the commercial variant. However, there was a visible drop in performance at very high current densities. One case, which featured a plat-inum loading of 0.04 mg/cm2, suffered a dramatic increase in resistances because of the low active area. However, this low loading could be effective in low-power portable applica-tions because at 200 mA/cm2the cell featured a respectable power density of 160 mW/cm2.
O’Hayre et al.[5]of the Rapid Prototyping Lab at Stan-ford University reported in 2002 on their development of a catalyst layer with ultra-low platinum loading. Their paper suggests that they are developing these electrodes for use in micro-fuel cells since it was stated that the sputtering pro-cess is compatible with many other integrated circuit fab-rication techniques. O’Hayre et al. also suggest the future ability to apply the gas diffusion layer with a sputtering pro-cess. In their study, they deposited a single sputtered plat-inum layer with a nominal thickness of 2–1000 nm to Nafion 117. After the catalyst layer was applied to both sides of the membrane, the catalyst layers were covered by carbon cloth. They were not hot-pressed or fixed by any other method. The operating conditions used in their performance tests were dry oxygen and dry hydrogen at the ambient temperature and pressure. They found that films only 5–10 nm thick pro-duced the best performance when the catalyst was applied to smooth Nafion. This corresponds to platinum loadings of 0.01–0.02 mg/cm2.
The performance of the O’Hayre et al. [5] fuel cell dropped dramatically when the thickness of the catalyst layer was less than 5 nm or greater than 10nm. Using scanning electron microscopy (SEM), they depicted the reasoning for this balance. When the layer is very thin, there are only islands of the catalyst material. Once a nominal thickness of 4 nm is reached, the islands coalesce into a single film. At this thickness, a fine crack structure can be found in the film, which provides gas access to the reaction sites closest to the membrane and increases catalyst utilization. When the thickness is increased further, the crack structure be-comes coarser as the film increases in mechanical strength. Thus, gas transport to the reaction sites most intimate with the membrane is limited. The effect of roughening the mem-brane surface prior to sputtering was also investigated. They found that the roughened surface delayed the coalescence of the platinum. The delayed coalescence on the roughened membrane reduces the maximum performance attainable,
Table 5
Comparison of the power density of a commercial MEA with 0.4 mg/cm2 platinum loading to that of a 15 nm sputtered platinum MEA with 0.04 mg/cm2 platinum loading
Catalyst layer Power density at 200 mA/cm2 (mW/cm2) Power density at 0.6 V (mW/cm2) Commercial MEA, 0.4 mg Pt/cm2 NA 34 15 nm thin-film Pt, 0.04 mg Pt/cm2 NA 17
Cell measurements were taken at room temperature using dry (non-humidified) H2/O2 at 1 atm.[5].
but reduces the performance sensitivity to the catalyst layer thickness. This can be beneficial since it is difficult to control the thickness of the sputtered layer[5]. A sputtered MEA (thickness of 15 nm, Pt loading of 0.04 mg/cm2 on Nafion 115) was compared to a conventional MEA (Pt loading of 0.4 mg/cm2 on Nafion 115) purchased from Electrochem. Inc. The power densities obtained in this comparison are presented in Table 5. The conventional MEA produced a maximum power of 50 mW/cm2 and the sputtered MEA produced a maximum power of 33 mW/cm2. Therefore, 3/5 of the power was produced with 1/10 the catalyst loading.
4.1. Graded catalyst deposition
A graded or composite catalyst layer refers to a variety of catalyst layers that are produced with multiple deposi-tion methods. A typical form is a supported catalyst layer, PTFE-bound or thin-film electrode, with an additional sput-tering of platinum on the surface of the membrane or elec-trode. The objective of this method is to reduce the thick-ness of the supported catalyst layer and increase the cat-alyst concentration at the interface between the electrode and polymer electrolyte membrane. Reducing the catalyst layer’s thickness is vital for PTFE-bound catalyst layers as the depth that Nafion can be impregnated is limited to 10m
[28]. Catalyst beyond 10m is unreachable by the protons and is therefore inactive.Fig. 8illustrates the distribution of catalyst concentration in a graded catalyst layer.
Ticianelli et al.[28]of the Los Alamos National Labora-tory published a paper in 1988 on the sputtering of catalyst onto electrodes with or without a preformed PTFE-bound layer present. They conducted their study by observing the performance of a conventional PTFE-bound electrode and comparing that with fuel cells employing a composite cat-alyst layer that combined a 50 nm thick sputtered layer and a PTFE-bound layer. They found the addition of a sput-tered layer had the capability of increasing the power den-sity 100–150%. At a current denden-sity of 1.0 A/cm2, the sin-gle cell voltage increased from 0.42 to 0.54 V when a 50 nm layer of platinum was sputtered between a 20 wt.% Pt/C PTFE-bound catalyst layer with a Pt loading of 0.45 mg/cm2. Mukerjee et al.[29]undertook a similar comparison, pub-lished in 1993, with observations concentrated on the oxy-gen reduction reaction kinetics. They found that the
elec-Fig. 8. Change in catalyst concentration with respect to distance from membrane. Reproduced from[25].
trochemically active area was greater by a factor of two for a PTFE-bound electrode with the addition of a sputtered layer. As well, the oxygen reduction reaction overpotential was shown to be lower in the cell featuring the sputtered component.
In a recently granted (2001) patent, held by Cavalca et al.
[25](assigned to Gore Enterprise Holdings Incorporated), a method for fabricating electrodes with catalyst grading in the catalyst layer was divulged. The inventors combined thin-film methods and vacuum deposition techniques, such as electron beam-physical vapor deposition (EB-PVD) and dc magnetron sputtering, to fabricate a catalyst layer with progressive loading. This is not an entirely unique concept. Commercial PTFE-bound catalyst layers have often featured a 50 nm sputtering of platinum to enhance performance[11]. The preparation of the catalyst layer began by mixing a com-mon thin-film ink that contained carbon supported platinum, Nafion solution, and solvents, which was then brushed onto a PTFE blank for transfer-printing. Subsequently, a layer of catalyst, single metal or bimetallic, was deposited via EB-PVD or sputtering onto either the thin-film catalyst layer or the polymer electrolyte membrane. The inventors pre-ferred method of vacuum deposition was EB-PVD because it exhibited greater surface texture, which aids the reaction kinetics. Thus, this method produces a dense pure catalyst layer directly adjacent to the membrane and places dispersed platinum further from the membrane with ionic transport provided by the impregnated Nafion. Table 6presents the
Table 6
Power densities of a single cell with a graded catalyst layer and a reference electrode that does not feature catalyst grading[25]
Catalyst layer Power density at 200 mA/cm2 (mW/cm2) Power density at 0.6 V (mW/cm2) Reference MEA 156 510
MEA with graded catalyst layer 160 696
power densities for a single cell that features catalyst grad-ing on the cathode side. This sgrad-ingle cell is compared with an identical MEA that does not feature catalyst grading, and thus does not feature the EB-PVD region. It is visible in the polarization curves presented by Cavalca et al. that there is no significant benefit in the range of 0–400 mA/cm2. However, at high current densities the performance of the graded cell is far superior. A 30% increase in power density at 1000 mA/cm2 is presented. The membrane represented in the polarization curves is a 20 micron thick Gore Select membrane.
4.2. Multiple layer sputtering
Cha and Lee (CL)[4]presented a novel strategy for de-positing the catalyst layer onto the membrane (Nafion 115) of a PEM fuel cell. The process consisted of multiple short sputterings separated by an application of carbon–Nafion ink. The process was carried out on both sides of the membrane. After each sputtering, the newly formed film was brushed with a Nafion solution and then again with a Nafion–XC-72 carbon powder–isopropyl mixture. The addition of the carbon powder increases the electrical con-ductivity in the intermediate Nafion layer. CL found that after enough catalyst had accumulated on the surface, ad-ditional sputtering of platinum does not contribute to the amount of active area. A single sputtering thickness of 5 nm was found to be ideal. However, when the Nafion–carbon powder–alcohol mixture was applied between additional 5 nm thick sputterings the performance increased consid-erably. But, the marginal increase in performance was negligible after five sputterings. CL found that if the same amount of catalyst was used, the case of multiple thin layers performed markedly better than a single thick layer. The best performance was found when the ratio of Nafion to carbon in the applied mixture was 1:1. The result of these electrodes is comparable to conventional carbon supported catalyst electrodes when the sputtering is repeated four times at a thickness of 5 nm and a Nafion–carbon mixture ratio of 1:1 is used. The conventional electrode had a Pt loading level of 0.4 mg/cm2, whereas the sputtered elec-trode featured a loading of only 0.043 mg/cm2, resulting in a ten times increase in platinum utilization.
5. Electrodeposition methods
The first disclosure of electrodeposition of the catalytic layer in PEM fuel cells was in the form of Vilambi Reddy et al.’s 1992 US patent[30]. This patent detailed the fabri-cation of electrodes featuring low platinum loading in which the platinum was electrodeposited into their uncatalyzed car-bon substrate in a commercial plating bath. The uncatalyzed carbon substrate consisted of a hydrophobic porous carbon paper that was impregnated with dispersed carbon particles and PTFE. Nafion was also impregnated onto the side of
the carbon substrate that was to be catalyzed. The typical Nafion loading was 1.5 mg/cm2.
The Nafion coated carbon paper was placed in a com-mercial platinum acid-plating bath, along with a platinum counter electrode. The face of the substrate that was not coated with Nafion was most likely masked with some form of a non-conducting film. This step would have been taken to ensure that platinum would only be deposited in regions impregnated with Nafion. Thus, when an interrupted dc cur-rent was applied to the electrodes in the plating bath, catalyst ions would pass through the Nafion to the carbon particles and successfully be deposited only where protonic and elec-tronic conduction coexists. This method was able to produce electrodes featuring platinum loadings of 0.05 mg/cm2. This is a significant reduction in loading from the state of the art thin-film electrode.
The performance of the aforementioned half-cell was re-vealed in a subsequent publication[31]by the same research group. Their results showed a definite increase in utiliza-tion due to the platinum catalyst only being deposited where the three-phase zone is located. Their electrodeposited cata-lyst layer electrode, with a Pt loading of 0.05 mg/cm2, pro-vided equivalent performance to the then state of the art PTFE-bound electrode with a Pt loading of 0.5 mg/cm2.
In the following years, additional research on electrode-position of platinum onto porous substrates was continued by Verbrugge[32]. According to Verbrugge, a distinguish-ing difference between his study and the aforementioned patent is the larger amount of sulfuric acid employed by Vilambi Reddy et al. [30]. Another distinguishing fea-ture of Verbrugge’s study is the employment of a mem-brane instead of a Nafion impregnated layer. Using the area provided by the deposition channel, platinum was selectively electrodeposited through the membrane and into the membrane–electrode interfacial region. Verbrugge suggested that this method has the potential to increase platinum utilization because of the concentrated platinum found at the membrane–electrode interface. However, he did not provide the results of these electrodes implemented in a functional fuel cell.
The objective of studies by Hogarth et al.[33], and later by Gloaguen et al. [34], was to improve the reaction ki-netics for the oxidation of methanol using electrodes fab-ricated with electrodeposition. Hogarth et al. placed elec-trodes in a plating bath that contained 0.02 M chloropla-tinic acid and exposed only 1 cm2of the PTFE impregnated
carbon cloth electrode face by using a water seal. In this study, neither a Nafion layer nor a membrane film was ap-plied to the carbon substrate prior to electrodeposition. The Gloaguen et al. study focused on the oxygen reduction reac-tion kinetics of electrodes formed with the electrodeposireac-tion of platinum on carbon supports that were bound by Nafion onto a glassy carbon stick. One of the most significant con-clusions of the study was that Pt activity is less related to particle size and more to the fine structure of the platinum surface.
5.1. Effect of current control
Recently (1998), a study was undertaken by Choi et al.
[35]that investigated electrodeposition of platinum for pro-ducing electrodes in PEM fuel cells. Their specific inter-est was the effect of the current density, duty cycle, and frequency used during the electrodeposition process on the performance of their electrodes. Their uncatalyzed electrode was fabricated by applying a mixture of glycerin, PTFE, carbon black, and isopropyl alcohol to a carbon cloth back-ing. No Nafion or membrane film was applied to the carbon paper prior to the electrodeposition of the catalyst. A pulse generator was used to control the magnitude of the current passing through the electrodes that were placed in a bath of H2PtCl6·6H2O.
During the electrodeposition they varied the current den-sity from 10 to 50 mA/cm2, the duty cycle from 15 to 50%, and the frequency from 0 to 20 Hz. The group found that the optimum current density was 25 mA/cm2. At higher val-ues dendritic crystals form and performance falls. However, electrodes were fabricated most efficiently at a current den-sity of 50 mA/cm2by applying an optimized duty cycle and frequency. The power density found for a fuel cell operating at 70◦C with pure oxygen as the oxidant, where the catalyst layers were fabricated with a current density of 50 mA/cm2, a duty cycle of 25%, and a frequency 2.5 Hz, was shown to be approximately 276 mW/cm2 at a fuel cell voltage of 0.6 V (seeTable 7).
5.2. Membrane layer
The highest performance publicized for a fuel cell fea-turing an electrodeposited catalyst layer was depicted in a US patent granted to Stäb et al. [36] in 2001. In contrast to the Vilambi Reddy et al. patent[30], this group’s uncat-alyzed electrode did not feature a Nafion impregnated sur-face, but rather a thin membrane film. The membrane was approximately 10m thick and was applied to the carbon substrate, which was 75m thick. The cathodes were fab-ricated with the addition of a carbon powder sublayer. In the electrodeposition process, the back of the electrode was covered to avoid electrodeposition in locations far from the future membrane–electrode interface. Thus, during fabrica-tion, the electrocatalyst passes from the electrolyte solution through membrane and is deposited where it encounters the electrically conductive carbon. The process deposits
cata-Table 7
Effect of frequency (on/off time) for a duty cycle of 25% and deposition current density of 50 mA/cm2, H2/O2,T=70◦C[35]
Frequency (Hz) Power density at 0.6 V (mW/cm2)
dc 24
0.25 135
2.5 276
Table 8
Power densities of a cell fabricated by Stäb et al., which features a cathode produced by electrodeposition[36]
Catalyst layer Power density at 200 mA/cm2 (mW/cm2) Power density at 0.6 V (mW/cm2) Produced by electrodeposition 158 408
lyst only where both protonic and electronic conduction is possible. Using this methodology they were able to obtain some of the lowest platinum loading ever reported for an op-erational PEM fuel cell (0.0073 mg/cm2in the anode). The resulting power densities of this cell are listed inTable 8. Little detail is given to the conditions and components used to obtain these results. Nevertheless, the results do indicate a promising potential for this method. In this particular case, the cathode is formed with the electrodeposition method and the anode is a standard electrode with a Pt loading of 4 mg/cm2. The power density reported at a current density of 200 mA/cm2is 158 mW/cm2.
6. Impregnated catalyst layer
The ability to use fabrication techniques that require meltable materials, such as molding and extruding, would be extremely valuable in the production of membrane electrode assemblies. The conventional perfluorosulfonate acid membranes are not melt-processable because of side chain entanglement and the ionic interactions between the functional groups[37]. Kim et al.[37]have been working on a melt-processable membrane and the encapsulating MEA, which is formed out of perfluorosulfonyl fluoride copolymer (PFSF). PFSF is melt-processable and can be fabricated into many forms. Kim et al. formed membrane sheets by hot-pressing PFSF powder at 200–250◦C. Since the membrane can be melted, the catalyst ink no longer requires Nafion ionomer. Kim et al. applied a catalyst ink that contained only Pt/C, glycerol and water to both sides of the PFSF preformed sheet. Subsequently, they hot-pressed the catalyzed sheet at 200◦C, which imbedded the catalyst layer into the softened surface of the membrane. This forms a composite membrane–electrode. The MEA is reported to have effective three-phase boundaries and good adhesion between the membrane and the catalyst layer. Though the performance depicted in the polarization curves of a test
Table 9
Power densities a MEA made by pressing a perfluorosulfonyl fluoride sheet with Pt/C catalyst at two different temperatures (0.2 mg Pt/cm2, H2/O2=1/1 atm)[37] Temperature (◦C) Power density at 200 mA/cm2 (mW/cm2) Power density at 0.6 V (mW/cm2) 70 126 144 80 134 180
cell lags the present state of the art electrodes, the method does show promise (Table 9).
7. Catalyst supports
The most common supported catalyst is platinum sup-ported by high surface area carbon and is used in both the cathode and anode. When CO is present in the fuel stream because of reforming, the platinum is alloyed with other ma-terials such as Ruthenium to reduce poisoning of the fuel cell and retain the performance. Electrocatalysts are com-monly prepared by solution precipitation, which is followed by reduction of platinum salt in either the gas or liquid phase
[13]. Though platinum and platinum alloys are employed in virtually all PEM fuel cell electrodes, other noble met-als have been evaluated and there has been development of methods to synthesize non-noble metal catalysts, such as the pyrolysis of iron[38].
Catalyst metals employed in PEM fuel cells will not be reviewed herein as it is beyond the scope of the review. The metal chosen can have a profound effect on fuel cell perfor-mance, but does not alter the general design or fabrication of the electrode. However, in the following section it will be shown that the supporting material can influence the gen-eral design and fabrication of PEM fuel cell electrodes. The catalyst supports discussed in this section are not relevant to the vacuum deposition and electrodeposition methods of constructing the catalyst layer. In these methods, the cata-lyst metal is deposited directly onto the membrane or gas diffusion layer and no intermediate support is necessary.
7.1. Pt/C weight ratio
The most common support for the catalyst metal is car-bon powder. The platinum to carcar-bon weight ratio (Pt/C) is the ratio of the weight of platinum deposited onto the carbon support to the weight of the carbon support itself. Paganin et al. [14] found that their thin-film cell’s perfor-mance was approximately unchanged when the Pt/C weight ratio was varied from 10 to 40 wt.% with a platinum load-ing of 0.4 mg/cm2. However, the performance deteriorated as the weight ratio was increased beyond 40 wt.%. Paganin et al. suggested that this indicates a negligible change in the active catalyst area for weight ratios between 10 and 40 wt.%, and that the active area markedly decreases beyond these values. The Qi and Kaufman[17]electrodes performed marginally better when the platinum to carbon ratio (Pt/C) was increased from 20 to 40% with a platinum loading of 0.2 mg/cm2.
7.2. Binary carbon catalyst supports
Wang et al.[39]reported on the use of binary carbon sup-port catalysts. Their thin-film layer was catalyzed with plat-inum supported on Vulcan XC-72 and Black pearl 2000
car-Table 10
Power densities for single- and binary-support electrodes Support type Power density at 200 mA/cm2 (mW/cm2) Power density at 0.6 V (mW/cm2) Binary 150 312 Single 136 246
Pt loading in cathode and anode are 0.2 and 0.35 mg/cm2, respectively. Operating conditions: cell temperature, 60◦C; atmospheric pressure; O2 and H2 flow rate at stoichiometry of 5[39].
bon powders, featuring surface areas of 254 and 1475 m2/g and particle sizes of 30 and 15 nm, respectively. The cata-lysts were mixed in a ratio of 9:1. The group constructed their thin-film catalyst layers according to Wilson’s descrip-tions[3] with a platinum loading of 0.20 mg/cm2. The re-sults found using cyclic voltammetry showed the binary sup-ported catalyst layer had a greater active area and increased the utilization efficiency by 14%. In addition, the higher power density found at 200 mA/cm2(Table 10) reveals an increase in the oxygen reduction reaction kinetics.
7.3. Conducting polymer catalyst supports
Qi et al. [40] prepared supported catalyst by deposit-ing platinum onto protonically and electronically conductive polymers. The conducting polymers were fabricated from a composite of polypyrrole and polystyrenesulfonate. These supports were developed to provide a catalyst support that could fulfill the roles of both the electron conducting carbon powder and the Nafion in conventional catalyst layers. The development of these supports dissolves the need for Nafion layers or impregnation.
To fabricate electrodes, the conducting polymer supported catalyst was mixed with a 15% PTFE solution and applied to the carbon paper gas diffusion layer. The researchers attained maximum current densities of 100 mA/cm2. Even though this does not compare well with state of the art elec-trodes, it does suggest future possibilities for this concept if the procedure for the synthesis of the conducting support composite is optimized.
7.4. Carbon nanohorn catalyst supports
Yoshitake et al.[41]deposited platinum catalyst onto high surface area single-wall carbon nanohorns for use in the catalyst layers of PEM fuel cells. The catalyst supports were prepared by CO2laser ablation. The platinum was deposited
via a colloidal method. The platinum to support ratio in typical PEM fuel cells is 20% and ratios of 20–40% were obtained for the nanohorn supported catalyst particles. The size of particles was 2 nm. The research group compared a fuel cell they prepared with catalyst supported by the usual carbon black to that of a fuel cell with catalyst supported by single-wall carbon nanohorn supports. The latter was shown to have better performance.
8. Gas diffusion layer development
The gas diffusion layer has many roles to fulfill. Firstly, it is the electronic conductor between the current collecting bipolar plates and the catalyst layers. Thus, thin gas diffu-sion layers with a high conductivity is desired for electrical efficiency. Secondly, the gas diffusion layer is fabricated in the form of porous media to allow the passage of the re-actant and product flows. To improve mass transport, gas diffusion layers can be made more porous at the cost of in-creased electrical resistance. In addition, the porous gas dif-fusion layer is often employed as the base substrate for the deposition of the catalyst layer. Another important function of the gas diffusion layer in an MEA is to reject liquid wa-ter from the inwa-ternals of the MEA. If wawa-ter collects near, or in, the catalyst layer, a large fraction of the catalyst will not be utilized. Typically, PTFE (Teflon) is applied through various methods to the gas diffusion layer in order to eject the water. However, Teflon is not an electric conductor and reduces the porosity, which hinders the transport of reactant gases. Thus, Teflon should be applied with careful measure. The common Nafion content in the solution applied to the gas diffusion layer is 33%.
Paganin et al.[14]fabricated a typical Teflonated gas dif-fusion layer by filtering a PTFE and carbon powder suspen-sion onto both sides of a carbon cloth. The layer had to be dried for 30 min at 280◦C to remove the dispersion agent from the PTFE suspension. The layer was then sintered at 330◦C. Prior to use, the composite gas diffusion layers were cleansed by heat and chemical treatments.
A recent development in gas diffusion layers is the use of carbon aerogels to form the porous substrate. Glora et al.
[42]documented their integration of carbon aerogels in PEM fuel cells. The 300m thick layers featured micron-thin fine-structured layers on both sides of the gas diffusion layer. These fine layers are incorporated to decrease contact re-sistances between the electrode and the membrane, as well as the current collecting bipolar plate. The highest level of electrical conductivity attained in their study was 28 S/cm in an 80% porous sample. The largest pore sizes were in the range of several microns. The group implemented the gas diffusion layers in a test cell and found a power density only 1/6 that of a typical PEM fuel, but this was attributed to poor catalyst layer preparation and not the gas diffusion layer.
8.1. Polytetrafluoroethylene (PTFE) content
Paganin et al.[14]found that the PTFE content of the gas diffusion layer in their thin-film cell was optimal at a value of 15%. However, no drop in voltage, at any current density, was found when the content was varied from 10 to 40%.
8.2. Influence of carbon powder
Antolini et al. [43] studied the influence of the pow-der placed in both the gas diffusion and catalyst layers
Table 11
Power for PEM fuel cells operating at 85◦C Gas diffusion layer Power density at
200 mA/cm2 (mW/cm2) Power density at 0.6 V (mW/cm2) Carbon paper/Vulcan 152 402 Carbon cloth/Vulcan 156 552 Carbon cloth/Shawiningan 166 744
H2/O2 pressures = 2/2 atm for the electrodes with Vulcan on carbon paper or carbon cloth and 2/5 atm for the electrode with Shawinigan on carbon cloth in the gas diffusion layer[43].
of PEM fuel cells. The two carbon powder types investi-gated were oil-furnace carbon black and acetylene-black, namely Vulcan XC-72R and Shawinigan carbon powder, respectively. The group found that an electrode featuring Shawinigan carbon powder performed substantially better than an electrode containing Vulcan carbon powder. The resulting power densities for each formulation of the gas diffusion layer are listed in Table 11. In addition, even higher levels of performance were attainable when combi-nations of the two carbon powders were used and the fuel and oxidant streams were sufficiently pressurized. The ideal combination found was to use Vulcan carbon powder in the catalyst layer, because of Vulcan’s high surface area, and to impregnate the gas diffusion side of the electrode with the Shawinigan carbon powder.
8.3. Thickness
Paganin et al.[14]showed that the performance of their thin-film electrodes increases considerably when the gas dif-fusion layer thickness is increased from 15 to 35m. Ac-cording to the researchers, this increase in performance is because the very thin layers provide a poor electrical contact between the catalyst layer and the current collecting plate. It is also possible that the thinner gas diffusion layers did not possess the mechanical strength to resist the compres-sion of the bipolar plate. This comprescompres-sion would force the collapse of the pores in the gas diffusion layer underneath the ribs of the bipolar plate.
They also found that the marginal increase in performance was negligible when the thickness was further increased from 35 to 50m. In addition, they found a drop in perfor-mance at higher current densities when the diffusion layer thickness was increased to 60m. This polarization can be attributed to an increase in the diffusion distance and elec-trical resistance.
8.4. Composite gas diffusion layer
A composite gas diffusion layer commonly consists of Teflonated carbon cloth/paper backing with a microporous hydrophobic sublayer sandwiched between the carbon back-ing and the catalyst layer. The role of the hydrophobic sub-layer is to improve the transport mechanisms across the porous backing and catalyst layer interface, and to enhance
water management. QK[12] speculated that the improved water management is caused by the microporosity of the sublayer. The macropore size is largely determined by the particle size of the carbon aggregate. A common carbon par-ticle size is 30 nm. QK suggest that stable water parpar-ticles may not be able to form in such small and hydrophobic pores and is, therefore, less likely to flood.
Lufrano et al. [44] documented the results of thin-film electrodes with the introduction of an intermediate hy-drophobic carbon layer. This sublayer was composed of carbon and PTFE that was sprayed onto the carbon pa-per backing. They found that the optimal PTFE content was 20 wt.%, though no significant change in performance was found when varying the content from 10 to 60 wt.%. However, when the oxidant stream consisted of air, the cell performance became more influenced by the PTFE content at elevated current densities.
Song et al.[19]formed a microporous sublayer, consisting of PTFE and carbon powder, that was sandwiched between a wet-proofed carbon paper and a thin-film catalyst layer. They employed ac impedance measurement techniques to optimize their thin-film electrodes. The researchers found that the optimal loading of the microporous sublayer was 3.5 mg/cm2, with a PTFE concentration of 30 wt.%.
GA [13] from the Center for Electrochemical Systems and Hydrogen Research (CESHR) at Texas A&M Univer-sity presented a paper in 2002 describing recent progress in performance improvement of PEM fuel cells at their cen-ter. The CESHR-developed gas diffusion layer consists of a 0.65:0.35 acetylene black–PTFE mixture spread and rolled at 3 mg/cm2onto carbon cloth. The porosity of CESHR gas
diffusion layer was much greater than that of the standard ELAT gas diffusion layer that was also used in their study: 60% in comparison to 45%. Moreover, the thickness of the CESHR gas diffusion layer was 0.08 mm thinner than the standard 0.38 mm ELAT gas diffusion layer. Thus, a shorter diffusion path is a likely factor in the augmented perfor-mance of the CESHR gas diffusion layer over the standard gas diffusion layer.
Qi and Kaufman (QK)[45]documented a study where a microporous sublayer was inserted between the carbon cloth gas diffusion layer and the catalyst layer to improve water management. The microporous layer reduced the difference in performance when different batches of carbon paper were used. QK presented results that prove carbon paper supplied by the same manufacturer with identical specifications can provide significantly different performances. The best per-forming sublayer consisted of 35% PTFE and 65% Vulcan XC-72 carbon powder with a carbon loading of 2.0 mg/cm2. The carbon paper, to which the sublayer was applied, con-tained 20% PTFE.
8.5. Pore formers in the gas diffusion layer
Kong et al. [46]documented an examination of the ef-fect of pore size distribution in the gas diffusion layer. In
![Fig. 3. Preparation of a gas diffusion electrode employing the thin-film methodology. Reproduced from [13].](https://thumb-us.123doks.com/thumbv2/123dok_us/1795088.2756937/4.1263.485.888.1280.1594/fig-preparation-diffusion-electrode-employing-film-methodology-reproduced.webp)
![Fig. 8. Change in catalyst concentration with respect to distance from membrane. Reproduced from [25].](https://thumb-us.123doks.com/thumbv2/123dok_us/1795088.2756937/10.1263.161.473.627.881/fig-change-catalyst-concentration-respect-distance-membrane-reproduced.webp)