White Rose Research Online URL for this paper:
http://eprints.whiterose.ac.uk/146603/
Version: Accepted Version
Article:
Zhang, Zhihong, Zhang, Genzhou, Zhang, Zhonghao et al. (4 more authors) (2019)
Structural network inference from time-series data using a generative model and transfer
entropy. Pattern Recognition Letters. ISSN 0167-8655
https://doi.org/10.1016/j.patrec.2019.05.019
[email protected] https://eprints.whiterose.ac.uk/ Reuse
This article is distributed under the terms of the Creative Commons Attribution-NonCommercial-NoDerivs (CC BY-NC-ND) licence. This licence only allows you to download this work and share it with others as long as you credit the authors, but you can’t change the article in any way or use it commercially. More
information and the full terms of the licence here: https://creativecommons.org/licenses/ Takedown
If you consider content in White Rose Research Online to be in breach of UK law, please notify us by
Structural network inference from time-series data using a generative model and transfer entropy
Accepted Manuscript
Structural network inference from time-series data using a generative
model and transfer entropy
Zhihong Zhang, Genzhou Zhang, Zhonghao Zhang, Guo Chen,
Yangbin Zeng, Beizhan Wang, Edwin R. Hancock
PII:
S0167-8655(19)30168-0
DOI:
https://doi.org/10.1016/j.patrec.2019.05.019
Reference:
PATREC 7530
To appear in:
Pattern Recognition Letters
Received date:
9 February 2019
Revised date:
6 May 2019
Accepted date:
25 May 2019
Please cite this article as: Zhihong Zhang, Genzhou Zhang, Zhonghao Zhang, Guo Chen,
Yangbin Zeng, Beizhan Wang, Edwin R. Hancock, Structural network inference from time-series
data using a generative model and transfer entropy,
Pattern Recognition Letters
(2019), doi:
https://doi.org/10.1016/j.patrec.2019.05.019
This is a PDF file of an unedited manuscript that has been accepted for publication. As a service
to our customers we are providing this early version of the manuscript. The manuscript will undergo
copyediting, typesetting, and review of the resulting proof before it is published in its final form. Please
note that during the production process errors may be discovered which could affect the content, and
all legal disclaimers that apply to the journal pertain.
A
CCE
P
T
E
D
M
A
N
U
S
CRIP
T
1 Highlights• We concentrate on the problem of describing the directed flow of information between nodes based on transfer en-tropy.
• We have developed a weighted directed supergraph based on the von Neumann entropy of a directed graph.
• Our model can improve the classification performance on fMRI brain connectivity data when the training data are limited.
ACCEPTED MANUSCRIPT
A
CCE
P
T
E
D
M
A
N
U
S
CRIP
T
2Pattern Recognition Letters
journal homepage: www.elsevier.com
Structural network inference from time-series data using a generative model and transfer
entropy
ZhihongZhanga,2, GenzhouZhangb, ZhonghaoZhangc, GuoChenc, YangbinZenga,2, BeizhanWanga,∗∗, Edwin R.Hancockd
aXiamen University, Xiamen, China
bState Grid Shaanxi Electric Power Company, Xian, China
cState Grid Shaanxi Information and Telecommunication Company, LTD, Xian, China
dUniversity of York, York, UK
ABSTRACT
In this paper we develop a novel framework for inferring a generative model of network structure representing the causal relations between data for a set of objects characterized in terms of time series. To do this we make use of transfer entropy as a means of inferring directed information transfer between the time-series data. Transfer entropy allows us to infer directed edges representing the causal relations between pairs of time series, and has thus been used to infer directed graph representations of causal networks for time-series data. We use the expectation maximization algorithm to learn a generative model which captures variations in the causal network over time. We conduct experiments on fMRI brain connectivity data for subjects in different stages of the development of Alzheimer’s disease (AD).
Here we use the technique to learn class exemplars for different stages in the development of the disease,
together with a normal control class, and demonstrate its utility in both graph multi-class and binary classifications. These experiments are showing the effectiveness of our proposed framework when the
amounts of training data are relatively small.
Keywords: transfer entropy, supergraph, time series, network inference, expectation maximization algorithm
©2019 Elsevier Ltd. All rights reserved.
1. Introduction
A key goal of multivariate time-series data analysis is to infer a network which underpins the observed interactions between individual variables. This line of inquiry has permeated mis-cellaneous communities, including computational neuroscience, financial market modelling and social media analysis. Recently, transfer entropy (TE) has been recognised as a natural tool for inferring causal or directed relationships between pairs of vari-ables. It has been widely used for example in the analysis of magnetoencephalography (MEG) (Vicente et al., 2011; Sokolova and Lapalme, 2009), electroencephalography (EEG) (Staniek and Lehnertz, 2008) and functional magnetic resonance imag-ing (fMRI) data (Hinrichs et al., 2006; Wibral et al., 2011). By contrast, mutual information (MI) (Kraskov et al., 2004) is
∗∗Corresponding author
e-mail:[email protected](Beizhan Wang)
2Co-first author
the amount of shared information between individual variables while Pearson’s correlation coefficient (PCC) (Lawrence and
Lin, 1989) is a measure of the degree to which two random variables diverge from independence. Such measures reflect the symmetric connectivity of a functional network and lack the ability to capture asymmetric connectivity and describe the directional transfer of information flow between nodes. When compared with the closely related Granger causality (Granger, 1969), transfer entropy is characterized as model-free and capa-ble of capturing non-linear relationships.
Not surprisingly the directed relationships between variables gauged by transfer entropy can be considered as directional edge connections in a causal network or directed graph. A consid-erable amount of literature has been published on the issue of representing data using graph structure. However little atten-tion has been paid to the problem of how to capture structural variations based on edge connectivity in such representations. Existing methods for learning edge connectivity can be roughly categorized into two different classes: 1) spectral graph-based
A
CCE
P
T
E
D
M
A
N
U
S
CRIP
T
3 methods which are simple powerful yet lack of stability underslight perturbations in network structure (Luo et al., 2006); 2) probabilistic-based methods which posses the property of being underpinned by a well-knit probability theory. Considerable effort has been expended at describing the variability of edge
connectivity pattern using such methods. For instance, Torsello and Hancock (Torsello and Hancock, 2006) have reconstructed trees using a Bernoulli distribution for node occurrences in sam-ples of trees with unknown node correspondences. They adopt a minimum description length framework. This encodes the complexity for both a) of a set of tree-unions used to impose correspondences and infer connectivity for different classes of
tree data and b) the number of mixture components needed to capture the class or cluster structure of the tree data. Wilson et al. (Wilson et al., 2015) have extended these ideas from trees to graphs. They have proposed a method for constructing a gen-erative model represented by a supergraph from which a set of smaller sample graphs can be obtained by edit operations. Their method estimates a probability distribution for the occurrence of nodes and edges over the supergraph. This work is restricted to unweighted undirected networks.
Functional MRI is generally characterized as time series, and recently much of literature pays particular attention to capture underlying relationships between this kind of series, aimed at classifying subjects at different stages of AD. Existing
meth-ods may be roughly divided into two main categories, namely undirected and directed graph-based methods. The method of calculating Pearson’s correlation coefficients, represented the
connectivity between different brain regions, based on a sliding
window approach has been proposed in (Chen et al., 2017, 2016). This kind of approach falls into the first categories. Khazaee et al. (Khazaee et al., 2017) proposed a directed graph model for iden-tifying the changes in brain networks using multivariate Granger causality analysis. In our previous work (Wu et al., 2018), we employed histogram statistics and transfer entropy to measure causality relationships between time-series variables. Together these studies provide significant insights into the modeling of relationships between time-series variables in brain functional connectivity networks.
In this paper, we concentrate on the problem of describing the directed transfer or flow of information between nodes based on transfer entropy. Using transfer entropy, we extend the work of Wilson et al. from unweighted undirected graphs to a weighted directed supergraph model, and then propose a novel frame-work that combines the supergraph with transfer entropy. This framework is capable of not only effectively inferring fMRI brain
connectivity structure, but also achieve significant improvements in classification accuracy for the publicly available Alzheimers Disease Neuroimaging Initiative (ADNI) fMRI dataset3.
2. Material
In this section we present the terminology and notation which underpin our study.
3http://adni.loni.usc.edu/
2.1. Transfer entropy
Entropy as a well-known information theoretic concept which measures of the average uncertainty or equivocation in a system. Specifically, if we take the expectation of the information ac-cording to the probability distributionp(x), we end up with the Shannon entropy (Shannon, 1948):
H(X)=−X x
p(x) logp(x). (1)
The mutual information (Shannon, 1948) of two discrete ran-dom variablesXandY with the joint probability distribution
p(x,y) is a measure of their statistical dependence. In terms of probabilities, we take the form:
I(X;Y)=X x X y p(x,y) log p(x,y) p(x)p(y). (2) Note that the mutual information is symmetric, i.e.,I(X;Y)=
I(Y;X). In contrast, transfer entropy is a causally asymmet-ric measure of information transfer between two random pro-cesses. To frame this mathematically, we introduce the nota-tionXn(k) ={Xn−k+1, ...,Xn−1,Xn}andY
(l)
n ={Yn−l+1, ...,Yn−1,Yn} to denote the k- andl-length history of the variables X and
Y, up to and including time stepn, which have realizations
x(nk)={xn−k+1, ...,xn−1,xn}andy(nl) ={yn−l+1, ...,yn−1,yn}, respec-tively. In (Schreiber, 2000), Schreiber et al. define the transfer entropy as the reduction of uncertainty in a destination process that results from knowing the source process in the context of the causal past of the destination. This yields the following definition of transfer entropy:
TY→X = X p(xn+1,x(nk),y (l) n) log p(xn+1|x (k) n ,y (l) n) p(xn+1|x(nk)) . (3)
This is the central concept in measuring a directed edge connec-tivity. While the mathematical formulation above of the transfer entropy is relatively straightforward, in practice accurately esti-mating its value from time-series data is very challenging. The main reason is that it is highly sensitive to the type and qual-ity of the available data. We thus discuss the various types of estimators available.
Gaussian estimator. The simplest estimator uses a multivari-ate Gaussian model for the random variablesXofddimensions, and the corresponding average entropy can be defined as (Cover and Thomas, 2012):
H(X)= 1
2ln ((2πe) d
|Ω|), Ω =XXT, (4) where the overbar denotes an average over the statistical en-semble. Since Eq. 4 sidesteps the computation of probability density functions (PDFs), the local entropy can be obtained by reconstructing the probability of a given observation sequencex
in a multivariate process using the covariance matrixΩ(Lizier,
2014): p(x)= 1 (√2π)d√|Ω|exp − 1 2(x−µ) Ω−1 (x−µ)T ! . (5)
ACCEPTED MANUSCRIPT
A
CCE
P
T
E
D
M
A
N
U
S
CRIP
T
4 As above, where the observations used for the correspondingPDFs are from the whole time series of the processes then the transfer entropy,TY→X, is the expectation of the local transfer values: TY→X =E log p(xn+1|x (k) n ,y (l) n ) p(xn+1|x(nk)) . (6)
Note that the Gaussian estimator is fast (O(Nd2)) and parameter-free, but suffers from the limitation of assuming linear
interac-tions between variables.
Kernel estimator. Schreiber et al. (Schreiber, 2000) pro-posed a approximate solution of the Eq. 3, and the joint PDF
ˆ
pr(xn+1,x (k)
n ,y
(l)
n ) is estimated by a kernel functionΘ,
ˆ pr(xn+1,xn,yn)= 1 N N X n′=1 Θ xn+1−xn′+1 xn−xn′ yn−yn′ −r , Θ(x)= 1, x>0 0, x≤0, (7)
where the norm| · |is the maximum distance. Unlike Gaussian estimators, kernel estimation is model-free and capable of cap-turing non-linear relationships, although it requires a greater computational complexityO(N2).
Kraskov-Stogbauer-Grassberger (KSG) estimator¨ . Ini-tially, Kraskov (Kraskov, 2004) suggested that the transfer en-tropy (Eq. 3) is equal to the difference of two mutual information
quantities:
TY→X =I(Xn+1,Xn(k);Yn(l))−I(Xn(k);Yn(l)). (8) Here the above expression leads to an over estimation for trans-fer entropy. However, this limitation has been addressed by extending the KSG estimation (algorithm 1) to conditional mu-tual information in (Kraskov et al., 2004; Frenzel and Pompe, 2007). Hence, the transfer entropy estimator can be rewritten as:
TY→X=ψ(k)−E n ψ(ηx(k) n +1)−ψ(η xn+1x(nk) +1)−ψ(η y(nl)x(nk)) o . (9) Hereψdenotes the digamma function, εis the max norm to thek-th nearest neighbor in the full{xn+1,y(nl),x
(k)
n }space and
{ηx(k)
n , ηxn+1x(nk), ηy(nl)x(nk)} are the neighbour counts strictly within
max norms ofε in the{x(nk)},{xn+1,x (k) n } and{y (l) n ,x (k) n }spaces, respectively.
KSG estimation inherits the non-linear and model-free char-acteristics of kernel estimation. Being effectively parameter-free
it benefits from the stability to the choice of k. Despite its relatively expensive computation which requires timeO(kN2),
KSG estimation represents the seminal solution to estimating transfer entropy and measuring directed connectivity between time-series variables.
2.2. Generative model
We consider a problem of learning a generative model from a set of sample graphs by matching them to a so-called su-pergraph that characterizes the high-level structural informa-tion contained within the graphs. To frame this formally, we now commence to defining some notation. We use the notation
G={G1, ...,Gi, ...,GN}to denote the set of sample graphs from which we aim to learn the supergraph, whereGi =(Vi,Ei) is thei-th graph with the set of nodes,Vi, and the set of edges,
Ei. Similarly, the supergraph is represented byF =(VF,EF).
Further, we represent the structural information of the i-th graph, Gi, using a |Vi| × |Vi| weighted adjacency matrix Di and that of supergraph, F, using a |VF| × |VF|weighted ad-jacency matrixM. Clearly, we haveDi
ab∈(0,1],(a,b)∈Eiand
Mαβ∈(0,1], (α, β)∈EF. We also define a set of assignment
matrixS = {S1, ...,Si, ...,SN
}, where Siis of size
|Vi| × |VF| and its elements indicate the corresponding structure matching between the graphGiand supergraphF as follows:
Siaα=
(
1 if f(a)=α,
0 otherwise, (10)
where the mapping function f(a) = αimplies that the node
a∈Viis assigned to the nodeα∈VF.
Having established the necessary notation, we now proceed to develop the generative model. The idea underpinning the probabilistic framework of the generative model is that one maximizes a posteriori probability of the observed graphGi given the supergraphF and assigned matrixSi. According to (Luo and Hancock, 2001; Wilson et al., 2015), the posterior probability can be represented by
P(Gi|F,Si)= Y a∈Vi X α∈VF Kiaexp µX b∈Vi X β∈VF DiabMαβSibβ , µ=ln1−Pe Pe , Kia=P|Vi|·|VF| e Bia. (11)
HerePeis the error of relation matching between the nodes of an observed graph and those of the sueprgraph, andBiais a probability of observing a nodeain graphGi, its value depends only on the identity of the nodea. The conditional likelihood above is appropriate for both undirected and directed graphs, and also gauges the difference between the two graphs.
Under the assumption that the graphs inGare independent from each other, the conditional likelihood over the set of ob-served graphs has realizations:
P(G|F,S)=Y Gi∈G P(Gi|F,Si) =Y Gi∈G Y a∈Vi X α∈VF Kaiexp µX b∈Vi X β∈VF DiabMαβSibβ . (12)
3. Weighted directed supergraph learning
Bearing in mind that in this work we focus only on directed graphs, the main objective of this section is therefore to demon-strate how to construct a weighted directed supergraph learning framework.
3.1. Minimum Description Length Coding
The minimum description length (MDL) principle is of paramount importance for learning the model that best codes the
A
CCE
P
T
E
D
M
A
N
U
S
CRIP
T
5 observed data (Gr¨unwald et al., 2005; Jorma, 1998). Motivatedby (Wilson et al., 2015), we adopt a two-part MDL criterion to seek the optimal supergraph structure, resulting in a total coding length
L(G,F)=L(G|F)+L(F), (13)
whereL(G|F) is the code-length over the observed graphs given the supergraph andL(F) is the code-length of measuring the complexity of the supergraph. The optimal supergraph can hence be obtained by weighing the goodness-of-fit of the observed graphs against the complexity of the supergraph.
For the use of the two-part MDL principle, an original idea of computing the code-length of the observed graphs given the supergraph is to adopt an average of the negative logarithm of the likelihood function given in Eq. 12. As a result, we have
L(G|F)=− 1 |G|lnP(G|F,S) =− 1 |G|ln X α∈VF Kaiexp µX b∈Vi X β∈VF DiabMαβSibβ . (14) Having explained how the first term in the MDL criterion is computed, we now proceed to measure the complexity of the supergraph. Empirically, counting the number of parameters in the model can be considered as a simple solution to measure the complexity of a model. However, some estimators such as the numbers of nodes or edges in a graph, do not work well for as measure of true graph complexity. To overcome this bottleneck, Han et al. (Wilson et al., 2015) have proposed an interesting measure of graph-model complexity, namely the von Neumann entropy, and developed an approximation to compute the complexity of the unweighted undirected supergraph which depends on the node degree combinations of constituent edges. Unfortunately, for weighted directed graphs this is not a viable proposition since it neither distinguishes between the in-degree and out-degree of nodes, not assigns weights to the nodes or edges.
Motivated by the well documented capabilities of the von Neu-mann entropy in characterizing structural properties of networks (Han et al., 2012; Anand et al., 2011), Ye et al. (Ye et al., 2014) have extended its computation to weighted directed graphs by distinguishing between the in- and out-degree of nodes, leading to the following expression for the directed graph entropy
H=1− 1 |VF|− 1 2|VF|2 X (α,β)∈EF dinα dβindoutα 2 + X (α,β)∈EF1 1 dout β d out α , dinα = X γ∈VF Mγα, dαout= X γ∈VF Mαγ, dinβ = X γ∈VF Mγβ, dβout= X γ∈VF Mβγ, (15) whereEis the set of all the edges andE1is the set of
bidirec-tional edges. Hence, by adding together the two contributions to the code-length, the overall code-length (Eq. 13) can be
rewritten as L(G,F)=L(G|F)+L(F) =−1 |G|ln X α∈VF Kaiexp µX b∈Vi X β∈VF DiabMαβSibβ +1 − 1 |VF|− 1 2|VF|2 X (α,β)∈EF din α din βd out2 α + X (α,β)∈EF1 1 dout β d out α . (16) Unfortunately, work aimed at directly estimating the code-length is intractable due to the mixture structure, and this motivates us to resort to the iterative expectation maximization (EM) algo-rithm.
3.2. Optimization with EM algorithm
Having posed the problem of learning a weighted directed supergraph as that of code length optimization, we now proceed to use the EM algorithm to locate the structural characteristics of the supergraph. Noting the equivalence of the minimization of the overall code-length (Eq. 16) and the maximization of its negative, we follow the MDL setting of the EM algorithm in (Figueiredo and Jain, 2002) and the weighted log-likelihood function in (Wilson et al., 2015; Luo and Hancock, 2001), lead-ing to the followlead-ing expression
A(n+1) (G|F,S(n+1)) = 1 |G| X Gi∈G X a∈Vi X α∈VF Qia,(αn) lnKai +µX b∈Vi X β∈VF DiabMαβ(n)Sbi,(βn+1) −1+ 1 |VF| + 1 2|VF|2 X (α,β)∈EF din α din βd out2 α + X (α,β)∈EF1 1 dβoutdoutα . (17)
For the expression above, we observe that
P Gi∈G P a∈Vi P α∈VF Q i,(n) aα lnKai = P Gi∈G P a∈VilnK i a, which contributes a constant amount. As a result the weighted log-likelihood function can be rewritten as
ˆ A(n+1)(G|F,S(n+1)) = 1 |G| X Gi∈G X a∈Vi X α∈VF X b∈Vi X β∈VF Qia,(αn)DiabM (n) αβS i,(n+1) bβ −1+ 1 |VF| + 1 2|VF|2 X (α,β)∈EF dinα din βd out2 α + X (α,β)∈EF1 1 doutβ doutα . (18) 3.2.1. Maximization
The maximization step of the EM algorithm can be realized by computing the derivatives of ˆA. This step involves a reformu-lation of both the structure of the supergraph and the assignment variables.
Updating assignment variables. We now commence by computing the partial derivative of the Eq. 18 with respect
ACCEPTED MANUSCRIPT
A
CCE
P
T
E
D
M
A
N
U
S
CRIP
T
6 to the element of the assignment matrixSi, which has the form:∂Aˆ(n+1) ∂Sib,(βn+1) = 1 |G| X a∈Vi X α∈VF Qia,(αn)DiabM (n) αβ. (19)
As a result, the variables appearing in the assignment matrixSi can be derived using softmax update rule (Bridle, 1990)
Sia,α(n+1)← exp ∂Aˆ(n+1) ∂Sai,(αn+1) P α′∈VFexp ∂Aˆ(n+1) ∂Sai,(αn′+1) . (20)
Updating supergraph structure. Unlike the case with undi-rected graphs (Wilson et al., 2015), we consider the complexity of a weighted directed supergraph by using the expression for the von Neumann entropy of a weighted directed graphs. The partial derivative of the Eq. 18 with respect to the entry of ad-jacency matrix of the weighted directed supergraphGhas the form: ∂Aˆ(n+1) ∂Mαβ(n) = 1 |G| X Gi∈G X a∈Vi X b∈Vi Qia,(αn)DiabS i,(n+1) bβ − 1 2|VF|2 X (α,β)∈EF dαin (dβindαout)2 + 2d in α Tβindoutα 3 + X (α,β)∈EF1 1 dout β d out2 α . (21)
Similarly, the softmax update equation takes the form:
M(αβn+1)← exp ∂∂AMˆ(n(+n1)) αβ ! P (α′,β′)∈EFexp ∂Aˆ(n+1) ∂Mα(n′)β′ !. (22) 3.2.2. Expectation
We next compute the a posteriori probabilities of the missing correspondence from nodes of an observed sample graph to those of the directed supergraph. This is done by applying the Bayes theorem, and we have
Qia,(αn+1)= exp P b∈Vi P β∈VF DiabM (n) αβS i,(n) bβ πiα,(n) P α′∈VFexp P b∈Vi P β∈VF D i abM (n) α′βS i,(n) bβ πiα,(′n) , πiα,(′n)=hQ i,(n) aα ia′. (23)
At this point, the updates of both assignment matrices and supergraph structure, and the re-estimation of the a posteriori probabilities can be interleaved and alternately performed until a convergence is reached.
4. The proposed framework for fMRI data
Here the main application of our transfer entropy framework is to analyze fMRI time-series data for various regions of the brain for subjects at different stages in the progression of Alzheimer’s
disease. The fMRI dataset derives from the publicly available ADNI database. We use data for 114 subjects included in fMRI dataset. These subjects can be divided into four categories in terms of the degree of development of the disease. These are a) a Healthy Control (NC) group of 43 subjects, b) a Healthy Control 2 (NC2) group of 17 subjects, c) an Early Mild Cognitive Impairment (EMCI) group of 17 subjects, and d) a Late Mild Cognitive Impairment (LMCI) group of 38 subjects. The fMRI data for each subject consists of time series of 116 brain regions (aka ROIs, regions of interest). The neural activity of brain regions is measured using time series of the blood oxygenation level-dependent (BOLD) signal, which is characterized by real-valued variables. Considerable effort has been expended aimed
at developing effective methods for exploring the functional
connectivity between ROIs based on the BOLD signals. These include the use of Pearson’s correlation (Chen et al., 2017; Zhang et al., 2016), and partial correlation (Jie et al., 2014). However, these methods are confined to the measurement of undirected causality and result in symmetric relationships.
We, on the other hand, consider a problem of characteriz-ing the functional connectivity of brain regions uscharacteriz-ing transfer entropy. The BOLD signals from each voxel can be divided into multiple overlapping time-series segments using a sliding window approach to capture the non-stationary interactions be-tween ROIs. Specifically, we denoteLas the total length of the BOLD signals,Was the length of the sliding window, andtas the sliding step size. The number of segments isP= L−W
t . For thep-th segment, we proceed to calculate the transfer entropy betweeni-th ROI andj-th ROI using the Eq. 3, which denotes asZi jp. Then we make use of the root mean square (RMS) to measure the degree of the information transfer between different
ROIs, which is given by ˜ Zi j = s P p(Z p i j)2 P . (24)
We can, therefore, generate the transfer entropy matrix ˜Zfor each subject. The elements of ˜Zimply the degree of the asymmetric connectivity and are real-valued. The transfer entropy matrix can thus be regarded as a representation of a weighted directed graph. The node pairs with weak observed evidence of func-tional connectivity due to noises of signal detection problems, may though have potential connectivity. Rather than assigning a binary connectivity index (Martin et al., 2016), we do not elimi-nate weak connections by thresholding. Instead, we iteratively update elements of the matrix via expectation-maximization. In this way we avoid the unnecessary loss of functional con-nectivity information in the inferred network. With the set of adjacency matrices to hand, we can learn a corresponding super-graph for each class of subjects by the method as demonstrated in Section 3. Such supergraphs enable us to effectively infer
the structure of fMRI functional connectivity networks (more details are presented in Section 5).
5. Experiments
In this section we detail both the results and their analysis on a dataset extracted from fMRI scans of human brains for
A
CCE
P
T
E
D
M
A
N
U
S
CRIP
T
7Table 1: Multi-class classification results of both different methods and TE
estimators in fMRI dataset
Method micro-F1 macro-F1
TECA[Gaussian] 0.6263±0.0133 0.6384±0.016 TECA[Kernel] 0.6789±0.01 0.6058±0.0236 TECA[KSG] 0.6982±0.0295 0.6754±0.0302 Ours[Gaussian] 0.6491±0.0224 0.5933±0.0581 Ours[Kernel] 0.7123±0.03 0.6665±0.0316 Ours[KSG] 0.7456±0.0196 0.7209±0.022
subjects at various stages in the development of Alzheimer’s disease. We commence by studying the convergence properties of the proposed framework, and then report performance on classification tasks compared with our previous work (Wu et al., 2018).
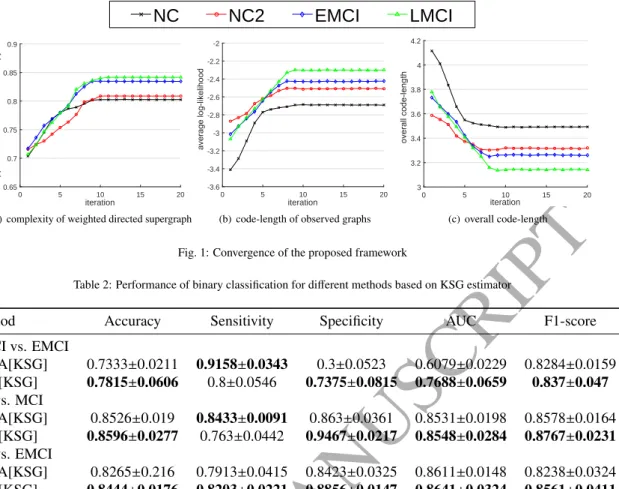
5.1. Convergence
The first aim in this study is to investigate the convergence properties of the proposed framework. We initialize the struc-tural information of the supergraph with the median graph for each class, and the individual correspondence assignment matri-ces using graduated assignment (Gold and Rangarajan, 1996). Fig. 1 shows the convergence of the weighted directed super-graph for each class with iteration number, when measured in terms of a) the supergraph von Neumann entropy, b) the average data log-likelihood and c) the overall code-length. Fig. 1 indi-cates that the von Neumann entropy of the weighted directed supergraph increases steadily with iteration number. Moreover, the MCI group (EMCI and LMCI) have a greater von Neumann entropy than the NC group (NC and NC2). This implies that there is a more active functional connectivity between different
ROIs in the MCI group. Similarly, the curves of the average of the log-likelihood show a steady increase with iteration num-ber. The overall code-length obtained by Eq. 16 is reduced effectively using developed EM algorithm as illustrated in Fig.
1(c). Together, these preliminary results suggest that the pro-posed framework is capable of achieving a rapid convergence for weighted directed supergraph learning.
5.2. Classification in fMRI dataset
Our second aim is to evaluate the effectiveness of our weighted
directed supergraph model for classifying out-of-sample sub-jects. The class-label assigned to the out-of-sample subjects is governed by the class supergraph which gives the maximum a posteriori probability computed by Eq. 11. For the fMRI dataset, we aim to 1) classify subjects according to one of the four de-velopmental groups, 2) distinguish between samples belonging to the MCI group from those belonging to the NC group, and 3) distinguish between subjects of different developmental degree
of the MCI group. In addition, we aim to determine which of the transfer entropy estimators, i.e., Gaussian, kernel, and KSG estimation, give the best results in the multi-class classification task. To provide some quantitative results for multi-class classi-fication, we measure the fractions of true positive, true negative, false positive, and false negative, i.e. TP, TN, FP, and FN re-spectively. We have also employed the following two measures
of precision and recall (Sokolova and Lapalme, 2009), namely micro-F1 and macro-F1:
micro−F1= 2∗recisionµ∗recallµ
precisionµ+recallµ , macro−F1= 2∗recisionM∗recallM
precisionM+recallM , where precisionµ= Pl i=1T Pi Pl i=1(T Pi+FPi) , recallµ= Pl i=1T Pi Pl i=1(T Pi+FNi) , precisionM= Pl i=1 T Pi T Pi+FPi l , recallM= Pl i=1 T Pi T Pi+FNi l .
Herelis the total number of categories or classes andiis the measured index corresponding to the category, e.g.,T Pi repre-sents the true positive count of thei-th class. The higher these index value, the better the performance of distinguishing the different degree of disease severity. For the different methods
studied, the average micro-F1, macro-F1, and their standard error computed over 5 trials of 5-fold cross validation, resulting from classifying subjects in fMRI dataset, are shown in Tab. 1. The highest metric value is shown in bold. Tab. 1 shows that the newly developed method outperforms the previous approach based on transfer entropy component analysis (TECA) for all estimators of transfer entropy. It should be pointed out that the models based on KSG estimation outperform those based on Gaussian or kernel estimations. There are several possible explanations for this result. Firstly, Gaussian estimation is lim-ited by the assumption of linear interactions between variables. Unfortunately, this assumption fails to capture fMRI time-series data. Secondly, although kernel estimation has can capture non-linear relationships, it is still sensitive to the parameter choice forrin Eq. 7. KSG estimation, on the other hand, eradicates these limitations and thus achieves significant improvements in classification performance.
For binary classification we employed the following five indices (Sokolova and Lapalme, 2009): accuracy, sensitivity, specificity, area under the receiver operating characteristic curve (AUC), and F1-score, which are defined as follows:
Accuracy= T P+T N T P+FN+FP+T N, S ensitivity= T P T P+FN, S peci f icity= T N FP+T N, AUC= 1 2 T P T P+FN + T N T N+FP , F1−score= 2∗T P 2∗T P+FN+FP.
Here accuracy measures the classification rate which gives the fraction of correct samples over all classes and subjects, and the sensitivity and specificity indicate the proportions of positive samples and negative samples correctly classified, respectively. The F1-score denotes the relations between positive labels of
ACCEPTED MANUSCRIPT
A
CCE
P
T
E
D
M
A
N
U
S
CRIP
T
8NC
NC2
EMCI
LMCI
-2 4.2 0 5 10 15 20 iteration 0.65 0.7 0.75 0.8 0.85 0.9approximate von Neumann entropy
(a) complexity of weighted directed supergraph
0 5 10 15 20 iteration -3.6 -3.4 -3.2 -3 -2.8 -2.6 -2.4 -2.2 -2 ave ra ge lo g-l ike lih oo d ove ra ll co de -le ng th
(b) code-length of observed graphs
ave ra ge lo g-l ike lih oo d 0 5 10 15 20 iteration 3 3.2 3.4 3.6 3.8 4 4.2 ove ra ll co de -le ng th (c) overall code-length
Fig. 1: Convergence of the proposed framework
Table 2: Performance of binary classification for different methods based on KSG estimator
Method Accuracy Sensitivity Specificity AUC F1-score
LMCI vs. EMCI TECA[KSG] 0.7333±0.0211 0.9158±0.0343 0.3±0.0523 0.6079±0.0229 0.8284±0.0159 Ours[KSG] 0.7815±0.0606 0.8±0.0546 0.7375±0.0815 0.7688±0.0659 0.837±0.047 NC vs. MCI TECA[KSG] 0.8526±0.019 0.8433±0.0091 0.863±0.0361 0.8531±0.0198 0.8578±0.0164 Ours[KSG] 0.8596±0.0277 0.763±0.0442 0.9467±0.0217 0.8548±0.0284 0.8767±0.0231 NC vs. EMCI TECA[KSG] 0.8265±0.216 0.7913±0.0415 0.8423±0.0325 0.8611±0.0148 0.8238±0.0324 Ours[KSG] 0.8444±0.0176 0.8203±0.0221 0.8856±0.0147 0.8641±0.0324 0.8561±0.0411
subjects and those given by a classifier.Tab. 2 gives the values of the measures together with their standard error. These were obtained with 5 trials of 5-fold cross validation, in two different
binary classification tasks, i.e., LMCI vs. EMCI group, NC vs. MCI group, and NC vs. EMCI group. Results are shown for our novel transfer entropy method and TECA, both based on KSG estimation. For the LMCI vs. EMCI classification task, our proposed model performs better than the alternative method on all the metrics except for the sensitivity. This result may be explained by the fact that the TECA method tends to classify the out-of-sample subjects into the LMCI category. In other words, the TECA method is unable to sidestep the difficulty of the
imbalance between samples of the two groups. The NC vs. MCI classification is consistent with the previous work published in (Wu et al., 2018). Regarding the NC vs. EMCI experiment, our proposed method is capable of achieving better performance despite of highly imbalanced samples.
These experimental results confirm the effectiveness of the
proposed method and reveal that our method outperforms al-ternative methods in both multi-class classification and binary classification tasks for fMRI dataset.
6. Conclusion
In this paper, we have developed a weighted directed super-graph based on the von Neumann entropy of a directed super-graph. We have combined it with transfer entropy to infer a weighted directed network from fMRI time-series data. One of the more
significant findings to emerge from this study is that the pro-posed model can effectively improve the classification accuracy
for both multi-class classification and binary classification. The second major finding is that our work offers some important
insights into understanding the use of transfer entropy with different estimators to measure asymmetric information flow
between time-series variables. Further research should be done to investigate the effect of the proposed framework in larger and
more complex datasets.
Acknowledgment
This work is supported by the Research Funds of State Grid Shaanxi Electric Power Company and State Grid Shaanxi Infor-mation and Telecommunication Company.
References
Anand, K., Bianconi, G., Severini, S., 2011. Shannon and von neumann entropy of random networks with heterogeneous expected degree. Physical Review E 83, 036109.
Bridle, J.S., 1990. Training stochastic model recognition algorithms as net-works can lead to maximum mutual information estimation of parameters, in: Advances in neural information processing systems, pp. 211–217. Chen, X., Zhang, H., Gao, Y., Wee, C.Y., Li, G., Shen, D., Initiative, A.D.N.,
2016. High-order resting-state functional connectivity network for mci classification. Human brain mapping 37, 3282–3296.
Chen, X., Zhang, H., Zhang, L., Shen, C., Lee, S.w., Shen, D., 2017. Extraction of dynamic functional connectivity from brain grey matter and white matter for mci classification. Human brain mapping 38, 5019–5034.
A
CCE
P
T
E
D
M
A
N
U
S
CRIP
T
9Cover, T.M., Thomas, J.A., 2012. Elements of information theory. John Wiley & Sons.
Figueiredo, M.A.T., Jain, A.K., 2002. Unsupervised learning of finite mixture models. IEEE Transactions on pattern analysis and machine intelligence 24, 381–396.
Frenzel, S., Pompe, B., 2007. Partial mutual information for coupling analysis of multivariate time series. Physical review letters 99, 204101.
Gold, S., Rangarajan, A., 1996. A graduated assignment algorithm for graph matching. IEEE Transactions on pattern analysis and machine intelligence 18, 377–388.
Granger, C.W., 1969. Investigating causal relations by econometric models and cross-spectral methods. Econometrica: Journal of the Econometric Society , 424–438.
Gr¨unwald, P.D., Myung, I.J., Pitt, M.A., 2005. Advances in minimum description length: Theory and applications. MIT press.
Han, L., Escolano, F., Hancock, E.R., Wilson, R.C., 2012. Graph characteriza-tions from von neumann entropy. Pattern Recognition Letters 33, 1958–1967. Hinrichs, H., Heinze, H., Schoenfeld, M., 2006. Causal visual interactions as revealed by an information theoretic measure and fmri. NeuroImage 31, 1051–1060.
Jie, B., Zhang, D., Gao, W., Wang, Q., Wee, C.Y., Shen, D., 2014. Integra-tion of network topological and connectivity properties for neuroimaging classification. IEEE transactions on biomedical engineering 61, 576–589. Jorma, R., 1998. Stochastic complexity in statistical inquiry. volume 15. World
scientific.
Khazaee, A., Ebrahimzadeh, A., Babajani-Feremi, A., Initiative, A.D.N., et al., 2017. Classification of patients with mci and ad from healthy controls using directed graph measures of resting-state fmri. Behavioural brain research 322, 339–350.
Kraskov, A., 2004. Synchronization and Interdependence Maesures and their Applications to the Electroencephalogram of Epilepsy Patients and Clustering of Data. Ph.D. thesis. Universit¨at Wuppertal, Fakult¨at f¨ur Mathematik und Naturwissenschaften .
Kraskov, A., St¨ogbauer, H., Grassberger, P., 2004. Estimating mutual informa-tion. Physical review E 69, 066138.
Lawrence, I., Lin, K., 1989. A concordance correlation coefficient to evaluate
reproducibility. Biometrics , 255–268.
Lizier, J.T., 2014. Measuring the dynamics of information processing on a local scale in time and space, in: Directed information measures in neuroscience. Springer, pp. 161–193.
Luo, B., Hancock, E.R., 2001. Structural graph matching using the em algorithm and singular value decomposition. IEEE Transactions on Pattern Analysis and Machine Intelligence 23, 1120–1136.
Luo, B., Wilson, R.C., Hancock, E.R., 2006. A spectral approach to learning structural variations in graphs. Pattern Recognition 39, 1188–1198. Martin, T., Ball, B., Newman, M.E., 2016. Structural inference for uncertain
networks. Physical Review E 93, 012306.
Schreiber, T., 2000. Measuring information transfer. Physical review letters 85, 461.
Shannon, C.E., 1948. A mathematical theory of communication. Bell system technical journal 27, 379–423.
Sokolova, M., Lapalme, G., 2009. A systematic analysis of performance mea-sures for classification tasks. Information Processing & Management 45, 427–437.
Staniek, M., Lehnertz, K., 2008. Symbolic transfer entropy. Physical Review Letters 100, 158101.
Torsello, A., Hancock, E.R., 2006. Learning shape-classes using a mixture of tree-unions. IEEE Transactions on Pattern Analysis and Machine Intelligence 28, 954–967.
Vicente, R., Wibral, M., Lindner, M., Pipa, G., 2011. Transfer entropya
model-free measure of effective connectivity for the neurosciences. Journal of
computational neuroscience 30, 45–67.
Wibral, M., Rahm, B., Rieder, M., Lindner, M., Vicente, R., Kaiser, J., 2011. Transfer entropy in magnetoencephalographic data: quantifying information flow in cortical and cerebellar networks. Progress in biophysics and molecular biology 105, 80–97.
Wilson, R., Hancock, E., et al., 2015. Generative graph prototypes from informa-tion theory. IEEE Transacinforma-tions on Pattern Analysis & Machine Intelligence , 1–1.
Wu, M., Zeng, Y., Zhang, Z., Hong, H., Xu, Z., Cui, L., Bai, L., Hancock, E.R., 2018. Directed network analysis using transfer entropy component analysis, in: Joint IAPR International Workshops on Statistical Techniques in Pattern
Recognition (SPR) and Structural and Syntactic Pattern Recognition (SSPR), Springer. pp. 491–500.
Ye, C., Wilson, R.C., Comin, C.H., Costa, L.d.F., Hancock, E.R., 2014. Ap-proximate von neumann entropy for directed graphs. Physical Review E 89, 052804.
Zhang, H., Chen, X., Shi, F., Li, G., Kim, M., Giannakopoulos, P., Haller, S., Shen, D., 2016. Topographical information-based high-order functional connectivity and its application in abnormality detection for mild cognitive impairment. Journal of Alzheimer’s Disease 54, 1095–1112.