P
ORTRAIT OF
I
NFORMATION
T
ECHNOLOGY
L
EADERS IN
H
IGHER
E
DUCATION
2008
S
TUDY
OF THE
H
IGHER
E
DUCATION
C
HIEF
I
NFORMATION
O
FFICER
R
OLES AND
E
FFECTIVENESS
Wayne A. Brown, Ph.D. © April 2008
2
Authors note: This research is an ongoing study of the chief information officer (CIO) in higher education. The survey has been conducted four times since 2003. The study provides an unprecedented picture of the people in the critical CIO position. The results will be useful for other CIOs, those who aspire to that role, those anticipating the future hiring of a CIO, and those who work alongside the CIO every day. I’d like to thank the 565 respondents in this study and the participants in previous studies for taking the time to complete the surveys and helping contribute to the CIO body of knowledge.
The survey data collection format is unique. The first survey gathers from the CIO information and opinions on role importance and effectiveness of the CIO. A
second survey is sent to the responding CIO’s institution management team (IMT). The IMT is the president and the vice presidents of the institution. That survey seeks
information about CIO role importance and effectiveness. Additionally, this second survey gathers information on four CIO attributes: technical knowledge, business knowledge, political savvy, and communication skills. This study is based on Dr. Herb Smaltz’s 1999 doctoral healthcare CIO research.
I would like to thank Johnson County Community College for its support of the survey; the League for Innovation for its support in publishing the results of the survey; and Leslie Quillen and Pat Lang for their help during data collection.
3
T
ECHNOLOGYL
EADERSAs technology has secured a clear and identifiable hold in the business world, the technology leader role has evolved, and has, likewise, become a recognizable profession amid higher education leadership positions. As the role has evolved since it emerged sometime during the 1980s, so have the requirements for the person holding the lead technology position. Being technologically savvy or willing to assume the responsibility is not enough of an attribute for an individual today. Higher education institutions want—and need—more from their chief information officers (CIOs).
The beginnings of a CIO career path have emerged. Certain attributes may be required for the CIO of the future: a general expectation for an academic degree and major, work experience that may include a background in a higher education technology department, and a customary position within the organizational chart.
In addition to the clear-cut attributes, there may be requisite conditions and attributes for CIO success that remain murky, such as needing to report to the chief executive officer, being a part of the management team, and perhaps even holding the title of the senior technology executive, CIO.
Continuing to study today’s CIO, the conditions that have an impact on his or her effectiveness, and the education and career path that led to the CIO role will continue to be important if the information technology (IT) department and one of the newest members of the higher education institution leadership team is to be successful.
The CIOs who responded to the survey worked in community and technical colleges, liberal arts colleges, major research universities, service academies, for-profit institutions, and Ivy League institutions in the United States. The second survey was sent to the institution management team (IMT) at each of the 435 responding CIOs’ organizations. One hundred thirty IMT members from 109 unique institutions
responded to the second survey. Research collecting higher education CIO roles and effectiveness data has been held on four separate occasions since 2003-04.
CIO
P
ROFILE:
T
ITLE,
R
EPORTING,
ANDM
ANAGEMENTT
EAMM
EMBERSHIPTitle
Since the position’s inception, the technology leader has held various titles, such as chief technology officer, chief information officer, technology director, and vice president. The title may reflect the technology leader’s overall position within the institution, or it may be an assimilation of the role within a particular organization.
4
In previous studies, director and CIO were reported to be the most common titles. However, in the 2007 study, the title ―CIO‖ was reported by the single largest percentage of the respondents. That same result was repeated again in 2008 with 38 percent of the respondents claiming the chief information officer title (Table 1). Perhaps this title of choice for the senior technology executive has finally caught on and may well become the established standard. Certainly in other cross-industry surveys, CIO appears to be the most commonly used title. For instance, CIO was the most prevalent title, 35 percent, in the 2008 Public CIO survey (Newcombe, 2008). Likewise, it was the dominant designation, at 55 percent, in the annual CIO magazine survey (Koch, 2007a).
Table 1. Title
Title Number Percentage
Chief information officer (CIO) 166 38.16
Director 137 31.49
Vice president 62 14.25
Associate/assistant vice president 22 5.05 Chief technology officer (CTO) 20 4.59
Dean 12 2.75
Other (associate, head) 10 2.22
Manager 6 1.37
Total 435 100.0
Reporting Structure
To whom the CIO reports is another question that can differ from institution to institution. This reporting structure question may be viewed as a reflection of the importance an organization places on technology. Indeed, the argument can be made that in order for a CIO to be effective, he or she must report to the chief executive officer (CEO). However, based on the three previous surveys, from the IMT’s perspective, the reporting level did not have an impact on the CIO’s effectiveness. In contrast, the 2008 survey reflected the opposite: the IMT perception was that CIOs who reported to the CEO were more effective than those who did not. However, the effectiveness difference between CIOs reporting to the CEO and those who did not was not
statistically significant. In other words, reporting to the CEO did not have an impact on the CIO’s perceived effectiveness. In this survey, 97 percent of the CIO respondents report within one level of the CEO (Chart 1). This percentage is consistent with previous surveys.
A new reporting configuration has emerged. A structure having the CIO reporting to more than one person is a new phenomenon. While joint reporting was a relatively small percentage, 1.37 percent in this survey, it is interesting to note this reporting configuration is present for the first time in this study. This configuration should spark a debate about how effective an individual can be when he or she is required to report to more than one person. This structure may lead to concerns of conflicting objectives. The two people the CIO reports to may have very different agendas for technology’s use in the institution. An argument could be made that reporting directly to the CEO is more
5
effective because the CIO and the IT department will be focused on the institution and not any one branch of the institution.
Chart 1. Number of Reporting Levels the CIO is From the CEO
While reporting to the CEO in this study was not the reporting configuration for the majority of the CIOs (39 percent), it was the single highest percentage. The
breakdown of titles for the CIOs’ supervisors is depicted in Chart 2. At 23 percent of the respondents, the chief financial officer (CFO) was a distant second to the CEO.
Chart 2. Title of the CIO’s Supervisor
39
58
3
Reporting Levels from CEO
Zero, direct CEO report - 39% One level from CEO - 58% Two or more - 3%
0 50 100 150 200
Chief executive officer Chief financial officer Chief academic officer Administrative VP Executive VP Assorted VPs Others Joint reporting Percentage Number
6
Management Team Membership
Another perceived indication of CIO value (and therefore the IT department value) and the CIO’s ability to be effective is whether or not he or she is an IMT member. This survey revealed that slightly more than half (58 percent) of CIOs were IMT members, consistent with the overall study. While it appears the CIOs are not losing ground as members of the IMT, they are not making gains in membership either.
This percentage is especially important considering the fact that in the previous surveys, IMT membership did have an impact on perceived CIO effectiveness. In 2008, the management teams’ perception was that the CIOs who were members of the IMT were more effective. However, just as with CEO reporting structure, the difference in effectiveness between those CIOs who were IMT members and those who were not was not statistically significant.
Chart 3. Member of the Institution Management Team
T
ENUREAll of the surveys in this study have consistently revealed that the higher education CIO spends more time in his or her position than other members of the management team. As a result, it can safely be said the CIO title is not an industry tongue-in-cheek acronym for ―career is over.‖ What is more, CIOs are staying in their positions longer than the anecdotal three years alluded to by technology leadership trade magazines. In fact, CIO tenure is more than twice the amount of time referenced in anecdotal information. On average, the responding CIO has spent approximately six years and seven months (79 months) in his or her current position (Table 2).
CIO is an IMT Member
Yes - 58% No - 42%
7
Moreover, when comparing the CIO to his or her management team peers for time in position, the CIO has been in his or her position longer. This trend has been consistent in the four iterations of this survey. The CIOs from the responding IMT institutions had spent an average of 82 months in their current position, more than a year longer in comparison to the IMT respondents, who had spent an average of 68 months in their current position. These results further strengthen the argument that CIOs are not changing jobs on a regular basis. On the contrary, the CIO may stay in his/her position longer than the other management team executives.
Table 2. Time in Position for CIOs
Variable Count Mean
Months 435 79.07
CIO
B
ACKGROUNDEducation Level
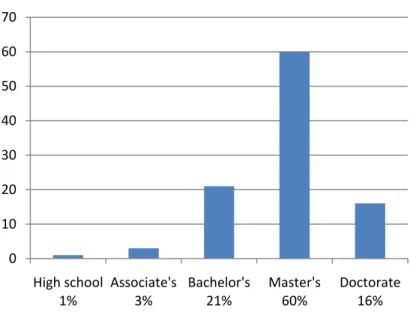
As with any higher education career field, a CIO’s education level is a consideration in career placement and advancement. Unfortunately, a definitive
educational level for CIOs is not resolved through this research. However, it is obvious that an advanced degree is at least a differentiator for higher education CIOs. As Chart 4 depicts, the combination of master’s and doctorate degrees accounted for 76 percent of responding CIOs. The percentage and combination of advanced degrees has changed from previous surveys (Brown, 2006a, 2006b, 2008). However, a consistent factor with a significant majority of CIOs in higher education is that they possess an advanced degree.
Chart 4. Education Level of Higher Education CIOs in 2008
0 10 20 30 40 50 60 70 High school 1% Associate's 3% Bachelor's 21% Master's 60% Doctorate 16%
2008 CIO respondents
2008 CIO respondents8
Education – Field of Study
Collecting data about the major field of study among degree-holding CIOs was new for the 2007 survey. During presentations of this earlier research, individuals interested in becoming CIOs wanted to learn about the current CIO education path. For the 2008 survey, more than 55 percent of the respondents reported having a degree major in technology, business, education, administration, or management. Additionally, a significant percentage of the respondents listed a wide variety of other majors, including dance and music, law, and science. Based on the survey data, there did not appear to be a correlation between effectiveness and time in position, time in technology positions, or degree major.
An anecdotal review of technology leader job descriptions and advertisements posted online for the first four months of 2008 indicated there was no clear-cut answer to specific degree major or education level requirements. In fact, comparing the 24 advertisements that were reviewed, the degree major was evenly split between requiring a technical or management major and no major specified at all.
Table 3. CIO Degree Majors
Degree Number Percent
Other (dance, music, law, biology,
genetics, physics, theology, etc.) 122 28.27 Technology (computer science,
information systems, and information
technology) 105 24.13 Business administration 93 21.37 Engineering 21 4.82 Mathematics 20 4.59 Education 16 3.67 Library 15 3.44 Administration (public, industrial, etc.) 11 2.52 Education admin./education technology 10 2.29 Psychology 6 1.37 Management 6 1.37 Human resources 5 1.14 Accounting 5 1.14 Total 435 100
Gender
It appears women are more prominently represented in technology leadership roles in higher education than in other industries. The female respondents in this survey
accounted for 26 percent of the total. While this percentage does not make up half of the total CIOs, it is higher compared to the results of other CIO studies and studies on gender in executive ranks. For example, the annual CIO magazine study reported in a
cross-9
industry survey the percentage of female CIO respondents was 15 percent (Koch, 2007a).
Public CIO reported in 2008 that 20 percent of the respondents in its annual survey were women (Newcombe, 2008).
Chart 5. Gender
Age
As has been noted in other areas of higher education administration, there is a decided ―graying‖ of the population (Harris, 2005; Jaschik, 2007). More than half of all the respondents in this survey were between 51 and 70 years old.
Chart 6. Age
74
26
Technology leaders' gender
Male 74% Female 26% Age 21-25 26-30 31-35 36-40 41-45 46-50 51-55 56-60 61-65 66-70 71 and older 0 20 40 60 80 100 2 6 9 36 64 83 94 84 45 12 0
CIOs by age
CIOs by age10
Retirement
Respondents were also queried about projected retirement plans from their senior IT executive position. Chart 6 breaks down the anticipated retirement for the CIO respondents. A significant retirement exodus is projected with 21 percent planning to leave the workforce during the next one to five years. Moreover, another 26 percent of the respondents plan to retire in the next six to ten years. With almost half of the higher-education technology leaders planning to retire in the next ten years, a potential vacuum could be created. This information may be good news for those who aspire to the senior IT roles. Conversely, this potential mass departure emphasizes the continuing need to groom successors for this critical position. Fortunately, there are programs such as the EDUCAUSE leadership courses, the IT Leadership Program at Santa Clara University, and the General Services Administration CIO program, where new and aspiring CIOs can go for applicable education and training.
Chart 7. Retirement Plans
Career Background
The 2008 survey gathered information about the CIOs’ career background, distinguishing four general areas:
IT area within higher education;
Areas other than IT within higher education;
IT area outside higher education; and
Areas other than IT outside higher education.
In addition to collecting the general career areas, length of time in those areas was also gathered. The purpose in collecting this data is to provide the CIO, potential CIO, and
21% 26%
22%
17%
14%
CIO Retirement Projection
1-5 years - 21%
6-10 years - 26%
11-15 years - 22%
16-20 years - 17%
11
CIO hiring authorities with a general career-environment sketch of the average current CIO.
As in the 2007 study, this survey found the ―IT area within higher education‖ category dominated among the different career configurations. Current CIOs averaged more than thirteen years in an IT area inside higher education. The next closest amount of work experience for 2008 CIOs was an average of six years in a non-IT area within higher education. The average CIO has spent most of his or her career in higher education technology departments; however, CIO experience is not limited to technology. CIOs have also spent several years working in other higher education nontechnology departments.
Chart 8. Average Time (Years) in Field and Industry
T
ECHNOLOGYD
EPARTMENTC
ONFIGURATION ANDG
OVERNANCEOutsourcing Technology
While outsourcing seems to be a question the technology industry continues to wrestle with, the higher education institutions participating in this study during the past five years have been consistent. Total outsourcing of the IT department has been low, 1.1 percent to 4 percent, in the four previous surveys. That number continued to be low for this survey; slightly over 1 percent reported complete outsourcing.
In the 2008 survey, more than 55 percent of higher education institutions exclusively retained the IT function, and more than 42 percent had selectively outsourced some of their IT functions.
0.00 2.00 4.00 6.00 8.00 10.00 12.00 14.00 IT in higher ed Non-IT in higher ed IT outside higher ed Non-IT outside higher ed 13.4 yrs 5.52 4.15 3.62
Work Experience Areas
12
Chart 9. Outsourcing All, Partial, or None of the IT Functions
Centralized and Decentralized
The centralization of the IT department has gone through periods from highly centralized to decentralized, and back again. Through the course of this study, department centralization is prevalent according to responding CIOs. In 2008, the respondents continued to report a heavy centralization of the department. As depicted in Chart 9, 84 percent of the respondents reported their IT department was either primarily or completely centralized.
Chart 10. Centralization of the IT Department
0 50 100 150 200 250 300 Completely outsourced, 5 Selective or partial outsourcing, 187
Fully retained in house, 242
Outsourcing
Outsourcing 4% 8% 5% 44% 40%IT Centralization
Decentralized - 4% Partially decentralized - 8% Evenly centralized/ decentralized - 5% Primarily centralized - 44% Completely centralized - 40%13
CIO
E
FFECTIVENESSCIO Roles
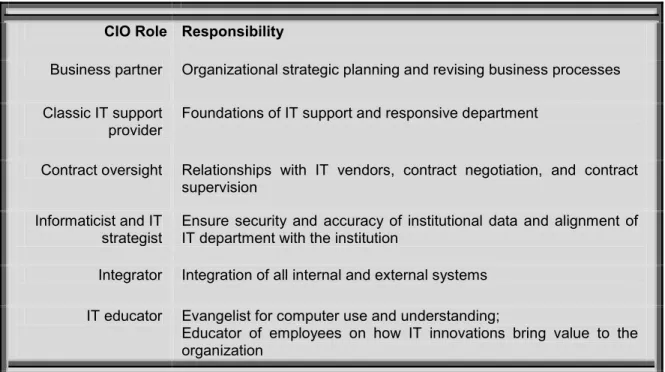
This study is distinct from other CIO surveys in that it not only examines the demographics of the higher education CIO, but also gathers a perception of the CIO’s importance and effectiveness operating in six different, fundamental technology leadership roles. The roles and responsibilities are listed in Table 4.
Table 4. CIO Roles
CIO Role Responsibility
Business partner Organizational strategic planning and revising business processes Classic IT support
provider Foundations of IT support and responsive department
Contract oversight Relationships with IT vendors, contract negotiation, and contract supervision
Informaticist and IT
strategist Ensure security and accuracy of institutional data and alignment of IT department with the institution Integrator Integration of all internal and external systems
IT educator Evangelist for computer use and understanding;
Educator of employees on how IT innovations bring value to the organization
The CIO and IMT surveys both provided a perspective that was used to determine the importance placed on the six roles by the respondents, as well as the perceived effectiveness of the CIO operating in those six roles.
The survey also included an evaluation to determine if the CIO’s membership on the IMT had an impact on the technology leader’s effectiveness as perceived by the IMT. There was a difference in the perceived effectiveness between those on the IMT and those who were not. However, the difference was not statistically significant. Prior surveys revealed there was a correlation between IMT membership and perceived effectiveness. It can be argued the CIO should be a part of the IMT to provide
technology expertise and to look for opportunities to apply technology solutions to solve institution problems.
14
CIO Attributes
Four attributes are frequently cited in CIO literature as being important to the CIO who will be effective. The attributes (described in Table 5) are communication skills, IT knowledge, political savvy, and strategic business knowledge. Furthermore, through the course of this study, these attributes have consistently had an impact on perceived CIO effectiveness. The IMT respondents were asked a series of questions to determine their perception of the CIO’s effectiveness in these attributes. Overall, the CIOs were perceived as effective on a scale of one (not effective at all) to five (extremely effective) in the use of these attributes in their CIO roles.
Additionally, results were reviewed to determine whether these four attributes had an impact on perceived CIO effectiveness. As in the three previous surveys, there was a correlation between the attributes and perceived CIO effectiveness. The results showed these four attributes had an impact on whether or not the IMT perceived the CIO as effective.
Communication skills could be the number one predictor of CIO success. CIOs are expected to communicate with all levels of the institution, from the person
performing technical work at the desktop computer to the board member inquiring about how a certain technology will benefit the institution. If the CIO can’t communicate well, he or she is not going to be viewed as effective.
The amount of technical knowledge the CIO needs to have is going to vary based on the organization’s size. If the organization is small and the CIO is required to play a hands-on technical role, then the level of technical knowledge is going to be higher than the CIO who leads a technology organization staffed by hundreds of people. Regardless of the depth of the technical role, all CIOs must possess at least a
rudimentary understanding of technology and how it can be used to achieve institutional goals.
The political savvy attribute may be the hardest to explain and the most difficult to measure in a CIO. For this study, political savvy refers to the CIO’s ability to
collaborate with most people, assess confrontational situations, and navigate through those situations without ruining careers or relationships.
Strategic business knowledge refers to the CIO's knowledge of how the higher education institution functions. Fortunately, the CIO can be in one of the best positions, other than the CEO, to understand how the different parts of the organization operate and integrate with one another. Returning to the first attribute, communication skills, the CIO has to understand the business of higher education if he or she going to be able to successfully communicate about it.
15
Table 5. CIO Attributes
Attribute Examples
Fluent in business language
Fluent in higher education language
Able to communicate and present information without technical terms IT knowledge Understands how IT is applied in the organization
Able to use current IT resources to fill institutional requirements Uses new technology for the institution
Familiar with the acquisition of IT
Political savvy Able to assess situations that might be confrontational and act tactfully Able to work well with a majority of people
Strategic business
knowledge Knowledge of institutional offerings Understanding of market and business processes Familiar with the competition
Role Ranking Results: The CIO
The importance and effectiveness scale was ranked based on responses (Table 6). For importance, the responding CIOs did not rate any of the six
different roles above a ―4.‖ Five of the six CIO roles were rated in the ―3‖ range. CIOs ranked only one of the roles, the Classic IT Support Provider, as very important and did not rank any role as critically important.
In effectiveness, the CIOs hovered in the middle ―3‖ range in all six roles. Based on the results, the CIO does not consider himself or herself to be working above a satisfactory effectiveness level for any of the six roles in which he or she operates.
The average of the 435 CIO responses to the questions determining role
importance and effectiveness are shown in Table 7. Similar to prior study results, in this survey, CIOs ranked the Classic IT role—putting computers on desks and providing a responsive technology department—as the most important role. It is in the classic IT role, as well as contract oversight, where CIOs felt they were the most effective.
Table 6. CIO Role Importance and Effectiveness
Communication skills SImportanc 1 = no importance 2 = least important 3 = important 4 = very important 5 = critically important
1 = expectations not met 2 = could be better 3 = satisfactory 4 = excellent 5 = outstanding
16
Table 7. CIO Role Importance and Effectiveness as Perceived by all Responding CIOs
Role Importance Effectiveness
Classic IT support provider 4.00 3.74 (2nd)
Informaticist 3.84 3.43 (4th) Integrator 3.74 3.56 (3rd) Contract oversight 3.69 3.77 (1st) Business partner 3.54 3.31 (5th) IT educator 3.14 3.10 (6th)
As in the prior studies, the educator role—where the CIO operates as an evangelist for technology and is responsible for educating the organization on technology—was considered the least important, and, likewise, the role where CIOs viewed themselves as the least effective. There may be an alignment between CIOs and IMTs, considering the business partner and IT educator were ranked fifth and sixth in both importance and in effectiveness. It may be unfortunate that these two critical roles are not considered important, but alignment is occurring because, as reflected in the effectiveness ratings, the two roles are not receiving a great deal of attention, either. In other words, the two roles were considered the least important of the six roles and they were also the two roles where the CIOs were the least effective.
Arguably, the business partner role is the activity where CIOs could have the greatest impact as the technology leader and the role where they want to operate
(Bace, 2005; Koch, 2007b; Raskino & Lopez, 2006). Another role that holds a great deal of influence is the IT educator role, the activity where the CIO can educate the rest of the IMT about technology. Educating the management team will enable them to understand the capability and limitations of technology; the lack of technology understanding by executives is often bemoaned by CIOs and the CIO literature (Ward & Hawkins, 2003).
Ranking Results: IMT and CIO Comparison
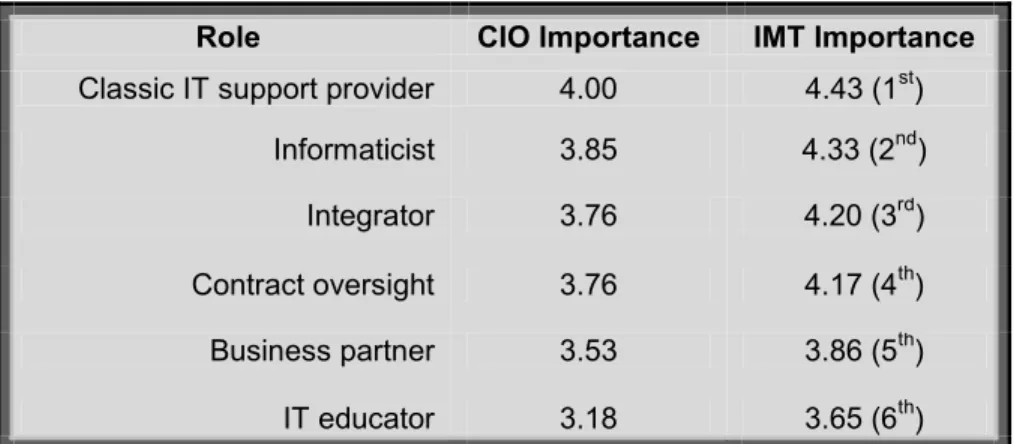
The aggregate role importance and effectiveness results for the 130 IMT members and their CIOs are depicted in Table 8 and 9, respectively. Both the IMTs and CIOs ranked the importance for the six CIO roles in the same order. This alignment is positive in that the CIOs and IMTs are obviously on the same page for prioritization. As in previous versions of the survey, the Classic IT Support Provider and IT Educator importance were again listed as first and last, respectively.
Unlike role importance, CIOs and IMTs were not in agreement on perceived role effectiveness; the two groups disagreed about the most effective role for the CIO. The CIOs chose contract oversight, while the IMT chose informaticist. For the two
least effective roles, the IMT and CIOs were once again on the same page and chose the business partner and IT educator.
17
As with the entire group of CIO respondents, both the IMTs and their CIOs agreed the business partner role was fifth in order of importance and fifth in order of effectiveness. The IMTs and CIOs also agreed the IT educator was last in order of importance and last in order of effectiveness. These results seem to indicate the two groups have their priorities in the same order and agree on how the CIO is performing. As mentioned earlier, there is a disconnect between the value the CIO could deliver operating in these two roles and the importance placed on them by the IMTs and their CIOs.
Table 8. Role Importance Perceived by Responding CIOs and Their IMTs
Role CIO Importance IMT Importance
Classic IT support provider 4.00 4.43 (1st) Informaticist 3.85 4.33 (2nd) Integrator 3.76 4.20 (3rd) Contract oversight 3.76 4.17 (4th) Business partner 3.53 3.86 (5th) IT educator 3.18 3.65 (6th)
Table 9. CIO Role Effectiveness as Perceived by Responding CIOs and Their IMTs
Role CIO Effectiveness IMT Effectiveness
Contract oversight 3.75 3.97 (3rd) Classic IT support provider 3.71 3.99 (2nd) Integrator 3.56 3.75 (4th) Informaticist 3.36 4.01 (1st) Business partner 3.28 3.65 (5th) IT educator 3.10 3.52 (6th)
18
A
PPLICATION OF THES
TUDYR
ESULTSThe results of this survey are rich with information that can be useful for a number of groups, including the higher education CIO, aspiring CIOs, and the group which depends on and may be involved in the hiring of the higher education CIO – the institution management team.
These three groups and others can use the results to understand the four CIO attributes, which, when exercised, can contribute to the CIO’s effectiveness in his or her primary roles. The sharpening or acquisition of those attributes by the CIO or aspiring CIO can be important, as the attributes may impact the perception of effectiveness in the six CIO roles.
Future CIOs can use the survey results to guide their career paths to replicate that of an effective CIO. For example, the survey results reveal the majority of CIOs have spent most of their career in higher education technology and they have an advanced degree. As the aspiring CIOs plan their career paths, they can use this information to make career and education decisions. Furthermore, technology professionals working toward a leadership position can focus on acquiring business knowledge, technical knowledge, communication skills, and political savvy, which have an impact on CIO effectiveness.
Finally, the CIO hiring authority and peers can use all of this survey’s information to understand the ideal profile for effective CIOs and their commonly held attributes. They can learn about the aggregate background other CIOs have, as well as their education level and field of study. As with the other groups, the IMT can gain a better understanding about the attributes the CIO should have to be more effective. From an organizational perspective, the group can determine to whom the CIO should report and whether or not the CIO should be a management team member.
S
UMMARYAs with other industries, technology is critical to the operation of higher education institutions. The leadership of the technology department must be understood for the department to efficiently support the institution and contribute to the institution’s
success. This ongoing CIO study provides information about a number of aspects of this important position.
The four CIO attributes continue to have an impact on perceived effectiveness of the CIO operating in the six different roles. The roles where the CIO is viewed as most effective continue to be the foundation roles, such as the classic IT support provider. The least important and least effective roles continue to be the business partner and IT educator roles.
Other conditions that continue to be stable include (a) the percentage of CIOs who are IMT members and (b) CIO tenure, which is significantly longer than with IMT
counterparts.CIOs reporting to CEOs has continued to be the largest single percentage, but it is not the majority.
19
The CIOs in this survey are well-educated with a significant majority possessing an advanced degree. For the first time, the survey sought information about gender, age, and retirement. While the percentage of women in the CIO role, 26 percent, is higher than in other studies, it is far from reflective of the wider U.S. population. It is no surprise the CIO respondents in this survey mirrored the rest of the U.S. population in age. This survey forecasts a CIO retirement wave that will see almost 50 percent of the higher education CIOs leave the workforce during the next ten years.
This research is the fourth in a series of surveys studying CIOs in higher education. A summary of the results across all four surveys is contained in Table 10 (Brown, 2006a, 2006b, 2008). The survey will continue to be conducted annually in the future. As the CIO profession matures, career paths and minimum position requirements are solidifying. This research and the results will provide those in the CIO position, those who want to move into the position, and those hiring their next CIO with helpful information about the attributes and conditions that will lead to success for the higher education CIO.
20
Table 10. Higher Education CIO Study Results
Result 2003-2004 2005-2006 2007 2008
Attributes have an impact
on effectiveness? Yes Yes Yes Yes
CEO reporting has an
impact on effectiveness? No No No No Percentage reporting to CEO 34% 41% 39% 39% IMT interaction/membership has an impact on effectiveness? No Yes Yes No
Percentage who are
members of the IMT 59% 66% 53% 58%
Time in position 5 years, 3 months 6 years, 5 months 7 years, 5 months
Average time in higher
education IT Not measured Not measured 15.70 years 13.45 years
Advanced degree 82% 68% 75% 76%
Gender Not measured Not measured Not measured 26% female,
74% male 6 years, 7 months
21
References
Bace, J. (2005). Proven Practices of Midsize CIOs. Paper presented at the Gartner Symposium, San Francisco, CA.
Brown, W. (2006a). Chief Information Officer Effectiveness in Higher Education.
EDUCAUSE Quarterly, 29(1).
Brown, W. (2006b). The Two-Year College and the Chief Information Officer.
Leadership Abstracts, 19(5).
Brown, W. (2008). Higher Education CIOs: Are they effective? Retrieved April 28, 2008, from http://www.govtech.com/pcio/articles/303908.
Harris, M. (2005, May 15-19). The Higher Education Scenario: Getting Value from IT.
Paper presented at the Gartner Symposium, San Francisco.
Jaschik, S. (2007, Feb. 12). The Graying of the Presidency. Inside Higher Ed. Koch, C. (2007a, Jan.). State of the CIO Survey. CIO. Retrieved July 10, 2008 from Koch, C. (2007b, Jan.). State of the CIO: Beyond Execution. CIO, 62-112.
Newcombe, T. (2008, Feb. 6). The 2008 Public CIO Survey. Public CIO.
Raskino, M., & Lopez, J. (2006). How CEO Concerns in Mid-2006 Are Shaping IT Agendas. Stamford, CT: Gartner.
Ward, D., & Hawkins, B. (2003). Presidential leadership for information technology.
EDUCAUSE Review, 38(3), 36-47. http://www.cio.com/state/stateofcio.pdf.