622 | P a g e
Experimental Study and Real-Time based GPS
Applications of Big-Data Efficient Storage
Wimpy
1, Ms Seema
2, Mr. Rajiv Sharma
31
M.Tech. (CSE) Student, SBMNEC, Rohtak, Haryana
2,3Asst. Professor, Dept. of CSE, SBMNEC, Rohtak, Haryana
ABSTRACT
Increase in smart mobiles has resulted in popularity of navigation applications like navigator and maps.
These applications can possibly utilize expansive measure of information for an assortment of utilizations
that are related with course data. The nature and arrangement of the information gathered relies upon
the detecting strategy utilized, of which GPS is as of now the most prominent. Starting at now the greater
part of these applications utilize static information with current area. Be that as it may, fascinating
applications are rising with time subordinate updates empowered on the accessible Geo-spatial
information. One of them is ongoing activity checking which performs investigation of spatial and time
subordinate estimation of information. The objective of these frameworks is to give data, for example,
normal rates, volumes and densities on a given section of a roadway. There is extensive request in
industry and by transportation organizations to approach high determination condition of activity on
expressways and blood vessel streets universally. GPS applications require ongoing responsiveness and
are area delicate.
GPS information is time-variation, dynamic and expansive. Current strategies for brought together or
conveyed capacity with static information force limitations on tending to the ongoing necessity of such
applications. In this venture we investigate the requirements for genuine auspiciousness of area based
applications and develop a procedure of capacity system for the GPS application's information.
Keywords: GPS, energy storage, big data, real time.
I. INTRODUCTION
623 | P a g e
has profited gigantically from directing administrations and innovation. Likewise, there is a requirement for these applications to be more responsive i.e., the applications ought to give constant data. Be that as it may, the issue is that these applications need to typically deal with extensive measure of information from numerous sources. Henceforth better processing and capacity instruments should be investigated to empower such applications.
There is a particular enormous information arrangement, for capacity and dissemination of information for a given issue [2]. In this paper we particularly take a gander at the GPS based information and its utilization to incorporate constant information reports in regards to Geo-spatial systems from the point of view of information dispersion and capacity with the end goal that applications can be worked for continuous responsiveness.
In the majority of these applications, the information is either situated at a brought together place or is disseminated over different hubs. The application-level execution of completely circulated and concentrated information dispersal approaches with regards to movement warning frameworks are testing. Presently, there are numerous circulated stockpiling systems that are particular to applications. On account of Geo-spatial applications the greater part of the information dispersion systems depend on the one time calculation or static nature of the inquiry reaction. Stretching out such calculations to help time-delicate basic leadership is a test. The restricted time reaction as well as exact reaction is what is proposed. Consequently, a productive component that isn't just natural yet additionally compelling ought to be actualized to achieve the Geo-spatial application due dates. By and large, an inquiry in realtime is of the frame course from A to B with exceptional parameters. Thus, circulated capacity offers opportunity to parallelism thus speedup is accomplished. Keeping in mind the end goal to accomplish the constant refresh we additionally need effective systems to store, oversee and disperse information.
In this paper, we would address the issue of how to get a constant responsive answer for the clients' questions with setting to capacity system. The capacity component is basic in the calculation of course starting with one area then onto the next. The essential thought is to sort out information distributedly and dependably distinguish and relate the calculation on the information to where it is found. This takes into account misusing the simultaneous idea of the calculation and consequently adds to diminishment in time for reacting to the inquiry.
The key commitments in this work include:
Planning of a capacity system that endeavors re-dundancy, to lessen the correspondence overheads and
disappointment of hubs.
The calculation is conveyed nearer to the information to decrease the latencies and correspondence
overheads.
The information stack is adjusted over the hubs with some unwinding to guarantee better use of assets and
624 | P a g e
II.RELATED WORK
Data storage and dissemination is done in either a fully distributed manner or in a centralized manner [2]. In concentrated approach, applications rely upon the street side foundation to associate with unified area. Furthermore, the information that achieves concentrated area originates from the vehicles by means of the intermedi-ate hubs called guides [2]. A few associations have workplaces at various levels. For instance, an organization can have workplaces at the national level, state level, and city level. Information appropriation enables every office to locally deal with the information material to its zone and furthermore share with the levels above and beneath [12].
A. Centralized Data Dissemination
In this sort of information stockpiling and dispersal, the information dwells on the incorporated framework. In brought together approach, vehicles rely upon the street side framework to associate with unified area. Furthermore, the information that achieves incorporated area originates from the vehicles by means of the middle of the road hubs called guides [2].The information is questioned from this framework and figured on different hubs. With a brought together approach, vehicles depend on street side framework, either in an arranged [9], [10] or in a crafty way [11], to speak with a focal area. ESRI geodatabases are a generally new configuration. Geodatabases are databases put away in Microsoft Access (for the "individual" geodatabase), as an extraordinary accumulation of records (for the "document based" geodatabase), or higher-end applications (e.g. SQL Server, Oracle, Informix). A geodatabase stores all highlights and related tables, and in addition different documents, inside a solitary or dispersed database organize [12]. These databases manage data that is collected intermittently and generally utilized for read-just purposes like hunting down outcomes on course inquiries. The response to a given inquiry may not change with time in light of the fact that the time subordinate data isn't gathered or put away.
B. Distributed Data Dissemination
A few distinct information dissemination methods are accessible. Choosing which to utilize includes considering the necessities of your framework and in addition the advantages and confinements of every procedure [12]. Now and again, in excess of one method might be utilized to meet the framework prerequisites. The accompanying depicts every strategy:
Geodatabase replication: Geodatabase replication al-lows you to circulate information crosswise over at least two geo-databases with the end goal that alters can be made autonomously and synchronized occasionally. It has worked in safe-prepares for information misfortune, information excess, and framework insecurity. Geodatabase replication requires no less than one formed ArcSDE geodatabase [12].
im-625 | P a g e
plementing these frameworks as it improves the situation geodatabase replication [12].
Information replicating and stacking devices: Another method for circulating information includes just duplicating information starting with one geodatabase then onto the next. This procedure is valuable for two frameworks with straightforward prerequisites. For exam-ple, a fieldworker refreshes a component class and needs to duplicate that element class to the ArcSDE geodatabase in the workplace every night. This method can likewise be utilized where the information is nonversioned or where just individual or document geodatabases are included. Be that as it may, it has no worked in shields against information misfortune or information excess [12].
III. NINECELLGRID METHOD
In our approach we address the requirement of storing time-based updates on the geo-spatial data. We choose the distributed dissemination method and use the NineCellGrid method for storing data. In this method, data is distributed not based on the available storage nodes, but based on the region of area on which the computation is intended.
Design Approach and Strategies
Computation-closeness to the storage node is ensured, using Geo-spatially localized distributed data storage pattern (NineCellGrid Storage Methodology)
Data-redundancy is used to reduce communications, improve performance to respond for real-timeliness and also build in fault tolerance.
Here, the GPS data that is concerned to a location is decomposed in such a way that entire earth is mapped with a mesh/grid of cell dimension L L, where L is some fixed value (explained in the following sub-section). Each cell is representing a unique L×L area on earth as in Figure - 1.
Fig. 1. Grid on Geographic Map [1]
In this approach we propose that each cell can hold the data of 8 other cells that are present around it. That is, here, apart from its own cell’s data it stores an extra 8 cells’ data that surrounds it as shown in Figure - 2. So,
the query that is to be answered by a cell can now be answered by all the 9-cells that contain that data.
•
626 | P a g e
×Name Table
A table called Name Table (Table - I) that is indexed with row key as the ’Latitude’ and column key as the ’Longitude’ which indexes the address of the node which is responsible for that cell or region in reality of
dimensions L L. The actual region that is covered by the node is a square (not necessarily) of four vertices mentioned as [(Latitude, Longitude),( Latitude
+ L, Longitude),( Latitude, Longitude + L ),( Latitude + L, Longitude + L)].
Fig. 2. Cell N, with identity [Latitude, Longitude] in NameTable
Dimension of cell (L)
Each cell is of length L, where L is the standard units of Longitude and Latitude. Then, L sized cell is mapped to a node. Hence, each cell/region’s data is present in exactly 9 nodes and to locate those nodes in
the NameTable is just the (-L, 0, +L) combinations to the keys, hence 9 possibilities. The reason for choosing nine cell’s data within one cell is to make sure that any ’A-to-B route’ query of Euclidean distance ’L’ can
be addressed by a single cell. And this L is chosen in probabilistic manner considering the previously observed queries.
(a) Locus of B with A inside a cell (b)Best-Fit, NineCell- Grid
627 | P a g e
∼ −
Consider, all the possible locations of source A, in query "A-to-B", within a cell it would be filled square or cell. Then, the locus of point B such that B is not more than L Euclidean distance away from A is a rounded rectangle (rounded square) with corners as a quarter circle of radius L as shown in Figure
- 3(a). In Figure - 3(a) the filled square represents the possible locations of A in a cell. And the filled outer rounded rectangle (rounded square) represents the locus of B such that A is in that cell. To accommodate all the data within a single cell, the best fit would be this Nine Cell Grid shown in Figure - 3(b). That is, all the surrounding 8 cells data to be located in this central cell so that it has the complete coverage of B in any case without having to communicate with neighbouring cells/nodes.
The data of the cell is stored in distributed manner across the 9 nodes using the HDFS (Hadoop Distributed FileSystem) [15]. It is also noted that specific type of data which supports reduce operations are stored in HDFS format only, else they follow the mechanism of complete data copies i.e., entire file is stored as copies in all the 9 cells. That is, unlike HDFS, the data is stored completely in all the 9 nodes without breaking into chunks. This is because not all the data can be processed using the reduce operations.
A general query that is processed in these GPS-applications is to route from location A to location B. Given a query to route from location A to location B, our L value is chosen such that any query made by the traveller using this application has the A-B Euclidean distance not more than L. Or the probability of a query that exceeds the L Euclidean distance is less say (for instance), less than 0.2, which means queries with Euclidean distance less than L occur with a probability of 0.8. In order to achieve this criterion, L is chosen as
L = min { X : Euclidean distance of P% of queries are Euclidean distance of X } – (I)
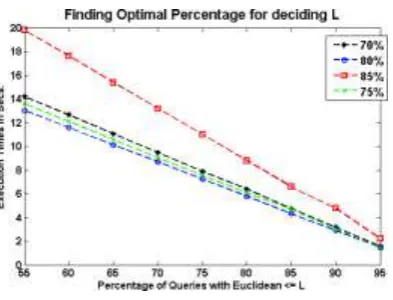
Where, P can be any percentage that gives better perfor- mance. Interestingly, if the percentage is considered high, that is something close to 100% will not help. The reason being, if percentage is high then it tends towards centralized storage pattern. On the other hand, if the percentage considered is very low then it tends to a scenario of high communication for most of the queries. Hence, there exists an optimal percentage to be considered to arrive at L. Hence, on checking the performance of percentages from 70% (an initial guess) in steps of 3 5% it is found that around 80% suits better in this ("New York" dataset from NHTS ) dataset taken (shown in experiments & results section). However, the value of P is different for different datasets. These experiments are done taking 5% as step size since very close percentages outperform each other. Hence, a higher resolution step does not help much. Finally, L is defined globally on substituting P% found in Equation I).
628 | P a g e
Fig. 4. Nine Cell Grid MethodIV. EXPERIMENTS AND RESULTS
We use simulation to study the application-level perfor- mance of centralized, fully distributed and our Geo-spatially localized distributed storage (NineCellGrid approach) data dissemination models. Here, simulations are done using MPI. Dataset used for experiments is ’New York City’ with co- ordinates [(40.3, 41.3),(73.5,74.5)]
(Latitude, Longitude) [14]. In this dataset number of vertices/junctions are 264,346 and number of links/edges are 733,846. Figure - 5 shows the actual coordinates of the dataset used.
629 | P a g e
−−
∼
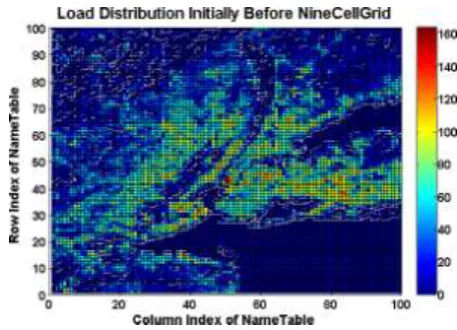
The load estimation of a node is done considering the number of junctions/vertices, links/edges in the region assigned to it. The value of the node’s load is shown as the sum of all these values. Figures - 6, 7 and 8
show the load distribution of the nodes before replication, after replication and finally after the load-balancing respectively. These figures show the load in color based on the value of load a node or cell has. In this dataset the region with waters have low value of estimated load. Hence, are shown with low color value in the scale. The cells with higher load have higher color value in the scale i.e., towards red. After the load balancing ( Figure - 9 ) the regions with less than M δ load values are assigned to nearest cell with load value greater than M δ, hence, the regions with lower load values are vanished (i.e., are shown as zero, low scale value dark blue). And then the load is shared among N nodes such that ’load per node’ is balanced. Hence, there is relatively
lower load range, i.e., there is no much varied color values. Here, the relaxation used is δ = 75. So, the load values in the Figure - 9 would be either between 150 to 300 as the M is around 225 or zero.
The performances are analysed running a Dijkstra’s greedy algorithm for shortest path computation [16]. Here,
MPI is used to simulate the scenario. L value for the dataset New York City is calculated to be 6.8 miles (after selecting P 80% for this dataset) from NHTS (National Household Travel Survey) [13]. This estimation of L is done by first calculating the value of P (as P% in Equation I) and substituting in Equation I). The selection of percentage (P), which determines the L value, is done based on the analysis as shown in the Figure - 15. Initially taking 70% as the initial guess and then increasing in steps of 5% so as to get to the optimal percentage (P% in Equation I)). The graph shows 80% as optimal for this scenario. This P value of 80 is substituted in Equation I) to get L (which is 6.8 miles for this dataset). The percentage may not be the same in a different region as it depends on the city, country, etc.,. But there exists an optimal percentage P to evaluate L. As mentioned in the earlier section the more the percentage tends to centralized storage pattern and leads to less speed up. And on the other hand if less percentage it leads to higher communication and hence degrades performance.
630 | P a g e
Fig. 7. Load distribution after replicationFig. 8. Load distribution after load-balancing
631 | P a g e
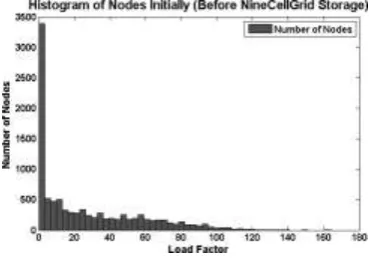
Fig. 10. Histogram of loads before load-balancingFig. 11. Histogram of loads after load-balancing
632 | P a g e
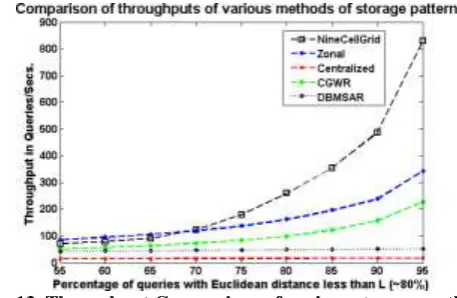
Figure - 13, shows the comparison of throughputs for var- ious storage methodologies. In figure - 13 the notations, Nine- CellGrid represents NineCellGrid Method, ’Zonal’ represents fully distributed pattern,
’Centralized’ represents centralised storage pattern, ’CGWR’ represents ’NineCellGrid Without Replication’ or
Cell-Grid-Without-Replication [CGWR], and finally ’DBMSAR’ represents the DBMS as replication (repli-
cation value of 5 taken). Each of the methods are com- pared in context of the throughputs they yield. Number of queries are 1000. Graph in Figure - 3 shows ’Percentage of queries with Euclidean distance less than L’ vs. ’Through- put in Queries/Sec’. The throughput of NineCellGrid starts dominating other standard methods from 70% onwards. On comparing the throughput of a general scenario of above 80% expectancy, it is seen that NineCellGrid shoots a better throughput values than the others. The difference between the Fully distributed(zonal distribution of data) and NineCellGrid is about 470 (810-340). Hence, it can process about 300 more queries in a second.
Fig. 13. Throughput Comparison of various storage methodologies
V. CONCLUSION
This paper presents NineCellGrid approach to distributed data layout for GPS (Spatial Big Data) applications and quantitatively establishes that NineCellGrid data layout achieves better throughput and average turnaround times compared to fully distributed and centralized storage patterns. Hence, for a real-time application where responsiveness matters, this type of strategy is remarkable. In our method, we improve the performance by exploiting redundancy in a particular pattern of data in each cell being replicated among its eight neighbors. Despite the high data redundancy, and the overheads of extra space used, the benefits of higher computation to communica- tion ratio manifests as higher overall speedup for queries. In addition to that, there is a flexibility of lowering the replication factor, which also leads to balance the load at the same time. Hence, the tradeoff of redundancy to communication overheads is done to overcome excess space utilization.
REFERENCES
[1]. Research on the Data Storage and Access Model in Distributed Comput- ing Environment. Haiyan Wu Coll. of Comput. and Inf. Eng., Zhejiang GongShang Univ., Hangzhou
633 | P a g e
[3]. H. Zhu, Y. Zhu, M. Li, and L. M. Ni, "HERO online real-time vehicle tracking in Shangai," in Proc. of IEEE INFOCOM, 2008.
[4]. Distributed or Centralized Traffic Advisory Systems - The Applications Take. Otto, J.S. ; Dept. of Electr. Eng. and Comput. Sci., Northwestern Univ., Evanston, IL, USA; Bustamante, F.E.
[5]. B. Hoh, M. Gruteser, R. Herring, J. Ban, D. Work, J.C. Herrera, A. Bayen, M. Annavaram, and Q. Jacobson, "Virtual trip lines for distributed privacy-preserving trafïnˇA˛c monitoring," in Proc. of ACM/USENIX MobiSys, Breckenridge, CO, June 2008.
[6]. Bhardwaj, A., Kamboj, V. K., Shukla, V. K., Singh, B., & Khurana, P. (2012, June). Unit commitment in electrical power system-a literature review. In Power Engineering and Optimization Conference (PEOCO) Melaka, Malaysia, 2012 IEEE International (pp. 275-280). IEEE.
[7]. Navpreet Singh Tung, Amit Bhardwaj, Tarun Mittal, Vijay Shukla, Dynamics of IGBT based PWM Converter A Case Study, International Journal of Engineering Science and Technology (IJEST), ISSN: 0975-5462, 2012.
[8]. T. Logenthiran, Dipti Srinivasan Department of Electrical and Computer Engineering National University of Singapore, Intelligent Management of Distributed Storage Elements in a Smart Grid, 2011.
[9]. Shashi Shekhar, Viswanath Gunturi, Michael R. Evans,KwangSoo Yang University of Minnesota, Spatial Big-Data Challenges Intersecting Mo- bility and Cloud Computing, 2012.
[10]. V. Taliwal, D. Jiang, H. Mangold, C. Chen, and R. Sengupta, "Empirical determination of channel characteristics for DSRC vehicle-to-vehicle communication," in Proc. of ACM VANET, 2004.
[11]. Z. Wang and M. Hassan, "How much of dsrc is available for non-safety use?" in Proc. of ACM VANET, September 2008.
[12]. VK Kamboj, A Bhardwaj, HS Bhullar, K Arora, K Kaur, Mathematical model of reliability assessment for generation system, Power Engineering and Optimization Conference (PEOCO) Melaka, Malaysia, 2012 IEEE.
[13]. B. Hull, V. Bychkovsky, Y. Zhang, K. Chen, M. Goraczko, A. Miu,
[14]. E. Shih, H. Balakrishnan, and S. Madden, "CarTel a distributed mobile sensor computing system", in Proc. of ACM SenSys, 2006.
[15]. An ESRI Technical Paper June 2007.
[16]. NHTS: National Household Travel Survey, 2009.
[17]. DIMACS: http://www.dis.uniroma1.it/challenge9/download.shtml [15]The Hadoop Distributed File System, Shvachko, K., Yahoo!, Sunnyvale,
[18]. CA, USA, Hairong Kuang ; Radia, S. ; Chansler, R. [16]Dijkstra Shortest Path Computation Algorithm, by Dijkstra.
![Fig. 1. Grid on Geographic Map [1]](https://thumb-us.123doks.com/thumbv2/123dok_us/7787004.1288626/4.595.227.387.542.683/fig-grid-on-geographic-map.webp)
![Fig. 2. Cell N, with identity [Latitude, Longitude] in NameTable](https://thumb-us.123doks.com/thumbv2/123dok_us/7787004.1288626/5.595.116.518.230.364/fig-cell-n-identity-latitude-longitude-nametable.webp)
![Fig. 5. New York City dataset actual coordinates [14]](https://thumb-us.123doks.com/thumbv2/123dok_us/7787004.1288626/7.595.227.386.123.371/fig-new-york-city-dataset-actual-coordinates.webp)