172 | P a g e
OPTIMIZATION OF END MILLING PARAMETERS
FOR AL/SIC BY GENETIC ALGORITHM
Vamsi Krishna M
1,*, Anthony Xavior M
21
Assistant Professor, Department of Mechanical Engineering, M.I.T.S, Madanapalle, Andhra
Pradesh, (India)
2
Professor, School of Mechanical and Building Sciences, VIT University, Vellore-632014, Tamil
Nadu, (India)
ABSTRACT
For industrial applications, the ceramics composites are machined in large scale using end milling process. Due the abrasive reinforcement particle of composite, the failure in tool life and surface quality are possible. This research work focuses on developing the mathematical models of cutting force (FR), Metal Removal Rate
(MRR) and surface roughness (Ra) and to optimize it. The composite design with L31 empirical model is used for
conducting the basic trials on Al/SiC composites of various compositions. The XRD, EDS, optical microscopic images of Al/SiC composites are analyzed. The models developed for predicting responses were tested by analysis of variance (ANOVA) to evaluate its adequacy. The optimal configuration of machining parameters is identified which yields 31.9326mm3/s, 1.4443µm and 41.4364N of MRR, Ra and FR respectively.
Keywords:
Milling, Optimization, Aluminium Matrix Composites, Polycrystalline Diamond Tool
.
I. INTRODUCTION
Generally, the ceramic composites are aluminium based composites [1] which are reinforced with ceramic
particles like Si3N4 [2], A12O3 [3], B4C [4], TiC [5], etc. The Al/SiC composites are most preferable for the
industrial applications due to its low density and high strength [6].
The machining of ceramic composites was difficult because of its non-homogeneous, anisotropic and reinforced
by abrasive materials [7]. The machined composite may experience a significant damage and high wear rate on
the cutting tools. The machining of composite materials was depending on several conditions like material
properties, relative content of the reinforcement and the response to the machining process [8].
Fei et al. [9] studied the compound machining of the engineering materials to increase the efficiency of the machining method. It was concluded that the machine can be suggested based on the efficiency of output
parameters but optimizing all the outputs in a single machine mode was tedious.
End milling is a vital and common machining process because of its flexibility and capability to produce various
profiles even with the curved surfaces. It has the ability to remove material with good surface quality and the
milled surfaces are largely used to mate the aerospace, automobile, biomedical and manufacturing industries
applications [10]. It has wide use in these industries because of its good performance in processing
173 | P a g e
The major aims of the machining process are improving the surface roughness quality and maximizing thematerial removal rate (MRR) with optimal cutting force. Traditionally, trial-and-error and heuristic approaches
were employed to obtain the optimal machining parameters. It was well recognized that these methods were
time consuming and lead to long machining periods with large machining cost [12].
Design of Experiments (DOE) is a powerful analysis tool for modelling and analyzing the influence of control
factors on output performance. The traditional experimental design is difficult to be used especially when
dealing with large number of experiments and when the number of machining parameters increased [13]. The
most important stage in the design of experiment lies in the selection of the control factors [14].
Oktem et al. [15] had focused on the development of an effective methodology to determine the optimum cutting conditions leading to minimum surface roughness (Ra) in milling by coupling the Response Surface
Methodology (RSM) with the developed genetic algorithm (GA). Afazov et al. [16] studied the micro milling conditions which influence the cutting force for optimizing the process stability. Later, Emel et al. [17] had done a work to optimize the cutting fluids and the cutting parameters in end milling process using DOE. As a result, a
new machining method with minimal machining cost and without environmental impacts was developed.
The optimization of all the output parameters of end milling process was a tedious. This research work focuses
on developing the mathematical models of cutting force (FR), Metal Removal Rate (MRR) and surface
roughness (Ra) and to optimize it. And also the adequacies in predicting the responses by the developed models
were analyzed along with experimental results and the deviation from the optimal configuration was evaluated.
II. MATERIALS AND METHODS
2.1 Materials
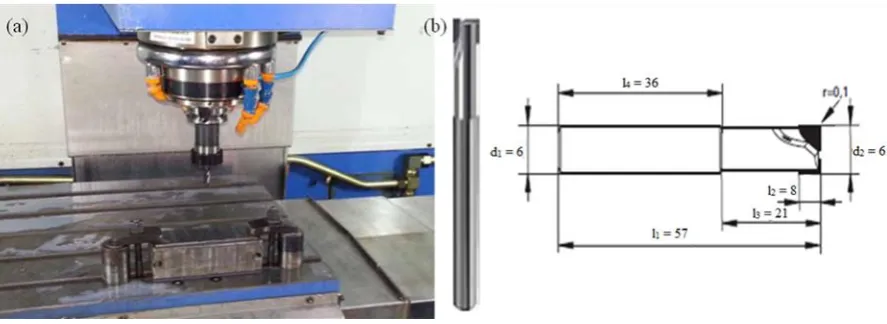
The end milling tests were conducted with BATIBOI-NOMO universal milling machine (Fig. 1 (a)). In the
milling experiments, Al 6061/SiC composite material were used as the work piece with varying reinforcement
wt. % of 5, 10 and 15, which had the dimension of 100*100*10mm3. Using the stir casting method, the Al/SiC composites were manufactured with the SiC particle size of 37μm. For machining these composites for good
machinability, the Poly Crystalline Diamond (PCD) tools were selected [18].The PCD coated tool (Fig. 1 (b)) of
thickness 0.6mm and 12mm in diameter was used.
174 | P a g e
2.2 Measurements
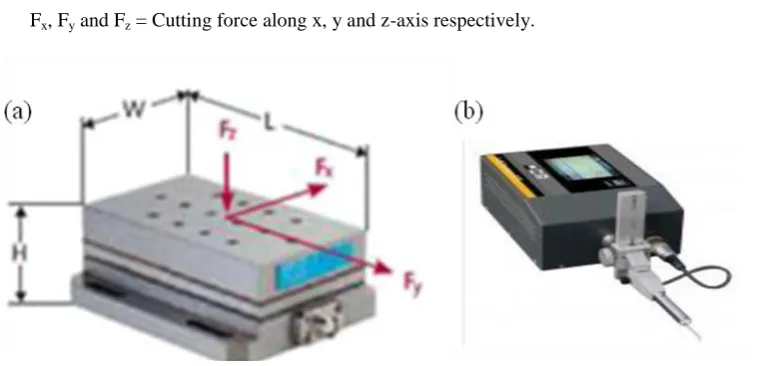
The MRR was calculated using the equation (1) and the cutting forces was measured using the 3-axis milling
tool dynamometer- Kistler 9257B (Fig. 2 (a)). The force data were acquired via DAQ card and an amplifier, and
it was processed by Dynoware software. Using this force setup, three force components (Fx, Fy and Fz) were
measured simultaneously and its resultant (FR) was calculated using equation (2). The Surface roughness (Ra) of
the machined surface was measured using ROGOSOFT 90G Profilometer (Fig. 2 (b)) with the accuracy of
0.001µm.
Time
DOC
*
b
*
l
MRR
(1)2 z 2 y 2 x
R
F
F
F
F
(2)Where, l = length of the plate
b = breath of the plate
DOC = depth of cut
FR = Resultant cutting force
Fx, Fy and Fz = Cutting force along x, y and z-axis respectively.
Fig. 2 (a) 3-axis dynamometer - Kistler 9257B (b) Profilometer - ROGOSOFT 90G
III. CHARACTERIZATION
3.1 X-ray diffraction analysis
The X-ray diffraction (XRD) (Model: X’per PRO) pattern of the Al/SiC composite was shown in Fig. 3 and it
matches with the JCPDS file #04-0787 [19]. It exhibits strong orientation of (111) plane at 38.33° and weak
orientation of (311) peak at 77.91°. An osbornite phase was identified; and as a result of (111) plane and (220)
plane intensity ratio; it was almost similar to the preferred orientation of Al [20]. It can be seen that the higher
175 | P a g e
crystalline size of about 44.9 nm. The unit cell of the Al/SiC composite exhibits a hexagonal structure with a = b= 4.063460 Å and c = 4.068095Å of lattice.
Fig. 3 XRD pattern of Al/SiC composite
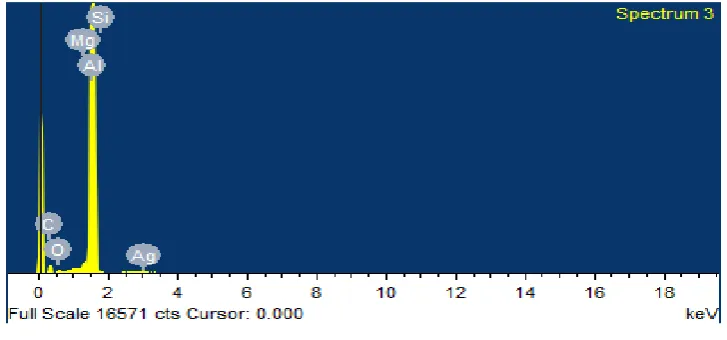
3.2 Energy Dispersive Spectrum analysis
The Energy Dispersive Spectrum (EDS) analysis of Al/SiC composite was shown in Fig. 4 which reveals the
presence of Al, Si and C elements in it.
Fig. 4 EDS image of Al/SiC composite
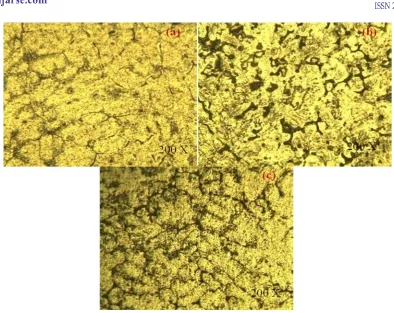
3.3 Structural analysis
The optical microscopic images of the Al/SiC composites with varying reinforcement wt. % of 5, 10 and 15
were shown in Fig. 5 (a-c). The arrangement of SiC particles were clear and uniform on the Al matrix was
evidenced from optical microscopic images. The presence of SiC increases homogeneously with an increase in
176 | P a g e
Fig. 5 Microstructure images of Al/SiC composite (a) 5 wt. % (b) 10 wt. % (c) 15 wt. %
IV. STASTICAL ANALYSES
The composite design involves the study about responses based on the combinations, estimating the coefficients,
fitting the experimental data, predicting the response and checking the adequacy of the fitted model [21]. Here,
the responses are MRR, Ra and FR for the independent variables (input parameters) are reinforcement %, Depth
of Cut, and Feed rate, Cutting Speed (Table 1). For this DOE, the two levels design with L31 array was done
using MINITAB 16. The results of the output parameters after machining process were consolidated for
mathematical modelling the input parameters (Table 2). The regression equations were formed for the individual
responses based on the controlling parameters. From this mathematical model, the predicted models were
estimated and the models are validated through ANOVA [22].
Table 1 Parameters and Levels in End Milling
S.No Variable Parameter Units levels Low High
1. A Material (Wt. %) 5 15
2. B Depth of Cut (mm) 0.3 0.6
3. C Feed (mm/min) 30 90
177 | P a g e
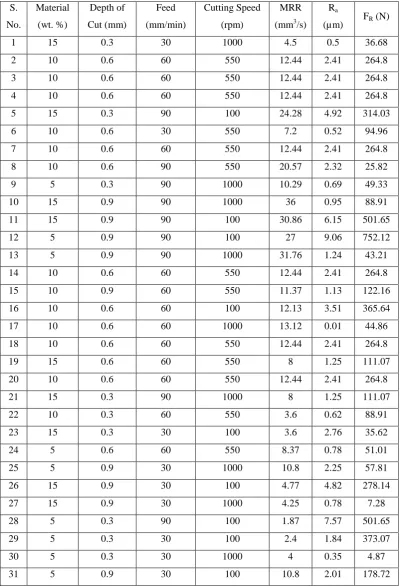
Table 2 Analytical table of responses for the independent variables
S.
No.
Material
(wt. %)
Depth of
Cut (mm)
Feed
(mm/min)
Cutting Speed
(rpm)
MRR
(mm3/s) Ra
(µm) FR (N)
1 15 0.3 30 1000 4.5 0.5 36.68
2 10 0.6 60 550 12.44 2.41 264.8
3 10 0.6 60 550 12.44 2.41 264.8
4 10 0.6 60 550 12.44 2.41 264.8
5 15 0.3 90 100 24.28 4.92 314.03
6 10 0.6 30 550 7.2 0.52 94.96
7 10 0.6 60 550 12.44 2.41 264.8
8 10 0.6 90 550 20.57 2.32 25.82
9 5 0.3 90 1000 10.29 0.69 49.33
10 15 0.9 90 1000 36 0.95 88.91
11 15 0.9 90 100 30.86 6.15 501.65
12 5 0.9 90 100 27 9.06 752.12
13 5 0.9 90 1000 31.76 1.24 43.21
14 10 0.6 60 550 12.44 2.41 264.8
15 10 0.9 60 550 11.37 1.13 122.16
16 10 0.6 60 100 12.13 3.51 365.64
17 10 0.6 60 1000 13.12 0.01 44.86
18 10 0.6 60 550 12.44 2.41 264.8
19 15 0.6 60 550 8 1.25 111.07
20 10 0.6 60 550 12.44 2.41 264.8
21 15 0.3 90 1000 8 1.25 111.07
22 10 0.3 60 550 3.6 0.62 88.91
23 15 0.3 30 100 3.6 2.76 35.62
24 5 0.6 60 550 8.37 0.78 51.01
25 5 0.9 30 1000 10.8 2.25 57.81
26 15 0.9 30 100 4.77 4.82 278.14
27 15 0.9 30 1000 4.25 0.78 7.28
28 5 0.3 90 100 1.87 7.57 501.65
29 5 0.3 30 100 2.4 1.84 373.07
30 5 0.3 30 1000 4 0.35 4.87
178 | P a g e
4.1 Mathematical Models of the Responses
Based on the uncoded data from the given input trails, the mathematical models of the responses were estimated.
The MRR in the form of regression equation was stated in equation (3), which states that the factor B influences
more compared to other factors. In equation (4) and (5) were the regression equations of Ra and FR respectively,
which also declare that the factors B (depth of cut) influences highly in all the configuration results.
MRR = 1.25478 + 1.75719*A + 33.8615*B - 0.688283*C - 0.0103421*D - 0.0749221*A2 - 28.5895*B2 +
0.00425216*C2 + 1.27E-05*D2 - 1.09583*A*B + 0.0162917*A*C - 7.09E-04*A*D +
0.451806*B*C + 0.00682407*B*D + 2.78E-07*C*D (3)
Ra = -1.26391 + 0.138958*A + 4.77893*B + 0.0573958*C - 0.00338567*D + 0.000519467*A2 - 1.41126*B2 +
0.00046443*C2 + 0.00000374314*D2 - 0.0154167*A*B - 0.0030125*A*C + 0.0000347222*A*D -
0.0132639*B*C - 0.00138426*B*D - 0.0000763426*C*D
(4)
FR = 45.5807 + 2.53377*A + 50.2841*B + 10.8129*C - 0.653551*D - 1.23815*A2 - 71.7649*B2 -
0.0573376*C2 + 0.000460524*D2 + 11.2092*A*B - 0.03355*A*C + 0.0210617*A*D +
2.39389*B*C - 0.22425*B*D - 0.00468241*C*D (5)
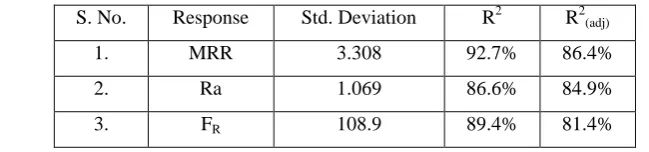
4.2 Adequacy of model
The adequacy of the responses were tabulated in Table 3 with R2 and R2(adj) values. These indicate that the model
fits the data well and R2 was in agreement with R2(adj) which supports the prediction capacity of the model. In all
the models, both the values were good and above 80% which makes a fitness in predicting solutions [23].
Table 3 Adequacy of the models
S. No. Response Std. Deviation R2 R2(adj)
1. MRR 3.308 92.7% 86.4%
2. Ra 1.069 86.6% 84.9%
3. FR 108.9 89.4% 81.4%
4.3 ANOVA
The ANOVA for MRR, Ra and FR is tabulated in Table 4. In all forms of regression, the P values of the
responses were less than the F value and also it was less than 0.05 i.e. the level of significant was 95%. It
confirms that the developed models were adequate, and the predicted values were in good agreement with the
179 | P a g e
Table 4 ANOVA for responses
Responses Source DF Seq SS Adj SS Adj MS F P
MRR Regression 14 2234.93 2234.93 159.638 14.59 0
Residual Error 16 175.11 175.11 10.944
Total 30 2410.03
Ra Regression 14 118.318 118.3183 8.4513 7.39 0
Residual Error 16 18.293 18.2934 1.1433
Total 30 136.612
FR Regression 14 731762 731762 52269 4.41 0.003
Residual Error 16 189652 189652 11853
Total 30 921414
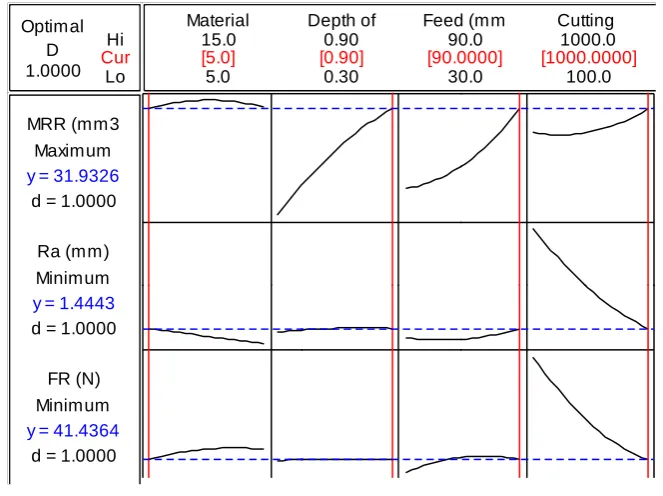
4.4 Optimization Hi Lo 1.0000 D Optimal Cur
d = 1.0000 Minimum
FR (N) d = 1.0000
Minimum Ra (mm) d = 1.0000
Maximum MRR (mm3
y = 41.4364 y = 1.4443 y = 31.9326
100.0 1000.0 30.0 90.0 0.30 0.90 5.0 15.0
Depth of Feed (mm Cutting Material
[5.0] [0.90] [90.0000] [1000.0000]
Fig. 6 Optimal configurations for optimal response
The optimal configuration of input parameters and its responses were identified from the Fig. 6. The optimal
configuration was 5wt. % reinforced material with machining parameter of high depth of cut 0.9mm, feed rate
of 90mm/min and cutting speed 1000rpm which provides the global optimal solution of 31.9326mm3/s MRR,
1.4443µm surface roughness and 41.4364N of resultant cutting force for desirability of 98.6%, 99.1% and
94.5% respectively. For the same optimal condition, the experimental result was 31.76mm3/s MRR, 1.24µm Ra
and 43.2N FR which was 0.5%, 14% and 4% deviation from the predicted results which shows the acceptable
180 | P a g e
VI. CONCLUSION
The Al/SiC composite with varying reinforcement composition was done to study its machining nature was
successful. The Al/SiC composite was characterized using XRD, EDS and optical microscopic images which
inferred the structural changes in orientation and surface due reinforcement particle. The influence of machining
parameters on the responses was discussed and the effects were evidenced through SEM images. Using RSM,
the optimal configuration of machining parameter which provides optimal response was identified. The optimal
configuration was 5wt. % reinforced material with machining parameter of high depth of cut 0.9mm, feed rate
of 90mm/min and cutting speed 1000rpm which provides the global optimal solution of 31.9326mm3/s MRR,
1.4443µm surface roughness and 41.4364N of resultant cutting force which shows the acceptable prediction.
REFERENCE
[1] Nishida Y. Introduction to metal matrix composites. New York: Springer; 2013.
[2] Arik H. Effect of mechanical alloying process on mechanical properties of [alpha]-Si3N4 reinforced
aluminum-based composite materials. Materials & Design 2008; 29: 1856–1861.
[3] Canakci A, Varol T, Ozsahin S. Prediction of effect of volume fraction, compact pressure and milling
time on properties of Al–Al2O3 MMCs using neural networks. Metals and Materials International 2013;
19: 519–526.
[4] Varol T, Canakci A. Effect of weight percentage and particle size of B4C reinforcement on physical and
mechanical properties of powder metallurgy Al2024–B4C Composites. Metals and Materials
International 2013; 19: 1227–1234.
[5] Kumar A, Mahapatra MM, Jha PK. Modeling the abrasive wear characteristics of in-situ synthesized
Al–4.5%Cu/TiC. Wear 2013; 306: 170–178.
[6] Zafarani HR, Hassani A, Bagherpour E. Achieving a desirable combination of strength and workability
in Al/SiC composites by AHP selection method. Journal of Alloys and Compounds 2014; 589: 295–300. [7] Teti R. Machining of composite materials. CIRP Ann. Manuf. Technol. 2002; 51: 611–634.
[8] Pang JS, Ansari MNM, Omar S, Zaroog, Moaz H, Sapuan SM. Taguchi design optimization of
machining parameters on the CNC end milling process of halloysite nanotube with aluminium
reinforced epoxy matrix (HNT/Al/Ep) hybrid composite. HBRC Journal 2014; 10: 138–144.
[9] Fei W, Yonghong L, Yanzhen Z, Zemin T, Renjie J, Chao Z. Compound machining of titanium alloy by
super high speed EDM milling and arc machining. Journal of Materials Processing Technology 2014;
214: 531– 538.
[10] Subramanian M, Sakthivel M, Sooryaprakash K, Sudhakaran R. Optimization of Cutting Parameters for
Cutting Force in Shoulder Milling of Al7075-T6 Using Response Surface Methodology and Genetic
Algorithm. Procedia Engineering 2013; 64: 690 – 700.
[11] Guochao L, Jie S, Jianfeng L. Modeling and analysis of helical groove grinding in end mill machining.
Journal of Materials Processing Technology 2014; 214: 3067–3076.
[12] Xiaoming Z, Han D. Note on a novel method for machining parameters optimization in a chatter-free
181 | P a g e
[13] Asilturk I, Akkus H. Determining the effect of cutting parameters on surface roughness in hard turningusing the Taguchi method. Measurement 2002; 44: 1697–1704.
[14] Mahapatra SS, Patnaik A. Study on mechanical and erosion wear behavior of hybrid composites using
Taguchi experimental design. Materials and Design 2009; 30: 2791–2801.
[15] Oktem H, Erzurumlu T, Kurtaran H. Application of response surface methodology in the optimization of
cutting conditions for surface roughness. Journal of Material Processing Technology 2005; 170: 11-16. [16] Afazov SM, Zdebski D, Ratchev SM, Segal J, Liu S. Effects of micro-milling conditions on the cutting
forces and process stability. Journal of Materials Processing Technology 2013; 213: 671– 684.
[17] Emel K, Babur O, Mahmut B, Erhan D, Bilgin TS. Optimization of cutting fluids and cutting parameters
during end milling by using D-optimal design of experiments. Journal of Cleaner Production 2013; 42: 159-166.
[18] Takeshi M, Tsunemoto K, Jiwang Y, Nobuhito Y. Study on shaping spherical Poly Crystalline Diamond
tool by Micro electro Discharge Machining and micro grinding with the tool. International Journal of Surface Science and Engineering 2007; 1: 344-359.
[19] Narayanasamy R, Ramesh T, Prabhakar M. Effect of particle size of SiC in aluminium matrix on
workability and strain hardening behaviour of P/M composite. Materials Science and Engineering: A
2009; 504: 13-23.
[20] Urena A, Rams J, Campo M, Sanchez M. Effect of reinforcement coatings on the dry sliding wear
behaviour of aluminium/SiC particles/carbon fibres hybrid composites. Wear 2009; 266: 1128–36. [21] Baradeswaran A, Vettivel SC, Elaya Perumal A, Selvakumar N, Franklin Issac R. Experimental
investigation on mechanical behaviour, modelling and optimization of wear parameters of B4C and
graphite reinforced aluminium hybrid composites. Materials & Design 2014; 63: 620-632.
[22] Saravanan I, Elaya PerumalA, Vettivel SC, Selvakumar N, Baradeswaran A. Optimizing wear behavior
of TiN coated SS 316L against Ti alloy using Response Surface Methodology. Materials and Design
2015; 67: 469–482.
[23] Baradeswaran A, Elayaperumal A, Franklin Issac R. A Statistical Analysis of Optimization of Wear