Integrated Blood Pressure Control
Dove
press
R e v I e w open access to scientific and medical research
Open Access Full Text Article
vitamin D status and hypertension: a review
Liang Ke1
Rebecca S Mason2
Maina Kariuki3
elias Mpofu1
Kaye e Brock2
1Faculty of Health Sciences, 2Faculty of Medicine, University of Sydney, 3Biostatistical Officer Training Program, NSw Ministry of Health, Sydney, NSw, Australia
Correspondence: Kaye e Brock Faculty of Medicine, University of Sydney, Sydney 2006, NSw, Australia
Tel +61 2 9351 6544 Fax +61 2 9351 2058
email kaye.brock@sydney.edu.au
Abstract: Vitamin D is a steroid prohormone synthesized in the skin following ultraviolet exposure and also achieved through supplemental or dietary intake. While there is strong evi-dence for its role in maintaining bone and muscle health, there has been recent debate regarding the role of vitamin D deficiency in hypertension based on conflicting epidemiological evidence. Thus, we conducted a scoping systematic literature review and meta-analysis of all observational studies published up to early 2014 in order to map trends in the evidence of this association. Mixed-effect meta-analysis was performed to pool risk estimates from ten prospective studies (n=58,262) (pooled risk for incident hypertension, relative risk [RR] =0.76 (0.63–0.90) for top vs bottom category of 25-hydroxyvitamin D [25OHD]) and from 19 cross-sectional studies (n=90,535) (odds ratio [OR] =0.79 (0.73–0.87)). Findings suggest that the better the assessed quality of the respective study design, the stronger the relationship between higher 25OHD levels and hypertension risk (RR =0.67 (0.51–0.88); OR =0.77 (0.72–0.89)). There was signifi-cant heterogeneity among the findings for both prospective and cross-sectional studies, but no evidence of publication bias was shown. There was no increased risk of hypertension when the participants were of older age or when they were vitamin D deficient. Younger females showed strong associations between high 25OHD levels and hypertension risk, especially in prospective studies (RR =0.36 (0.18–0.72); OR =0.62 (0.44–0.87)). Despite the accumulating evidence of a consistent link between vitamin D and blood pressure, these data are observational, so questions still remain in relation to the causality of this relationship. Further studies either combining existing raw data from available cohort studies or conducting further Mendelian analyses are needed to determine whether this represents a causal association. Large randomized controlled trials are also needed to determine whether vitamin supplementation may be beneficial in the prevention or the treatment of hypertension.
Keywords: 25OHD, high blood pressure, meta-analysis, prospective, cross-sectional, blood pressure
Introduction
Despite recent downward trends in cardiovascular disease (CVD) mortality rates,1
CVD still represents 50% of noncommunicable disease deaths worldwide,2 and there
is an exponential increase in CVD incidence in lower- and middle-income countries.3
Hypertension, which is also increasing,4 is one of the primary modifiable risk factors
for CVD, and as such, any new modifiable risk factor associated with prevention of this condition is important for public health measures. Obesity and lack of physical activity (PA) and increased salt intake are well-known and studied modifiable environmental factors associated with hypertension. In recent times, vitamin D deficiency has also been postulated to be such a factor.5–8
Integrated Blood Pressure Control downloaded from https://www.dovepress.com/ by 118.70.13.36 on 22-Aug-2020
For personal use only.
Number of times this article has been viewed
This article was published in the following Dove Press journal: Integrated Blood Pressure Control
Dovepress
Ke et al
Vitamin D is a steroid prohormone synthesized in the skin following ultraviolet exposure. It is also achieved through supplemental or dietary intake. While there is strong evidence for its role in maintaining bone and muscle health,9 there has
been recent debate regarding the role of vitamin D deficiency in CVD conditions10,11 based on conflicting epidemiological
evidence.
There is a growing body of evidence from animal12
and clinical studies13 that vitamin D-mediated
reduc-tion of hypertension involves increased activareduc-tion of the renin–angiotensin–aldosterone system, which is the main regulator of electrolyte and volume homeostasis that contrib-utes to the development of arterial hypertension.
Epidemiologically, cross-sectional studies have consis-tently shown associations of hypertension with vitamin D deficiency as measured by the level of 25-hydroxyvitamin D (25OHD) (in nanomoles per litre) in the blood,7 and the most
recent meta-analyses of prospective studies8 have also found
this association to be persistent over time. However, meta-analysis results from randomized controlled trials (RCTs) (the gold standard of epidemiological studies) of 25OHD blood levels and hypertension have been null.14 This
dis-crepancy may well be due to the small size and specialized population samples of the RCTs.
Due to the continued interest and debate in this area, we conducted a scoping systematic literature review and meta-analysis of all observational studies published up to early 2014 in order to map trends in the evidence on the association between blood vitamin D levels and the risk of hypertension.
Methods
For this systematic review, studies concerned with hyperten-sion and 25OHD were identified using a predefined protocol and in accordance with Preferred Reporting Items for Sys-tematic Reviews and Meta-Analyses (PRISMA) statement.15
Unlike previous reviews,7,8 we included studies that varied
by culture of respondents for broader perspective (Supple-mentary material).
Data source and study search
We systematically conducted independent searches of Scopus and PubMed databases for published articles from January 1, 2007 until February 22, 2014. Identical search strategies were applied for each database search with combined terms of “25OHD”, “25-hydroxyvitamin D”, “vitamin D”, “hyperten-sion”, “vitamin D supplementation (cholecalciferol [vitamin D3], ergocalciferol [vitamin D2])”, “systolic blood pressure (SBP)”, or “diastolic blood pressure (DBP)”. Reference lists
of retrieved articles were automatically imported into Endnote X5 and manually scanned for relevant review articles. Dupli-cated references from two databases were detected by Endnote X5. In order to proceed further in the review process, retrieved articles’ abstracts were read by two independent reviewers (KB and LK). Only those abstracts that were related to 25OHD levels and hypertension were kept for full-text review and meta-analysis. Disagreements were resolved by a consensus or by reference with co-authors: statistician (MK) and/or vitamin D physiologist (RSM). We restricted the search to human studies and those published in English.
Study selection
As a very recent meta-analysis has been published on RCTs,14
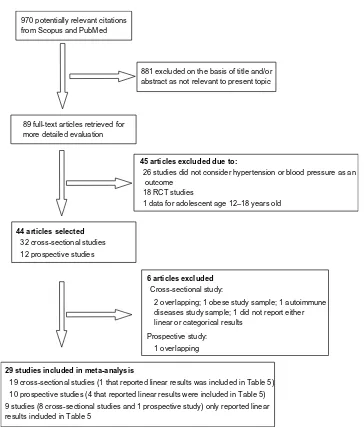
only observational (cross-sectional and prospective) studies were included in this meta-analysis. For these observational studies, the independent risk factor was plasma or serum vitamin D levels measured as 25OHD in blood, and the out-come was hypertension or SBP and DBP. Dietary vitamin D was not included in this systematic review. Figure 1 shows a flowchart of the data extraction.
We restricted this meta-analysis (Tables 1–4 and Figures 2A and 3A) to studies which recruited healthy adult study populations (aged greater than 18 years) from the gen-eral population. Prospective studies were included if they had at least 1 year of follow-up, with 25OHD levels measured at baseline, and if the results were reported categorically as a relative risk (RR) or an odds ratio (OR) with 95% confidence intervals (CIs).
Studies were excluded if the study sample was not recruited from the general population (ie, participants who had hypertension at baseline or participants with conditions that may influence vitamin D metabolism such as obese population groups16 or autoimmune diseases17). Exclusions
applied as well if there was more than one study that investigated the same data (eg, The National Health and Nutrition Examination Survey (NHANES)18 duplicates
were excluded).
Table 5 contains other extracted studies that reported associations with linear 25OHD levels. These studies were included in the systematic review results and discussion but not in the formal meta-analysis mapping.
Data extraction and quality
assessment
The following data were extracted from each study:
• first authors’ last name, year of publication, study name, year of study conducted, and quality score;
• country of studies’ origin and study population;
Integrated Blood Pressure Control downloaded from https://www.dovepress.com/ by 118.70.13.36 on 22-Aug-2020
Dovepress 25OHD and blood pressure: a meta-analysis and systematic review
970 potentially relevant citations from Scopus and PubMed
881 excluded on the basis of title and/or abstract as not relevant to present topic
89 full-text articles retrieved for more detailed evaluation
26 studies did not consider hypertension or blood pressure as an outcome
18 RCT studies
1 data for adolescent age 12–18 years old
32 cross-sectional studies 12 prospective studies
Cross-sectional study:
2 overlapping; 1 obese study sample; 1 autoimmune diseases study sample; 1 did not report either linear or categorical results
1 overlapping
19 cross-sectional studies (1 that reported linear results was included in Table 5) 10 prospective studies (4 that reported linear results were included in Table 5) 9 studies (8 cross-sectional studies and 1 prospective study) only reported linear results included in Table 5
45 articles excluded due to:
44 articles selected
6 articles excluded
Prospective study:
29 studies included in meta-analysis
Figure 1 Flowchart of meta-analysis data extraction. Abbreviation: RCT, randomized controlled trial.
• gender and age;
• sample size (number of cases of hypertension in the case of prospective studies);
• baseline 25OHD as either percent of vitamin D deficiency or mean of 25OHD and vitamin D assay method;
• 25OHD categories;
• mode of hypertension measurement;
• risk estimates (RRs or ORs) with corresponding CIs for blood 25OHD concentrations; and
• confounders measured and taken account for in analysis.
Study quality score was assessed based on the nine-star Newcastle–Ottawa Scale (NOS)10 using predefined criteria
namely selection (population representativeness), compara-bility (adjustment for confounders such as age, gender, body mass index [BMI], PA, ethnicity, season, antihypertensive
treatment, and diabetes status used), and ascertainment of outcome. In this predefined scoring method, a maximum of four points were given for selection, two points for compara-bility, and three points for outcome. Nine points on the NOS reflect the highest study quality.19
Data synthesis and analysis
Mixed-effect meta-analysis20 was performed to pool risk
estimates for both observational and prospective studies. For both studies, we synthesized RR (for prospective studies) or OR (for cross-sectional studies), and 95% CI. These estimate compare the lowest vitamin D status as defined by categorical levels of 25OHD (as the reference group) to the highest vitamin D levels in order to esti-mate the risk of association with hypertension (primary endpoint).
Integrated Blood Pressure Control downloaded from https://www.dovepress.com/ by 118.70.13.36 on 22-Aug-2020
Dovepress
Ke et al
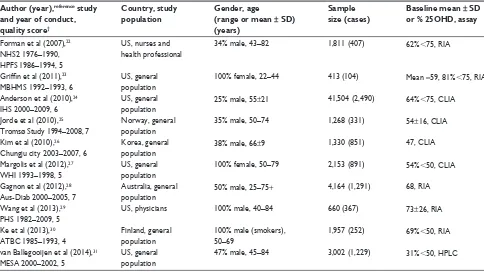
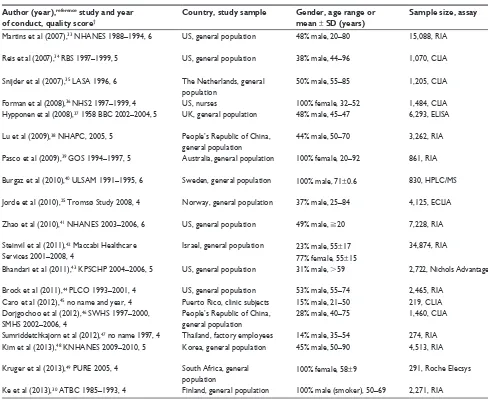
Table 1 Characteristics of prospective studies
Author (year),reference study and year of conduct, quality score†
Country, study population
Gender, age
(range or mean ± SD) (years)
Sample size (cases)
Baseline mean ± SD or % 25OHD, assay
25OHD (nmol/L) comparison
Follow-up (years)
Primary endpoint: hypertension (mmHg)
RR (95% CI) Confounders
Forman et al (2007),22 NHS2 1976–1990, HPFS 1986–1994, 5
US, nurses and health professional
34% male, 43–82 1,811 (407) 62%,75, RIA ,37 vs 75 4 Self-report 0.31 (0.14–0.72) Age, BMI, PA, ethnicity,
diabetes status Griffin et al (2011),23
MBHMS 1992–1993, 6
US, general population
100% female, 22–44 413 (104) Mean =59, 81%,75, RIA ,80 vs 80 14 BP 140/90 0.33 (0.12–0.99) Age, % body fat, season, HTN
treatment Anderson et al (2010),24
IHS 2000–2009, 6
US, general population
25% male, 55±21 41,504 (2,490) 64%,75, CLIA ,38 vs 75 1.3 BP 140/90 0.62 (0.53–0.73) Age, gender, season, HTN
treatment, diabetes status Jorde et al (2010),25
Tromsø Study 1994–2008, 7
Norway, general population
35% male, 50–74 1,268 (331) 54±16, CLIA ,41 vs 63 14 BP 140/90 0.99 (0.76 –1.28) Age, gender, BMI, PA, season,
HTN treatment Kim et al (2010),26
Chungju city 2003–2007, 6
Korea, general population
38% male, 66±9 1,330 (851) 47, CLIA ,20 vs 89 4 BP 140/90 0.47 (0.27–0.82) Age, gender, BMI, PA, season,
HTN treatment Margolis et al (2012),27
wHI 1993–1998, 5
US, general population
100% female, 50–79 2,153 (891) 54%,50, CLIA ,34 vs 65 7 BP 140/90 0.86 (0.60–1.23) Age, BMI, PA, ethnicity, season,
HTN treatment, diabetes status Gagnon et al (2012),28
Aus-Diab 2000–2005, 7
Australia, general population
50% male, 25–75+ 4,164 (1,291) 68, RIA ,45 vs 85 5 BP 130/85 0.71 (0.51–0.98) Age, gender, PA, ethnicity,
season, diabetes status wang et al (2013),29
PHS 1982–2009, 5
US, physicians 100% male, 40–84 660 (367) 73±26, RIA ,50 vs 100 15 Self-report 0.94 (0.69–1.27) Age, BMI, PA, ethnicity, season,
HTN treatment, diabetes status Ke et al (2013),30
ATBC 1985–1993, 4
Finland, general population
100% male (smokers), 50–69
1,957 (252) 69%,50, RIA ,25 vs 80 4 BP 140/90 1.00 (0.60–1.50) Age, BMI, PA, season
van Ballegooijen et al (2014),31 MeSA 2000–2002, 5
US, general population
47% male, 45–84 3,002 (1,229) 31%,50, HPLC ,50 vs 75 9 BP 140/90 0.81 (0.71–0.93) Age, gender, BMI, PA, ethnicity,
season, HTN treatment
Note: †Quality score based on Newcastle–Ottawa Scale.
Abbreviations: NHS2, Nurses’ Health Study 2; HPFS, Health Professional Follow-up Study; MBHMS, Michigan Bone Health and Metabolism Study; IHS, Intermountain
Healthcare System; wHI, women’s Health Initiative; Aus-Diab, Australian Diabetes, Obesity and Lifestyle Study; PHS, Physicians’ Health Study; ATBC, Alpha-Tocopherol, Beta-Carotene Cancer Prevention Study; MeSA, Multi-ethnic Study of Atherosclerosis; SD, standard deviation; 25OHD, 25-hydroxyvitamin D; RR, relative risk; CI, confidence interval; RIA, radioimmunoassay; US, United States; BMI, body mass index; PA, physical activity; BP, blood pressure; HTN, hypertension; CLIA, chemiluminescence immunoassay.
Risk estimate values of less than 1.00 were associated with a decreased risk for hypertension as a result of increased blood levels of 25OHD. We performed sensitivity analyses to assess the influence of each individual study by removing one study at a time and calculating a pooled estimate for the remainder of the studies. No one study influenced the overall results, suggesting balanced selection.
We tested study heterogeneity by the I2 statistic
(signifi-cance set at 95% level, ie, P,0.05).21 Potential publication
bias was assessed by the Egger’s test and presented in a Begg’s funnel plot21 of standard mean differences against their
standard error (Figures 2B and 3B). The meta-analysis pro-cedure was conducted using Comprehensive Meta-Analysis, version 2.
Results
Study selection
Our initial search identified 970 potentially relevant cita-tions (Figure 1). After screening of titles and abstracts, 89 articles remained for further evaluation. Following detailed assessment, 51 articles were excluded. Therefore, 38 studies were included in this study, but only 29 studies (ten prospective studies and 19 cross-sectional studies)
were included in the formal meta-analysis; the other nine studies (one prospective study and eight cross-sectional studies) that reported linear results. In addition four stud-ies which were prospective studstud-ies and one cross-sectional study, which also reported linear results, are included in Table 5.
Characteristics of included studies –
prospective studies
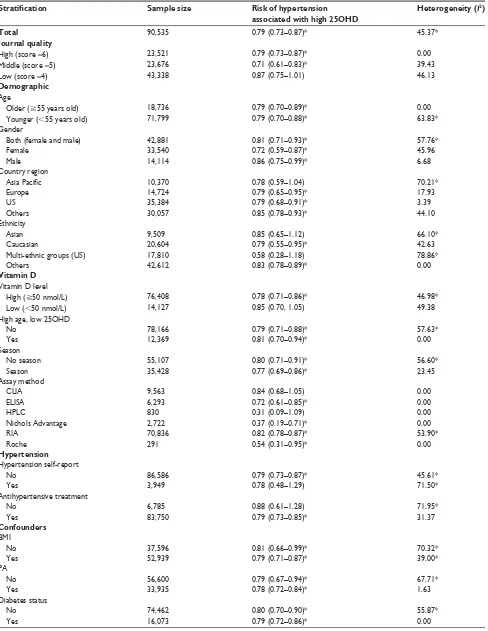
The pooled RR (95% CI) for incident hypertension (pri-mary endpoint) in a comparison of individuals in the top category of 25OHD levels with lowest category (as reference group) of 25OHD levels was 0.76 (0.63–0.90) (Figure 2A).
There was evidence of heterogeneity among the findings of the studies that measured blood 25OHD levels (I2=67.05,
P,0.01). The Egger’s test based on all included studies showed no evidence of publication bias for blood 25OHD concentrations and hypertension (P=0.53), with the funnel plot shown in Figure 2B.
Overall, we identified eleven prospective studies,22–32
of which ten have been included in this formal meta-analysis.22–31 One study by Skaaby et al32 from Denmark
Integrated Blood Pressure Control downloaded from https://www.dovepress.com/ by 118.70.13.36 on 22-Aug-2020
Dovepress 25OHD and blood pressure: a meta-analysis and systematic review
Table 1 Characteristics of prospective studies
Author (year),reference study and year of conduct, quality score†
Country, study population
Gender, age
(range or mean ± SD) (years)
Sample size (cases)
Baseline mean ± SD or % 25OHD, assay
25OHD (nmol/L) comparison
Follow-up (years)
Primary endpoint: hypertension (mmHg)
RR (95% CI) Confounders
Forman et al (2007),22 NHS2 1976–1990, HPFS 1986–1994, 5
US, nurses and health professional
34% male, 43–82 1,811 (407) 62%,75, RIA ,37 vs 75 4 Self-report 0.31 (0.14–0.72) Age, BMI, PA, ethnicity,
diabetes status Griffin et al (2011),23
MBHMS 1992–1993, 6
US, general population
100% female, 22–44 413 (104) Mean =59, 81%,75, RIA ,80 vs 80 14 BP 140/90 0.33 (0.12–0.99) Age, % body fat, season, HTN
treatment Anderson et al (2010),24
IHS 2000–2009, 6
US, general population
25% male, 55±21 41,504 (2,490) 64%,75, CLIA ,38 vs 75 1.3 BP 140/90 0.62 (0.53–0.73) Age, gender, season, HTN
treatment, diabetes status Jorde et al (2010),25
Tromsø Study 1994–2008, 7
Norway, general population
35% male, 50–74 1,268 (331) 54±16, CLIA ,41 vs 63 14 BP 140/90 0.99 (0.76 –1.28) Age, gender, BMI, PA, season,
HTN treatment Kim et al (2010),26
Chungju city 2003–2007, 6
Korea, general population
38% male, 66±9 1,330 (851) 47, CLIA ,20 vs 89 4 BP 140/90 0.47 (0.27–0.82) Age, gender, BMI, PA, season,
HTN treatment Margolis et al (2012),27
wHI 1993–1998, 5
US, general population
100% female, 50–79 2,153 (891) 54%,50, CLIA ,34 vs 65 7 BP 140/90 0.86 (0.60–1.23) Age, BMI, PA, ethnicity, season,
HTN treatment, diabetes status Gagnon et al (2012),28
Aus-Diab 2000–2005, 7
Australia, general population
50% male, 25–75+ 4,164 (1,291) 68, RIA ,45 vs 85 5 BP 130/85 0.71 (0.51–0.98) Age, gender, PA, ethnicity,
season, diabetes status wang et al (2013),29
PHS 1982–2009, 5
US, physicians 100% male, 40–84 660 (367) 73±26, RIA ,50 vs 100 15 Self-report 0.94 (0.69–1.27) Age, BMI, PA, ethnicity, season,
HTN treatment, diabetes status Ke et al (2013),30
ATBC 1985–1993, 4
Finland, general population
100% male (smokers), 50–69
1,957 (252) 69%,50, RIA ,25 vs 80 4 BP 140/90 1.00 (0.60–1.50) Age, BMI, PA, season
van Ballegooijen et al (2014),31 MeSA 2000–2002, 5
US, general population
47% male, 45–84 3,002 (1,229) 31%,50, HPLC ,50 vs 75 9 BP 140/90 0.81 (0.71–0.93) Age, gender, BMI, PA, ethnicity,
season, HTN treatment
Note: †Quality score based on Newcastle–Ottawa Scale.
Abbreviations: NHS2, Nurses’ Health Study 2; HPFS, Health Professional Follow-up Study; MBHMS, Michigan Bone Health and Metabolism Study; IHS, Intermountain
Healthcare System; wHI, women’s Health Initiative; Aus-Diab, Australian Diabetes, Obesity and Lifestyle Study; PHS, Physicians’ Health Study; ATBC, Alpha-Tocopherol, Beta-Carotene Cancer Prevention Study; MeSA, Multi-ethnic Study of Atherosclerosis; SD, standard deviation; 25OHD, 25-hydroxyvitamin D; RR, relative risk; CI, confidence interval; RIA, radioimmunoassay; US, United States; BMI, body mass index; PA, physical activity; BP, blood pressure; HTN, hypertension; CLIA, chemiluminescence immunoassay.
only reported a linear association between 25OHD and blood pressure and as such, was not included in the for-mal meta-analysis but is reported in Table 5. In summary, Table 1 presents ten prospective studies with aggregate data on 58,262 nonoverlapping participants and 8,213 incident hypertension cases as potentially relevant for the present meta-analysis.
Thus, Table 1 and Figure 2A include two cohort studies24,25 and eight prospective studies,22,23,26–31 which
were cohort studies in design but only reported base-line 25OHD levels and subsequent future hypertension incidence.
Of these ten studies, two studies25,30 also reported
base-line as well as follow-up cross-sectional categorical data from the same cohort data, which were included in the cross-sectional meta-analysis (Tables 3 and 4). Four other studies reported baseline 25OHD data in linear format from these cohorts,23,26,27,29 and these data are reported in
Table 5.
Table 1 provides details of the eligible studies that evalu-ated vitamin D status and the RRs of hypertension incidence. Six studies22–24,27,29,31 were carried out in the US, two studies
were conducted in Europe,25,30 and two26,28 were conducted
in the Asia Pacific region including Australia.28 Most of the
study samples were from general populations.23–28,30,31 In
two studies, populations were recruited from nurses, health professionals, or physicians22,29 and in one study, the
popu-lation were male smokers.30 The age of participants ranged
from 25 years to 85 years (mean age =55 years), and more than half of the studies22,24–26,28,31 sampled included both male
and female. Ascertainment of hypertension was mostly by measuring blood pressure,23–28,30,31 and the follow-up period
ranged from 1.3 years to 15 years. Table 1 also provides assay characteristics of measured levels of 25OHD from studies contributing to the analyses; five studies22,23,28–30 used the
radioimmunoassay (RIA) method, four24–27 used the
chemi-luminescence immunoassay (CLIA), and only one31 used
the gold standard “high-pressure liquid chromatography” (HPLC) analysis.
vitamin D status and risk
of hypertension – prospective studies
subgroup analysis
When studies were stratified by quality score, the RRs were significant for studies rated higher than 5 (RR =0.67 (0.51–0.88)) but were not significant for studies rated 5
Integrated Blood Pressure Control downloaded from https://www.dovepress.com/ by 118.70.13.36 on 22-Aug-2020
Dovepress
Ke et al
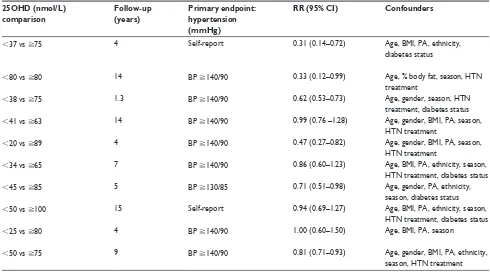
Table 2 Prospective studies: mixed-effect meta-analysis 25OHD and hypertension stratification
Stratification Sample size Risk of hypertension associated with high 25OHD
Heterogeneity (I2)
Total 58,262 0.76 (0.63–0.90)* 67.05*
Journal quality
High (score =6 or 7) 48,679 0.67 (0.51–0.88)* 37.62
Low (score ,6 points) 9,583 0.86 (0.71–1.05) 68.67*
Demographic
Age
Older (55 years old) 51,874 0.81 (0.67–0.98)* 70.04*
Younger (,55 years old) 6,388 0.48 (0.26–0.89)* 55.64
Gender
Both (female and male) 51,268 0.74 (0.59–0.94)* 71.78*
Female 3,764 0.55 (0.28–1.08) 58.31
Male 3,230 0.88 (0.57–1.36) 44.20
Country region
Asia Pacific 5,494 0.62 (0.42–0.90)* 36.50
europe 3,225 0.99 (0.79–1.25) 0.00
US 49,543 0.73 (0.57–0.93)* 73.95*
ethnicity
Asian 1,330 0.47 (0.27–0.82)* 0.00
Caucasian 53,930 0.76 (0.61–0.94)* 65.99*
Multi-ethnic groups (US) 3,002 0.89 (0.76–1.05) 0.00
Vitamin D
vitamin D levels
High (50 nmol/L) 53,707 0.73 (0.59–0.90)* 68.90*
Low (,50 nmol/L) 4,555 0.81 (0.53–1.24) 66.24
High age, low 25OHD
No 53,707 0.73 (0.59–0.90)* 68.90*
Yes 4,555 0.81 (0.53–1.24) 66.24
Season
No season 1,811 0.31 (0.14–0.72)* 0.00
Seasons 56,451 0.78 (0.66–0.93)* 64.88*
Assay method
CLIA 46,255 0.73 (0.54–0.99)* 75.78*
HPLC 3,002 0.89 (0.76–1.05) 0.00
RIA 9,005 0.71 (0.50–1.00) 59.06*
Hypertension
Hypertension self-report
No 55,791 0.76 (0.63–0.92)* 66.90*
Yes 2,471 0.58 (0.20–1.69) 83.11*
Antihypertensive treatment
No 49,436 0.66 (0.51–0.87)* 54.57
Yes 8,826 0.85 (0.70–1.01) 44.52
Confounders
BMI
No 48,670 0.63 (0.55–0.73)* 0.00
Yes 9,592 0.81 (0.66–0.98)* 53.78*
PA
No 41,917 0.58 (0.39–0.84)* 19.00
Yes 16,345 0.82 (0.69–0.97)* 48.15
Diabetes
No 7,970 0.82 (0.63–1.05) 55.94
Yes 50,292 0.71 (0.56–0.90)* 63.02*
Note: *Significance P,0.05.
Abbreviations: 25OHD, 25-hydroxyvitamin D; US, United States; CLIA, chemiluminescence immunoassay; HPLC, high-pressure liquid chromatography; RIA,
radio-immunoassay; BMI, body mass index; PA, physical activity.
(RR =0.86 (0.71–1.05)). There was no statistically sig-nificant heterogeneity among studies rated higher than 5 (I2=37.62, P.0.05), but significant heterogeneity was
found among studies rated 5 (I2=68.67, P,0.05). Detailed
results when studies were stratified by demographic factors
(age, gender, country region, and ethnicity), vitamin D fac-tors (vitamin D levels, season, assay methods), hypertension (measured or self-report, history of anti-hypertensive use), and confounders (BMI, PA, and diabetes status) are given in Table 2 and Figure 2A–D.
Integrated Blood Pressure Control downloaded from https://www.dovepress.com/ by 118.70.13.36 on 22-Aug-2020
Dovepress 25OHD and blood pressure: a meta-analysis and systematic review
Characteristics of included studies –
cross-sectional studies
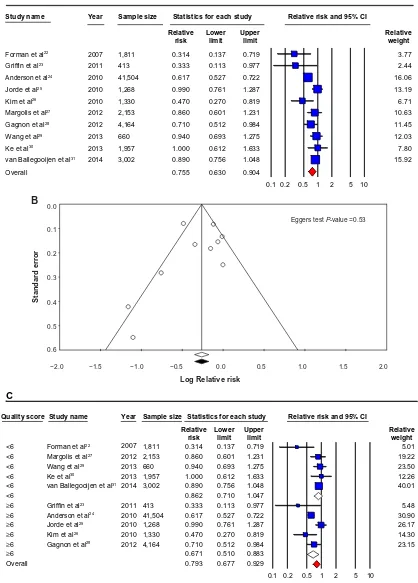
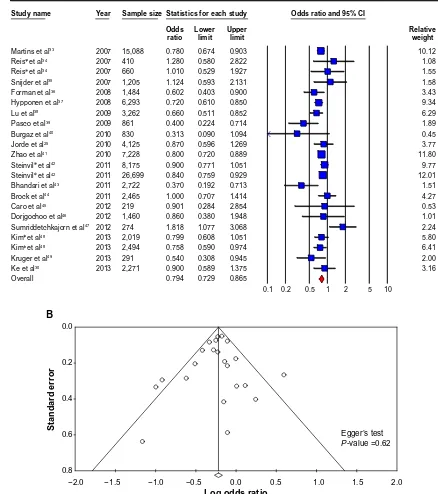
The pooled OR-estimated risk of hypertension (primary end-point) for the highest vs the lowest category of blood 25OHD concentrations was 0.79 (0.73–0.87) (Figure 3A). There was statistically significant heterogeneity among all cross-sectional studies (I2=45.37, P,0.05). The Egger’s test based
on all included studies showed no evidence of publication bias for blood 25OHD concentrations and hypertension (P=0.62), together with the funnel plot shown in Figure 3B.
Twenty-seven cross-sectional studies were identified, of which 1925,30,33–49 were included in this formal meta-analysis
(Tables 3 and 4 and Figure 3A). Of these 19 cross-sectional studies, one study48 also reported linear results that are
reported in Table 5. The remaining extracted cross-sectional studies only reported 25OHD estimates in linear fashion and thus were not included in the formal meta-analysis but are reported in Table 5.29,48,50–57
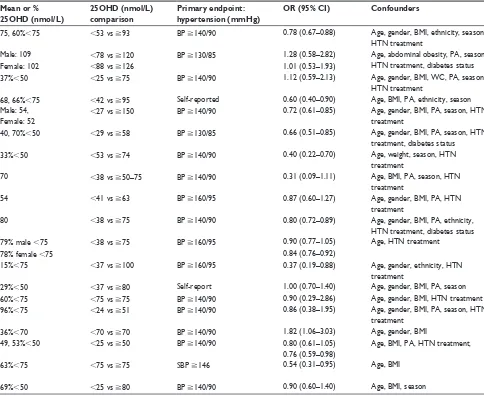
In summary, Tables 3 and 4 represent 19 cross-sectional studies with aggregate data on 90,535 nonover-lapping participants. Tables 3 and 4 provide details of the eligible studies that evaluated vitamin D status and the ORs of hypertension. Six studies were carried out in the US,33,34,36,41,43,44 five studies in Europe,25,30,35,37,40 five studies
in the Asia Pacific38,39,46–48 (including one in Australia39), one
in Middle-East,42 one in Puerto Rico,45 and one in South
Africa.49 Sixteen studies were recruited from the general
population,37–44,46,48,49 and two studies were sampled from
either clinic attendees45 or factory employees.47 The age
of participants ranged from 18 years to 92 years, and only five studies were of one gender,30,36,39,40,49 and the majority
were mixed. Ascertainment of hypertension was mostly by measuring blood pressure and in only two studies,36,44 it was
from self-report.
Tables 3 and 4 also provides assay characteristics of measured levels of 25OHD from studies contributing to the analyses. Nine cross-sectional studies30,33,38,39,41,42,44,47,48 used
the RIA method, six cross-sectional studies used CLIA or electro-chemiluminescence immunoassay,25,34–36,45,46 one used
enzyme-linked immunosorbent assay,37 one used Nichols
Advantage,43 one used Roche Elecsys,49 and one used HPLC40
for blood 25OHD analyses.
vitamin D status and risk
of hypertension – cross-sectional
studies subgroup analysis
When studies were stratified by quality score, the ORs were significant for studies rated 5 (OR =0.71 (0.61–0.83))
and 6 (OR =0.79 (0.73–0.87)) but were not significant for studies rated 4 (OR =0.87 (0.75–1.01)). There was no statistically significant heterogeneity among studies rated at 4 (I2=46.13, P.0.05), 5 (I2=39.34, P.0.05), or
6 (I2=0.00, P.0.05). Detailed results when studies were
stratified by demographic factors (age, gender, country region, and ethnicity), vitamin D factors (vitamin D levels, seasons, and assay methods), hypertension (measured or self-report, history of anti-hypertensive use), and confound-ers (BMI, PA, and diabetes status) are given in Table 4 and Figure 3A–D.
Discussion
Physiology of vitamin D
In humans, vitamin D is normally obtained from skin through the action of ultraviolet B irradiation on 7-dehydrocholesterol.58 It is further metabolized to 25OHD,
the major circulating vitamin D compound, and then to 1,25-dihydroxyvitamin D (1,25D), the hormonal form.4–6,9
The major function of vitamin D compounds is to enhance active absorption of ingested calcium (and phosphate). This assists in building bone at younger ages and ensures that bone does not need to be resorbed to maintain blood calcium concentrations. As there are vitamin D receptors in most nucleated cells, including vascular smooth muscle cells, as well as in macula densa and juxtaglomerular cells,59,60 vitamin D compounds appear to have direct effects
to improve bone and muscle function, and there is good, though not entirely consistent, evidence that supplemental vitamin D and calcium together reduce falls and fractures in older individuals.61 Based on calcium control and
mus-culoskeletal function, target levels of 25OHD in blood are at least 50–60 nmol/L, and there may be a case for higher targets of 75–80 nmol/L.10,11
Summary and comparison
with other meta-analyses
The overall results from this recent meta-analysis and systematic review are that from a total of 148,797 healthy participants (58,262 prospective; 90,535 cross-sectional) from general population samples across the world (pub-lished between 2007 and early 2014), lower 25OHD levels appear to be associated with increased hypertension levels (prospective analyses: RR =0.76 (0.63–0.90); cross-sectional analyses: OR =0.79 (0.73–0.87)). These updated results report similar findings published by Kunutsor et al for prospective studies in 2013 (RR =0.70 (0.58–0.86))8
and for cross-sectional studies by Burgaz et al in 2011 (OR =0.73 (0.63–0.84)).7
Integrated Blood Pressure Control downloaded from https://www.dovepress.com/ by 118.70.13.36 on 22-Aug-2020
Dovepress
Ke et al
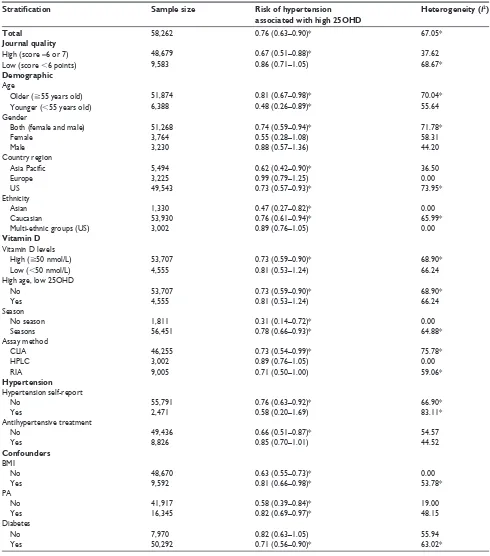
Table 3 Characteristics of cross-sectional studies
Author (year),reference study and year of conduct, quality score†
Country, study sample Gender, age range or mean ± SD (years)
Sample size, assay Mean or %
25OHD (nmol/L)
25OHD (nmol/L) comparison
Primary endpoint: hypertension (mmHg)
OR (95% CI) Confounders
Martins et al (2007),33 NHANeS 1988–1994, 6 US, general population 48% male, 20–80 15,088, RIA 75, 60%,75 ,53 vs 93 BP 140/90 0.78 (0.67–0.88) Age, gender, BMI, ethnicity, season,
HTN treatment
Reis et al (2007),34 RBS 1997–1999, 5 US, general population 38% male, 44–96 1,070, CLIA Male: 109 ,78 vs 120 BP 130/85 1.28 (0.58–2.82) Age, abdominal obesity, PA, season,
HTN treatment, diabetes status
Female: 102 ,88 vs 126 1.01 (0.53–1.93)
Snijder et al (2007),35 LASA 1996, 6 The Netherlands, general population
50% male, 55–85 1,205, CLIA 37%,50 ,25 vs 75 BP 140/90 1.12 (0.59–2.13) Age, gender, BMI, wC, PA, season,
HTN treatment
Forman et al (2008),36 NHS2 1997–1999, 4 US, nurses 100% female, 32–52 1,484, CLIA 68, 66%,75 ,42 vs 95 Self-reported 0.60 (0.40–0.90) Age, BMI, PA, ethnicity, season
Hypponen et al (2008),37 1958 BBC 2002–2004, 5 UK, general population 48% male, 45–47 6,293, eLISA Male: 54,
Female: 52
,27 vs 150 BP 140/90 0.72 (0.61–0.85) Age, gender, BMI, PA, season, HTN treatment
Lu et al (2009),38 NHAPC, 2005, 5 People’s Republic of China, general population
44% male, 50–70 3,262, RIA 40, 70%,50 ,29 vs 58 BP 130/85 0.66 (0.51–0.85) Age, gender, BMI, PA, season, HTN
treatment, diabetes status
Pasco et al (2009),39 GOS 1994–1997, 5 Australia, general population 100% female, 20–92 861, RIA 33%,50 ,53 vs 74 BP 140/90 0.40 (0.22–0.70) Age, weight, season, HTN
treatment
Burgaz et al (2010),40 ULSAM 1991–1995, 6 Sweden, general population 100% male, 71±0.6 830, HPLC/MS 70 ,38 vs 50–75 BP 140/90 0.31 (0.09–1.11) Age, BMI, PA, season, HTN
treatment
Jorde et al (2010),25 Tromsø Study 2008, 4 Norway, general population 37% male, 25–84 4,125, eCLIA 54 ,41 vs 63 BP 160/95 0.87 (0.60–1.27) Age, gender, BMI, PA, HTN
treatment
Zhao et al (2010),41 NHANeS 2003–2006, 6 US, general population 49% male, 20 7,228, RIA 80 ,38 vs 75 BP 140/90 0.80 (0.72–0.89) Age, gender, BMI, PA, ethnicity,
HTN treatment, diabetes status Steinvil et al (2011),42 Maccabi Healthcare
Services 2001–2008, 4
Israel, general population 23% male, 55±17 34,874, RIA 79% male ,75 ,38 vs 75 BP 160/95 0.90 (0.77–1.05) Age, HTN treatment
77% female, 55±15 78% female ,75 0.84 (0.76–0.92)
Bhandari et al (2011),43 KPSCHP 2004–2006, 5 US, general population 31% male, .59 2,722, Nichols Advantage 15%,75 ,37 vs 100 BP 160/95 0.37 (0.19–0.88) Age, gender, ethnicity, HTN
treatment
Brock et al (2011),44 PLCO 1993–2001, 4 US, general population 53% male, 55–74 2,465, RIA 29%,50 ,37 vs 80 Self-report 1.00 (0.70–1.40) Age, gender, BMI, PA, season
Caro et al (2012),45 no name and year, 4 Puerto Rico, clinic subjects 15% male, 21–50 219, CLIA 60%,75 ,75 vs 75 BP 140/90 0.90 (0.29–2.86) Age, gender, BMI, HTN treatment
Dorjgochoo et al (2012),46 SwHS 1997–2000, SMHS 2002–2006, 4
People’s Republic of China, general population
28% male, 40–75 1,460, CLIA 96%,75 ,24 vs 51 BP 140/90 0.86 (0.38–1.95) Age, gender, BMI, PA, season, HTN
treatment
Sumriddetchkajorn et al (2012),47 no name 1997, 4 Thailand, factory employees 14% male, 35–54 274, RIA 36%,70 ,70 vs 70 BP 140/90 1.82 (1.06–3.03) Age, gender, BMI
Kim et al (2013),48 KNHANeS 2009–2010, 5 Korea, general population 45% male, 50–90 4,513, RIA 49, 53%,50 ,25 vs 50 BP 140/90 0.80 (0.61–1.05) Age, BMI, PA, HTN treatment,
0.76 (0.59–0.98) Kruger et al (2013),49 PURe 2005, 4 South Africa, general
population
100% female, 58±9 291, Roche elecsys 63%,75 ,75 vs 75 SBP 146 0.54 (0.31–0.95) Age, BMI
Ke et al (2013),30 ATBC 1985–1993, 4 Finland, general population 100% male (smoker), 50–69 2,271, RIA 69%,50 ,25 vs 80 BP 140/90 0.90 (0.60–1.40) Age, BMI, season
Note: †Quality score based on Newcastle–Ottawa Scale.
Abbreviations: NHANeS, National Health and Nutrition examination Survey; RBS, Rancho Bernardo Study; LASA, Longitudinal Aging Study Amsterdam; NHS2, Nurses’
Health Study 2; BBC, British Birth Cohort; NHAPC, Nutrition and Health of Aging Population in China; GOS, Geelong Osteoporosis Study; ULSAM, Uppsala Longitudinal Study of Adult Men; KPSCHP, Kaiser Permanente Southern California Health Plan; PLCO, Prostate, Lung, Colorectal and Ovarian Cancer Screening Trial; SwHS, Shanghai women’s Health Study; SMHS, Shanghai Men’s Health Study; KNHANeS, Korea National Health and Nutrition examination Survey; PURe, Prospective Urban Rural epidemiology Study; ATBC, Alpha-Tocopherol, Beta-Carotene Cancer Prevention Study; SD, standard deviation; 25OHD, 25-hydroxyvitamin D; OR, odds ratio; CI, confidence interval; RIA, radioimmunoassay; US, United States; UK, United Kingdom; BP, blood pressure; BMI, body mass index; HTN, hypertension; CLIA, chemiluminescence immunoassay; PA, physical activity; wC, waist circumference; eLISA, enzyme-linked immunosorbent assay; HPLC, high-pressure liquid chromatography; MS, mass spectrometry; eCLIA, electro-chemiluminescence immunoassay; SBP, systolic blood pressure.
In addition, our systematic review of 172,259 participants and 38 studies concurs with observations from the above meta-analyses in that 60% of studies reported a significant inverse association between blood 25OHD and hypertension. Of these, 40% were reported from prospective studies (Table 1), 56% from cross-sectional studies (Table 3), and 64% from those studies that reported linear associations of 25OHD with hypertension (Table 5).
It should be noted that mostly these effects were of a small magnitude and have not been confirmed in results from RCTs.14 Probably, because of these facts and other
even less-convincing data from mortality studies62,63 and
other CVD outcomes,4–6,9 critics have hypothesized that
observational associations may be due to an associa-tion between low vitamin D and general “ill health”,64
a conclusion observational studies cannot fully address due to their study design. Thus, the major criticism of observational studies is that results may be due to reverse causality (such as already unwell participants) and/or unmeasured bias or confounding (such as obesity and lack of PA), which RCTs attempt to take into account by randomization. This review has attempted to address
Integrated Blood Pressure Control downloaded from https://www.dovepress.com/ by 118.70.13.36 on 22-Aug-2020
Dovepress 25OHD and blood pressure: a meta-analysis and systematic review
Table 3 Characteristics of cross-sectional studies
Author (year),reference study and year of conduct, quality score†
Country, study sample Gender, age range or mean ± SD (years)
Sample size, assay Mean or %
25OHD (nmol/L)
25OHD (nmol/L) comparison
Primary endpoint: hypertension (mmHg)
OR (95% CI) Confounders
Martins et al (2007),33 NHANeS 1988–1994, 6 US, general population 48% male, 20–80 15,088, RIA 75, 60%,75 ,53 vs 93 BP 140/90 0.78 (0.67–0.88) Age, gender, BMI, ethnicity, season,
HTN treatment
Reis et al (2007),34 RBS 1997–1999, 5 US, general population 38% male, 44–96 1,070, CLIA Male: 109 ,78 vs 120 BP 130/85 1.28 (0.58–2.82) Age, abdominal obesity, PA, season,
HTN treatment, diabetes status
Female: 102 ,88 vs 126 1.01 (0.53–1.93)
Snijder et al (2007),35 LASA 1996, 6 The Netherlands, general population
50% male, 55–85 1,205, CLIA 37%,50 ,25 vs 75 BP 140/90 1.12 (0.59–2.13) Age, gender, BMI, wC, PA, season,
HTN treatment
Forman et al (2008),36 NHS2 1997–1999, 4 US, nurses 100% female, 32–52 1,484, CLIA 68, 66%,75 ,42 vs 95 Self-reported 0.60 (0.40–0.90) Age, BMI, PA, ethnicity, season
Hypponen et al (2008),37 1958 BBC 2002–2004, 5 UK, general population 48% male, 45–47 6,293, eLISA Male: 54,
Female: 52
,27 vs 150 BP 140/90 0.72 (0.61–0.85) Age, gender, BMI, PA, season, HTN treatment
Lu et al (2009),38 NHAPC, 2005, 5 People’s Republic of China, general population
44% male, 50–70 3,262, RIA 40, 70%,50 ,29 vs 58 BP 130/85 0.66 (0.51–0.85) Age, gender, BMI, PA, season, HTN
treatment, diabetes status
Pasco et al (2009),39 GOS 1994–1997, 5 Australia, general population 100% female, 20–92 861, RIA 33%,50 ,53 vs 74 BP 140/90 0.40 (0.22–0.70) Age, weight, season, HTN
treatment
Burgaz et al (2010),40 ULSAM 1991–1995, 6 Sweden, general population 100% male, 71±0.6 830, HPLC/MS 70 ,38 vs 50–75 BP 140/90 0.31 (0.09–1.11) Age, BMI, PA, season, HTN
treatment
Jorde et al (2010),25 Tromsø Study 2008, 4 Norway, general population 37% male, 25–84 4,125, eCLIA 54 ,41 vs 63 BP 160/95 0.87 (0.60–1.27) Age, gender, BMI, PA, HTN
treatment
Zhao et al (2010),41 NHANeS 2003–2006, 6 US, general population 49% male, 20 7,228, RIA 80 ,38 vs 75 BP 140/90 0.80 (0.72–0.89) Age, gender, BMI, PA, ethnicity,
HTN treatment, diabetes status Steinvil et al (2011),42 Maccabi Healthcare
Services 2001–2008, 4
Israel, general population 23% male, 55±17 34,874, RIA 79% male ,75 ,38 vs 75 BP 160/95 0.90 (0.77–1.05) Age, HTN treatment
77% female, 55±15 78% female ,75 0.84 (0.76–0.92)
Bhandari et al (2011),43 KPSCHP 2004–2006, 5 US, general population 31% male, .59 2,722, Nichols Advantage 15%,75 ,37 vs 100 BP 160/95 0.37 (0.19–0.88) Age, gender, ethnicity, HTN
treatment
Brock et al (2011),44 PLCO 1993–2001, 4 US, general population 53% male, 55–74 2,465, RIA 29%,50 ,37 vs 80 Self-report 1.00 (0.70–1.40) Age, gender, BMI, PA, season
Caro et al (2012),45 no name and year, 4 Puerto Rico, clinic subjects 15% male, 21–50 219, CLIA 60%,75 ,75 vs 75 BP 140/90 0.90 (0.29–2.86) Age, gender, BMI, HTN treatment
Dorjgochoo et al (2012),46 SwHS 1997–2000, SMHS 2002–2006, 4
People’s Republic of China, general population
28% male, 40–75 1,460, CLIA 96%,75 ,24 vs 51 BP 140/90 0.86 (0.38–1.95) Age, gender, BMI, PA, season, HTN
treatment
Sumriddetchkajorn et al (2012),47 no name 1997, 4 Thailand, factory employees 14% male, 35–54 274, RIA 36%,70 ,70 vs 70 BP 140/90 1.82 (1.06–3.03) Age, gender, BMI
Kim et al (2013),48 KNHANeS 2009–2010, 5 Korea, general population 45% male, 50–90 4,513, RIA 49, 53%,50 ,25 vs 50 BP 140/90 0.80 (0.61–1.05) Age, BMI, PA, HTN treatment,
0.76 (0.59–0.98) Kruger et al (2013),49 PURe 2005, 4 South Africa, general
population
100% female, 58±9 291, Roche elecsys 63%,75 ,75 vs 75 SBP 146 0.54 (0.31–0.95) Age, BMI
Ke et al (2013),30 ATBC 1985–1993, 4 Finland, general population 100% male (smoker), 50–69 2,271, RIA 69%,50 ,25 vs 80 BP 140/90 0.90 (0.60–1.40) Age, BMI, season
Note: †Quality score based on Newcastle–Ottawa Scale.
Abbreviations: NHANeS, National Health and Nutrition examination Survey; RBS, Rancho Bernardo Study; LASA, Longitudinal Aging Study Amsterdam; NHS2, Nurses’
Health Study 2; BBC, British Birth Cohort; NHAPC, Nutrition and Health of Aging Population in China; GOS, Geelong Osteoporosis Study; ULSAM, Uppsala Longitudinal Study of Adult Men; KPSCHP, Kaiser Permanente Southern California Health Plan; PLCO, Prostate, Lung, Colorectal and Ovarian Cancer Screening Trial; SwHS, Shanghai women’s Health Study; SMHS, Shanghai Men’s Health Study; KNHANeS, Korea National Health and Nutrition examination Survey; PURe, Prospective Urban Rural epidemiology Study; ATBC, Alpha-Tocopherol, Beta-Carotene Cancer Prevention Study; SD, standard deviation; 25OHD, 25-hydroxyvitamin D; OR, odds ratio; CI, confidence interval; RIA, radioimmunoassay; US, United States; UK, United Kingdom; BP, blood pressure; BMI, body mass index; HTN, hypertension; CLIA, chemiluminescence immunoassay; PA, physical activity; wC, waist circumference; eLISA, enzyme-linked immunosorbent assay; HPLC, high-pressure liquid chromatography; MS, mass spectrometry; eCLIA, electro-chemiluminescence immunoassay; SBP, systolic blood pressure.
some of these issues by stratification and sensitivity analyses.
Quality of included studies
When prospective studies were stratified by the journal qual-ity ratings score ($6 vs lower),19 the association between
low 25OHD and increased hypertension was both significant and not heterogeneous in the better-quality studies23–26,28
(score $6, RR =0.67 (0.51–0.88); score ,6, RR =0.86 (0.71–1.05)) (Figure 2C). A similar pattern occurred in cross-sectional studies, although the effect was not quite as marked in that all the studies remained significant in their category and also had no heterogeneity, but the “higher
quality” 33,35,40,41 studies showed a stronger association
between lower 25OHD levels and hypertension vs “moderate quality”34,37–39,43,48 (score =6, OR =0.79 (0.73–
0.87); score =5, OR =0.72 (0.65–0.80); score =4, OR =0.86 (0.80–0.93)) (Figure 3C).
Heterogeneity and publication bias
As with the previous meta-analyses, there was no publica-tion bias reported, probably due to the strict criteria used for selecting the studies to be used. However, in contrast to the two previous meta-analysis,7,8 which reported no heterogeneity
in their results, this present meta-analysis reported hetero-geneity among studies of blood 25OHD concentrations and
Integrated Blood Pressure Control downloaded from https://www.dovepress.com/ by 118.70.13.36 on 22-Aug-2020
Dovepress
Ke et al
Table 4 Cross-sectional studies: mixed-effect meta-analysis 25OHD and hypertension stratification
Stratification Sample size Risk of hypertension associated with high 25OHD
Heterogeneity (I2)
Total 90,535 0.79 (0.73–0.87)* 45.37*
Journal quality
High (score =6) 23,521 0.79 (0.73–0.87)* 0.00
Middle (score =5) 23,676 0.71 (0.61–0.83)* 39.43
Low (score =4) 43,338 0.87 (0.75–1.01) 46.13
Demographic
Age
Older (55 years old) 18,736 0.79 (0.70–0.89)* 0.00
Younger (,55 years old) 71,799 0.79 (0.70–0.88)* 63.83*
Gender
Both (female and male) 42,881 0.81 (0.71–0.93)* 57.76*
Female 33,540 0.72 (0.59–0.87)* 45.96
Male 14,114 0.86 (0.75–0.99)* 6.68
Country region
Asia Pacific 10,370 0.78 (0.59–1.04) 70.21*
europe 14,724 0.79 (0.65–0.95)* 17.93
US 35,384 0.79 (0.68–0.91)* 3.39
Others 30,057 0.85 (0.78–0.93)* 44.10
ethnicity
Asian 9,509 0.85 (0.65–1.12) 66.10*
Caucasian 20,604 0.79 (0.55–0.95)* 42.63
Multi-ethnic groups (US) 17,810 0.58 (0.28–1.18) 78.86*
Others 42,612 0.83 (0.78–0.89)* 0.00
Vitamin D
vitamin D level
High (50 nmol/L) 76,408 0.78 (0.71–0.86)* 46.98*
Low (,50 nmol/L) 14,127 0.85 (0.70, 1.05) 49.38
High age, low 25OHD
No 78,166 0.79 (0.71–0.88)* 57.63*
Yes 12,369 0.81 (0.70–0.94)* 0.00
Season
No season 55,107 0.80 (0.71–0.91)* 56.60*
Season 35,428 0.77 (0.69–0.86)* 23.45
Assay method
CLIA 9,563 0.84 (0.68–1.05) 0.00
eLISA 6,293 0.72 (0.61–0.85)* 0.00
HPLC 830 0.31 (0.09–1.09) 0.00
Nichols Advantage 2,722 0.37 (0.19–0.71)* 0.00
RIA 70,836 0.82 (0.78–0.87)* 53.90*
Roche 291 0.54 (0.31–0.95)* 0.00
Hypertension
Hypertension self-report
No 86,586 0.79 (0.73–0.87)* 45.61*
Yes 3,949 0.78 (0.48–1.29) 71.50*
Antihypertensive treatment
No 6,785 0.88 (0.61–1.28) 71.95*
Yes 83,750 0.79 (0.73–0.85)* 31.37
Confounders
BMI
No 37,596 0.81 (0.66–0.99)* 70.32*
Yes 52,939 0.79 (0.71–0.87)* 39.00*
PA
No 56,600 0.79 (0.67–0.94)* 67.71*
Yes 33,935 0.78 (0.72–0.84)* 1.63
Diabetes status
No 74,462 0.80 (0.70–0.90)* 55.87*
Yes 16,073 0.79 (0.72–0.86)* 0.00
Note: *Significance P,0.05.
Abbreviations: 25OHD, 25-hydroxyvitamin D; US, United States; CLIA, chemiluminescence immunoassay; eLISA, enzyme-linked immunosorbent assay; HPLC,
high-pressure liquid chromatography; RIA, radioimmunoassay; BMI, body mass index; PA, physical activity.
Integrated Blood Pressure Control downloaded from https://www.dovepress.com/ by 118.70.13.36 on 22-Aug-2020
Dovepress 25OHD and blood pressure: a meta-analysis and systematic review
Study name Year Sample size Statistics for each study Relative risk and 95% CI
Relative weight Upper limit Lower limit Relative risk 2007 2011 Forman et al22
Griffin et al23 Anderson et al24 Jorde et al25 Kim et al26 Margolis et al27 Gagnon et al28 Wang et al29 Ke et al30
van Ballegooijen et al31
Overall 0.630
0.1 0.2 0.5 1 2 5 10
2010 2010 2010 2012 2012 2013 2013 2014 1,811 413 41,504 1,268 1,330 2,153 4,164 660 1,957 3,002 0.314 0.333 0.617 0.990 0.470 0.860 0.710 0.940 1.000 0.890 0.137 0.113 0.527 0.761 0.270 0.601 0.512 0.693 0.612 0.756 0.719 0.977 0.722 1.287 0.819 1.231 0.984 1.275 1.633 1.048 0.755 0.904 15.92 7.80 12.03 11.45 10.63 6.71 13.19 16.06 2.44 3.77 A
Quality score Study name Year Sample size Statistics for each study Relative risk and 95% CI
<6
0.1 0.2 0.5 1 2 5 10
C <6 <6 <6 <6 <6 ≥6 ≥6 ≥6 ≥6 ≥6 ≥6 Overall
Forman et al22 Margolis et al27 Wang et al29 Ke et al30
van Ballegooijen et al31
Griffin et al23 Anderson et al24 Jorde et al25 Kim et al26 Gagnon et al28
2007 2012 2013 2013 2014 2010 2010 2010 2011 2012 1,811 41,504 660 1,330 1,268 413 2,153 4,164 1,957 3,002 0.314 0.333 0.617 0.990 0.470 0.860 0.710 0.940 1.000 0.890 0.793 0.862 0.671 Upper limit Lower limit Relative risk 0.677 0.137 0.113 0.510 0.761 0.270 0.527 0.710 0.601 0.512 0.693 0.612 0.756 0.719 0.977 1.047 0.722 1.287 0.819 1.231 0.984 1.275 1.633 1.048 0.929 0.883 23.15 14.30 26.17 30.90 5.48 40.01 12.26 23.50 19.22 5.01 Relative weight
Figure 2 (Continued)
−2.0 0.0
0.1
Eggers test P-value =0.53
0.2 0.3 0.4 0.5 0.6 Standard error
Log Relative risk
B 2.0 1.5 1.0 0.5 0.0 −0.5 −1.0 −1.5
hypertension (in both prospective and cross-sectional studies) (Tables 2 and 4). The previous meta-analyses restricted their study selection to defined populations (eg, primarily Cauca-sian from either Europe or the US). The heterogeneity reported
in the present meta-analysis is probably due to the wide scope of the literature search in demographic range (age, gender, country location, and ethnicity) of the studies assessed and also the different 25OHD assay technologies used.
Integrated Blood Pressure Control downloaded from https://www.dovepress.com/ by 118.70.13.36 on 22-Aug-2020
Dovepress
Ke et al
Age and gender Study name Year Sample size Relative risk and 95% CI
0.1 0.2 0.5 1 2 5 10
D
Older female Older female Older female Older female Older female Older female Older female Older female Older female Younger female Younger female Younger female Young both gender Young both gender Overall
Gagnon et al28 Griffin et al23 Forman et al22 van Ballegooijen et al31 Ke et al30
Wang et al29 Margolis et al27 Forman et al22 Anderson et al24 Jorde et al25 Kim et al26
2007
2012 2013 2013
2014
2011 2007 2010 2010 2010
2012
1,198 41,504
1,330 1,268
2,153
1,957 3,002 660 613
413
4,164
0.617 0.990 0.470 0.860 0.940 1.000 0.890 0.798
0.333
0.710 0.710 0.741 0.356 0.375 0.163
0.270 0.761 0.527 0.026
0.601 0.693 0.612 0.756 0.654
0.113 0.147
0.176 0.512 0.512 0.629
0.721
0.984 0.874 0.984 0.977 0.952 0.972 1.275 1.633 1.048 0.819 1.011
1.231
Upper limit Lower
limit Relative
risk Relativeweight
1.287 0.722
1.11
9.35 14.44
19.13
57.10 19.31
42.90 15.85 8.04 12.76
100.00
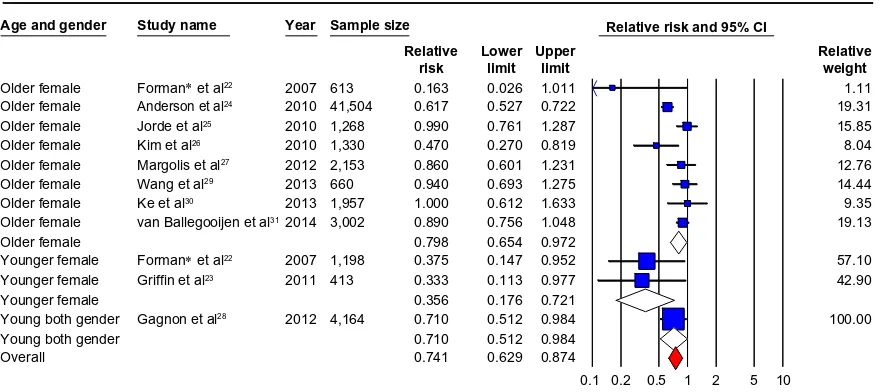
Figure 2 Prospective studies.
Notes: (A) Prospective studies of vitamin D and hypertension risk: the effect of higher vitamin D (measured as quartiles of 25OHD) on hypertension risk expressed as relative
risk (RR) for individual studies (blue) and the calculated overall RR (red). (B) Funnel plot showing standard error by log RR for the prospective studies. (C) Prospective studies
of vitamin D and hypertension risk sub-groups: the effect of higher vitamin D (measured as quartiles of 25OHD) on hypertension risk stratified by quality score expressed as RR for individual studies (blue), sub-groups total (white) and the calculated overall RR (red). (D) Prospective studies of vitamin D and hypertension risk sub-groups: the
effect of higher vitamin D (measured as quartiles of 25OHD) on hypertension risk stratified by age and gender expressed as RR for individual studies (blue), sub-group total (white) and the calculated overall RR (red). *Studies published in one paper.
Abbreviation: CI, confidence Interval.
Demography and ethnicity
The age range in this review was 18–96, and the effect of low 25OHD on hypertension remained significant in both younger and older strata and somewhat surprisingly, was markedly stronger in those aged ,55, and in females in prospective and cross-sectional data (Figures 2D and 3D).
When it was possible to investigate gender sepa-rately, heterogeneity disappeared in both prospective and cross-sectional studies, but the associations became nonsignif icant in the prospective studies, probably due to lower sample sizes. Females did seem to have a greater degree of association of hypertension risk with low vitamin D, especially at a younger age. This is puzzling as one would not expect younger females to have increased risk of hypertension, but increasingly younger females are being reported to be at risk for vitamin D def iciency, particularly in Asian popula-tions.65 These findings need to be further investigated;
our recent data from Macau also confirm this risk in younger women.66,67
When investigated by region or country of the study population, countries from Europe and the US were more similar (ie, less heterogeneity) than those from other regions of the world; previous meta-analyses have concentrated on these countries. In this meta-analysis, the effect of vitamin D deficiency on hypertension was
attenuated in the European studies compared to the total risk estimate and was, in fact, non-significant from pro-spective data. When ethnicity was investigated, those of “multi-ethnic group” ethnicities did not show an effect compared with others; as Burgaz et al7 noted, there is
evidence that vitamin D synthesis is less efficient among individuals with greater skin pigmentation,68,69 but
varia-tions in culturally preferred covering of skin by clothing could also be an explanation for these findings.70 More
studies in different cultures are needed to disentangle these findings.
Measurement of blood pressure variables
Only three studies included in the present meta-analysis have used self-reported hypertension as outcomes (two in prospective22,27 and one in cross-sectional44), which
can only give a crude estimate of average blood pres-sure. In our stratified analysis, the effect was attenuated when studies took account of measured blood pressure, but the negative association between decreased 25OHD and hypertension remained significant. In addition, taking into account the use of antihypertensive treatments is an important confounder; two prospective studies22,30 and five
cross-sectional studies30,36,44,47,49 did not have this variable;
in our stratified analysis, the effect was attenuated when studies took account of antihypertensive medication, but
Integrated Blood Pressure Control downloaded from https://www.dovepress.com/ by 118.70.13.36 on 22-Aug-2020
Dovepress 25OHD and blood pressure: a meta-analysis and systematic review
Study name Year Sample size Statistics for each study Odds ratio and 95% CI
2007
660 15,088 410
0.794
0.1 0.2 0.5 1 2 5 10
A
Martins et al33 Reis et al34 Reis et al34 Snijder et al35 Forman et al36 Hypponen et al37 Lu et al38 Pasco et al39 Burgaz et al40
Sumriddetchkajorn et al47 Kim et al48
Kim et al48 Kruger et al49 Dorjgochoo et al46 Zhao et al41 Jorde et al25
Steinvil et al42 Bhandari et al43 Brock et al44 Caro et al45 Steinvil et al42
2007 2007 2007 2008 2008 2009 2009 2010 2010 2010 2011 2011 2011 2011 2012 2012 2012 2013 2013 2013 2013 830 861 1,205 1,484 6,293 3,262 4,125 7,228 8,175 26,699 2,722 219 2,465 2,271 291 1,460 2,019 2,494 274 Odds
ratio Lowerlimit Upperlimit Relativeweight
1.010 0.780 1.280 0.313 0.400 1.124 0.602 0.720 0.660 0.870 0.800 0.900 0.840 0.370 0.901 1.000 0.900 0.540 0.860 0.799 0.758 1.818 0.529 0.674 0.580 0.090 0.224 0.593 0.403 0.610 0.511 0.596 0.720 0.771 0.759 0.192 0.284 0.707 0.589 0.308 0.380 0.608 0.590 1.077 1.927 0.903 2.822 1.094 0.714 2.131 0.900 0.850 0.852 1.269 0.889 1.051 0.929 0.713 2.854 1.414 1.375 0.945 1.948 1.051 0.974 3.068 1.55 10.12 1.08 0.45 1.89 1.58 3.43 9.34 6.29 3.77 11.80 9.77 12.01 1.51 0.53 4.27 3.16 2.00 1.01 5.80 6.41 2.24 0.865 0.729 Ke et al30
Overall
−2.0 −1.5 −1.0 −0.5 0.0 0.5 1.0 1.5 2.0
0.0 0.2 0.4 0.6 0.8 S ta nd ar d er ro r
Log odds ratio
B
Egger’s test P-value =0.62
Figure 3 (Continued)
the negative association between decreased 25OHD and hypertension remained significant, and in addition, studies which took account of blood pressure medications did not have heterogeneity.
Measurement of 25OHD levels
There has been debate over the measurement of 25OHD in blood samples and its variability.58 HPLC has been
considered the “gold standard” but as can be seen in the present stratifications, RIA was by far the most com-monly used method. There were differences between these methods, which could well explain some of the heterogeneity detected in our meta-analyses. A recent paper has reported good similarity between these various methods,71 and with the exception of HPLC, all assay
methods produced significant associations.
Integrated Blood Pressure Control downloaded from https://www.dovepress.com/ by 118.70.13.36 on 22-Aug-2020
Dovepress
Ke et al
Quality score Study name Year Sample size Statistics for each study Odds ratio and 95% CI
Forman et al36 Steinvil et al42 Steinvil et al42 Brock et al44 Caro et al45 Dorjgochoo et al46 Sumriddetchkajorn et al47 Kruger et al49
Ke et al30
Reis et al34 Reis et al34 Hypponen et al37 Lu et al38 Pasco et al39 Burgaz et al40 Jorde et al25 Bhandari et al43 Kim et al48 Kim et al48
Martins et al33 Snijder et al35 Zhao et al41
0.1 0.2 0.5 1 2 5 10 C 4.00 4.00 4.00 4.00 4.00 4.00 4.00 4.00 4.00 4.00 5.00 5.00 5.00 5.00 5.00 5.00 5.00 5.00 5.00 5.00 5.00 6.00 6.00 6.00 6.00 Overall Odds
ratio Lowerlimit Upperlimit Relativeweight
2008 2011 2011 2011 2012 2012 2012 2013 2013 2007 2007 2008 2009 2009 2010 2010 2011 2013 2013 2007 2007 2010 1,484 8,175 26,699 2,465 219 1,460 274 291 2,271 410 660 6,293 3,262 861 830 4,125 2,722 2,019 2,494 15,088 1,205 7,228 0.403 0.771 0.759 0.707 0.284 0.380 1.077 0.308 0.589 0.751 0.580 0.529 0.610 0.511 0.224 0.090 0.596 0.192 0.608 0.590 0.613 0.674 0.593 0.720 0.733 0.744 0.900 1.051 0.929 1.414 2.854 1.948 3.068 0.945 1.375 1.012 2.822 1.927 0.850 0.852 0.714 1.094 1.269 0.713 1.051 0.974 0.829 0.903 2.131 0.889 0.869 0.849 9.68 24.15 28.42 11.82 1.59 3.02 6.51 5.83 8.99 3.27 4.65 22.16 16.24 5.58 1.40 10.50 4.53 15.18 16.49 33.76 1.77 64.47 0.602 0.900 0.840 1.000 0.901 0.860 1.818 0.540 0.900 0.872 1.280 1.010 0.720 0.660 0.400 0.313 0.870 0.370 0.799 0.758 0.713 0.780 1.124 0.800 0.798 0.795
Age and gender Study name Year Sample size Statistics for each study Odds ratio and 95% CI
0.1 0.2 0.5 1 2 5 10 D Older female Older female Older female Older female Older female Older female Older female Older female Older female Older female Older female Older female Older female Younger female Younger female Younger female Younger female Younger female Young both gender Young both gender Young both gender Young both gender Young both gender Young both gender Young both gender Young both gender Overall
Reis et al34 Reis et al34 Snijder et al35 Lu et al38 Burgaz et al40 Jorde et al25 Steinvil et al42 Dorjgochoo et al46 Dorjgochoo et al46 Kim et al48 Kim et al48 Ke et al30
Forman et al36 Pasco et al39 Steinvil et al42 Kruger et al49
Martins et al33 Hypponen et al37 Zhao et al41 Bhandari et al43 Brock et al44 Caro et al45
Sumriddetchkajorn et al47 2007 2007 2007 2009 2010 2010 2011 2012 2012 2013 2013 2013 2008 2009 2011 2013 2007 2008 2010 2011 2011 2012 2012 410 660 1,205 3,262 830 4,125 8,175 409 1,051 2,019 2,494 2,271 1,484 861 26,699 291 15,088 6,293 7,228 2,722 2,465 219 274 1.280 1.010 1.124 0.660 0.313 0.870 0.900 0.420 1.070 0.799 0.758 0.900 0.828 0.602 0.400 0.840 0.540 0.618 0.780 0.720 0.800 0.370 1.000 0.901 1.818 0.818 0.812 0.580 0.529 0.593 0.511 0.090 0.596 0.771 0.120 0.309 0.608 0.590 0.589 0.751 0.403 0.224 0.759 0.308 0.437 0.674 0.610 0.720 0.192 0.707 0.284 1.077 0.692 0.749 2.822 1.927 2.131 0.852 1.094 1.269 1.051 1.470 3.707 1.051 0.974 1.375 0.912 0.900 0.714 0.929 0.945 0.875 0.903 0.850 0.889 0.713 1.414 2.854 3.068 0.966 0.881 1.49 2.24 2.28 14.32 0.60 6.56 38.85 0.60 0.61 12.44 14.81 5.21 25.27 18.55 37.00 19.18 23.75 22.58 26.03 5.28 12.88 1.95 7.52 Odds
ratio Lowerlimit Upperlimit Relativeweight
Figure 3 Cross-sectional studies.
Notes: (A) Cross-sectional studies of vitamin D and hypertension risk: the effect of higher vitamin D (measured as quartiles of 25OHD) on hypertension risk expressed as
odds ratio (OR) for individual studies (blue) and the calculated overall OR (red). (B) Funnel plot showing standard error by log OR for the cross-sectional studies. (C)
Cross-sectional studies of vitamin D and hypertension risk sub-groups: the effect of higher vitamin D (measured as quartiles of 25OHD) on hypertension risk stratified by quality score expressed as OR for individual studies (blue), sub-group total(white) and the calculated overall OR (red). (D) Cross-sectional studies of vitamin D and hypertension
risk sub-groups: the effect of higher vitamin D (measured as quartiles of 25OHD) on hypertension risk stratified by age and gender expressed as OR for individual studies (blue), sub-groups total (white) and the calculated overall OR (red). *Studies published in one paper.
Abbreviation: CI, confidence Interval.
Integrated Blood Pressure Control downloaded from https://www.dovepress.com/ by 118.70.13.36 on 22-Aug-2020