18th International Conference on Structural Mechanics in Reactor Technology (SMiRT 18) Beijing, China, August 7-12, 2005 SMiRT18-H03-5
STUDY ON MATERIAL PROPERTIES IN ORDER TO APPLY FOR
STRUCTURAL ANALYSIS OF TURBINE GENERATOR FOUNDATION
AFFECTED BY ALKALI-SILICA REACTION
Hiroshi SHIMIZU
*Mitsubishi Heavy Industries,LTD.
Phone: +81 794 45 9713,
Fax: +81 794 45 6945
E-mail: [email protected]
Yuichi WATANABE
Shikoku Electric Power Co.,Inc.
Tatsuya ISHIKAWA
Shikoku Electric Power Co.,Inc.
Hisashi SEKIMOTO
Mitsubishi Heavy Industries,LTD.
Ryuichi OSHIMA
Mitsubishi Heavy Industries,LTD.
Katsuki TAKIGUCHI
Tokyo Institute of Technology
Yoshihiro MASUDA
Utsunomiya University
Isoharu NISHIGUCHI
Kanagawa Institute of Technology
ABSTRACT
It is well known that material properties (compressive strength, elastic modulus) of a concrete core specimen taken from a structure, which has been affected by alkali-silica reaction (ASR), are reduced significantly in comparison to those of sound concrete. On the other hand, in-situ tests of reinforcement concrete structures also affected by ASR are reported to show only insignificant reduction of rigidity and strength capacities of the structures. The difference of the affect of ASR on a core and a structure is understood to be occured due to pre-stress effect caused by ASR on the concrete. However, there are only a few reports which show a quantitative evaluation of this effect.
Material properties of concrete structure affected by ASR are studied quantitatively by literature review, in-situ tests of actual foundation and model tests.
Keywords: Alkali-silica reaction, Turbine generator foundation, Material properties of concrete, Reinforcement ratio
1. INTRODUCTION
Structural analysis to evaluate characteristics of a reinforced concrete structure requires material properties of concrete and rebar as input data. The data obtained from core specimen taken from the structure is the most adequate to get reliable result.
Therefore when performing the analysis of a structure affected by alkali-silica reaction (ASR), it also seems to be adequate to get material properties from core specimens. The material properties obtained from the core specimens of the ASR structure are well known to show significant reduction of strength and Elastic modulus in comparison to those of sound concrete.1)2)
difference from sound structure by pre-stress effect due to rebar restraint of confined concrete has been reported despite there is a reduction of the material properties mentioned above. Therefore to evaluate strength capability of the ASR structures analytically, modified material properties from those values obtained by core specimens should be used to consider the effect of such confinement on the structures adequately.
This report has been prepared with regard to the quantitative study to determine concrete material properties relating to rebar amount as a parameter to be used in the analysis of ASR structures, considering pre-stress effect of ASR, in another word, effect of rebar confinement of concrete by literature review, in-situ tests of actual TG foundation and model tests.
2. STUDY PROCEDURE
Reduction ratios of the material properties of the ASR concrete confined by rebar (compressive strength ratio and elastic modulus ratio of ASR concrete to sound concrete) have been studied using five methods indicated on Table 1.
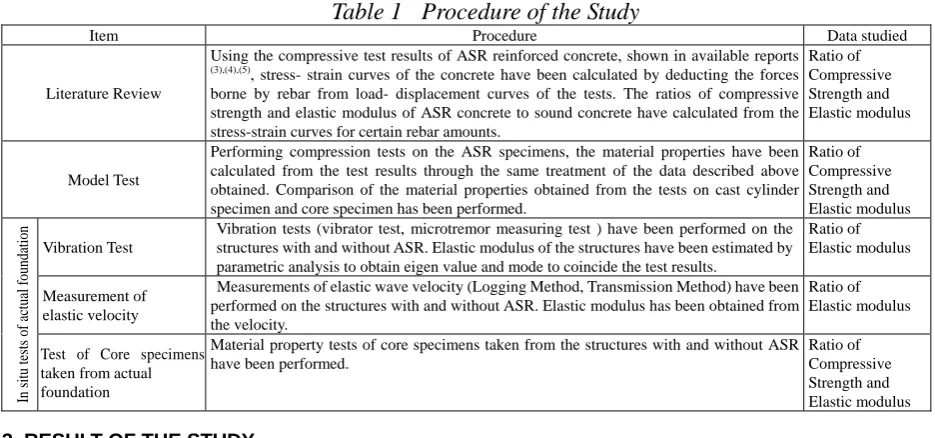
Table 1 Procedure of the Study
Item Procedure Data studied
Literature Review
Using the compressive test results of ASR reinforced concrete, shown in available reports
(3),(4),(5)
, stress- strain curves of the concrete have been calculated by deducting the forces borne by rebar from load- displacement curves of the tests. The ratios of compressive strength and elastic modulus of ASR concrete to sound concrete have calculated from the stress-strain curves for certain rebar amounts.
Ratio of Compressive Strength and Elastic modulus
Model Test
Performing compression tests on the ASR specimens, the material properties have been calculated from the test results through the same treatment of the data described above obtained. Comparison of the material properties obtained from the tests on cast cylinder specimen and core specimen has been performed.
Ratio of Compressive Strength and Elastic modulus
Vibration Test
Vibration tests (vibrator test, microtremor measuring test ) have been performed on the structures with and without ASR. Elastic modulus of the structures have been estimated by parametric analysis to obtain eigen value and mode to coincide the test results.
Ratio of Elastic modulus
Measurement of elastic velocity
Measurements of elastic wave velocity (Logging Method, Transmission Method) have been performed on the structures with and without ASR. Elastic modulus has been obtained from the velocity.
Ratio of Elastic modulus
In s
itu tes
ts
of actual foundation
Test of Core specimens taken from actual foundation
Material property tests of core specimens taken from the structures with and without ASR have been performed.
Ratio of Compressive Strength and Elastic modulus
3. RESULT OF THE STUDY
3.1 LITERATURE REVIEW
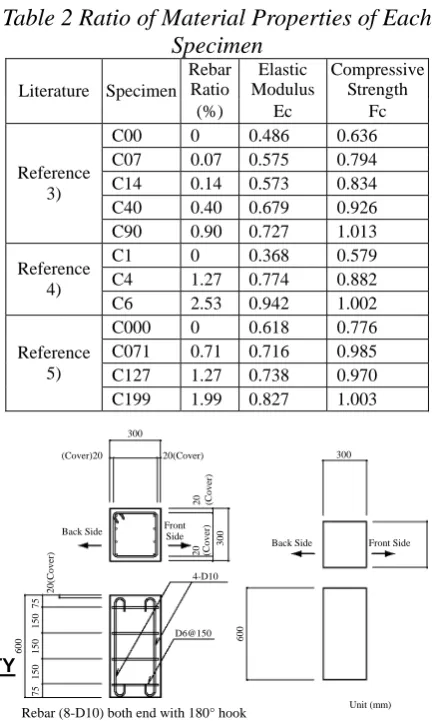
Evaluation on reduction ratios of material properties relating to amount of rebar, obtained from the model test results shown in article 3), 4) and 5) has been undertaken. Fig.1 shows the test model described in the articles.
Calculation method is also shown in Appendix 1. As a result of the study the material properties (reduction ratio of the properties) of each ASR test specimen are indicated in Table 2.
100
100
Rebar Concrete
40
Steel plate As indicated in the table, the ratios of the
material properties obtained by the specimens including ones without reinforcement shows that values of the ratio of compressive strength and elastic modulus increases in accordance with the increase of the ratio of reinforcement steel and reaches to the values of sound concrete.
Fig.1 Test Model
3.2 MODEL TESTS
Evaluations on the material properties obtained by the Model Tests have been performed.
test specimen with a diameter of 100mm and a height of 200mm. Comparison of the properties obtained by the specimens with and without ASR has been done.
The results of the tests are shown in Table 3. RC members are rectangular specimens with reinforcement ratio of 0.63%. Plain concrete members are rectangular specimens with same size of RC members.
The ratio of the material properties calculated from the results of RC member tests are 0.82 for compressive strength, and 0.49 for elastic modulus , respectively. These values are slightly higher than those values obtained by plain concrete specimens such as plain concrete member specimen, core specimens and test cylinders, which are 0.63~0.76 for compressive strength and 0.34~0.45 for elastic modulus.
Fig.2 Test Apparatus of Comperssive Test
Cross Head
10kN Test Machine
Test Specimen 300×300×600
Bearing Mat
600
600
600 80
80
1250
625 625
3.3 VIBRATION TEST OF FOUNDATIONS
Table 2 Ratio of Material Properties of Each
Specimen
Rebar Ratio
Elastic Modulus
Compressive Strength Literature Specimen
Evaluation on the material properties obtained by the vibration tests of actual TG foundation and simulation analysis of those test results has been done. Following two vibration tests have been performed on the actual TG foundation indicated in Fig.4.
(%) Ec Fc
C00 0 0.486 0.636
C07 0.07 0.575 0.794
C14 0.14 0.573
Vertical vibration test of the beams.
Fig4. shows one example of vibrator point and accelerometer points.
0.834
C40 0.40 0.679 0.926
Reference 3)
C90 0.90 0.727 1.013
C1 0 0.368 0.579
C4 Microtremor measurement of the foundation.
Microtremor was mesuread by accelerometers attached joints of columns and beams.
Because the vibration characteristic of TG foundation measured by the tests are affected by elastic modulus of both table deck portion with significant ASR and column intermediate beam portion without ASR, following two simulation analyses have been done to determine the elastic modulus of the structure.
method to assume ratio of the material properties(0.5 and 0.8)
method to assume 0.9 time of elastic modulus of sound concrete
Ratios of the elastic modulus calculated by the analyses are shown in Table 4. The elastic modulus of TG foundations with ASR are 0.5~0.6 times of them without ASR
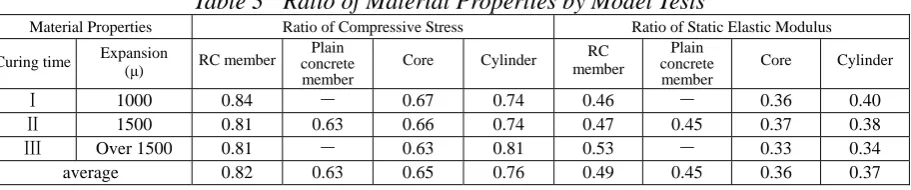
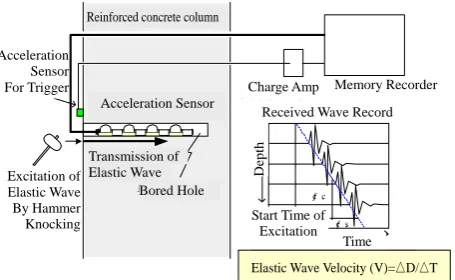
3.4 MEASUREMENT OF ELASTIC WAVE VELOCITY
Material properties obtained from the measurement of elastic wave velocity of the actual TG foundation have been evaluated.
For the tests to measure the elastic wave velocity, two method such as LoggingMethod and Transmission
1.27 0.774 0.882
Reference 4)
C6 2.53 0.942 1.002
C000 0 0.618 0.776
C071 0.71 0.716 0.985
C127 1.27 0.738 0.970
Reference 5)
C199 1.99 0.827 1.003
600
300
Back Side 300
(Cover)20
20 (Cover)
20(Cover)
20(C
over)
Fig.3 Dimension and Rebar Arrangement of
Member Specimens
300
20 (Cover)
4-D10
D6@150
600
75
150
150
150
75
Rebar (8-D10) both end with 180° hook
Back Side FrontSide
Front Side
Table 3 Ratio of Material Properties by Model Tests
Material Properties Ratio of Compressive Stress Ratio of Static Elastic Modulus
Curing time Expansion (μ) RC member concrete Plain member
Core Cylinder RC
member
Plain concrete member
Core Cylinder
Ⅰ 1000 0.84 - 0.67 0.74 0.46 - 0.36 0.40
Ⅱ 1500 0.81 0.63 0.66 0.74 0.47 0.45 0.37 0.38
Ⅲ Over 1500 0.81 - 0.63 0.81 0.53 - 0.33 0.34
average 0.82 0.63 0.65 0.76 0.49 0.45 0.36 0.37
Method have been performed as indicated in Fig.5.
The ratios of the elastic modulus obtained by the tests are indicated in Table 5.
Ratios of elastic modulus are evaluated as a ratio of the elastic modulus of table deck portion with ASR to the modulus of sound portion (average value of elastic modulus at column
measuring points). As a result of the evaluation the elastic modulus of the TG foundation with ASR has been found to be approximately 0.7 times of the sound TG foundation without ASR.
3.5 TEST OF CORE SPECIMENS TAKEN FROM STRUCTURE
Material properties obtained from the test of core specimens taken from the actual TG foundation have been evaluated.
Uni-axial compressive strength and static elastic modulus have been measured from twelve locations indicated in Fig.6.
The ratios of the material properties have been obtained by making the average of the material properties of the table deck portion as the material property of ASR concrete and the average of the material properties of the column portion as the material property of sound concrete.
The ratios of the material properties obtained by the tests are indicated in Table 6. The elastic modulus of the core taken from the concrete with ASR is 0.67 times of the sound concrete. The compressive strength of the core taken from the concrete with ASR is 0.95 times of the sound concrete.
4. EVALUATION
As results of the tests described in chapter 3, Fig.7 shows the ratio of the compressive strength, Fig.8 shows the ratio of the elastic modulus.
Table Deck (EL+17.2m)
First Basement (EL+4.2m)
EL-1.5m
Base Mat (EL-1.5m) Generator Side
Turbine Side
Location of Vibrator (vertical vibration)
8
B D
X
Y
Intermediate
7 6 5
4 3
Vibrator point (vertical vibration)
:Vibrator point
:Accelerometer point
Fig.4 Location of a Vibrator and measurements
Table 4 Ratio of Material Properties by Vibration Tests
Test Beam
Vibration Test
Microtremor Measuring Ratio of Elastic
Modulus 0.53 0.58
Rebar Ratio 0.98 0.82
Based on the distributing tendency of the ratio of the material properties, evaluation of the ratios of the material properties obtained by the model tests and tests of actual TG foundation has been made.
Followings are found by this evaluation.
①The ratio of both compressive strength and elastic modulus of the concrete with ASR are relatively small compared to those of sound concrete when rebar ratio of the concrete is small. However, there is a tendency that when the rebar ratio becomes higher, those values become closer to the value of sound concrete.
Table 5 Ratio of Material Properties by
Measurement of Elastic Wave Velocity
Method Logging
Method
Transmission Method Ratio of Elastic
Modulus 0.75 0.69
“
S ‹Ø ƒR ƒ“ ƒN ƒŠ [ ƒg ’Œ ‘Ì
‰ Á ‘¬ “x ƒZ ƒ“ ƒT i ƒŠ ƒI ƒ“ PV90B‚¨ ‚æ ‚Ñ PV87j ƒ
g ƒŠ ƒK [ —p ‰ Á ‘¬ “x ƒZ ƒ“ ƒT
i ƒŠ ƒI ƒ“ PV90B ‚¨ ‚æ ‚Ñ PV87 j
ƒ n ƒ“ ƒ} ‘Å Œ‚ ‚É ‚æ ‚é
’ e « ”g ‚Ì ‹N U
’
e « ”g ‚Ì “` ”d Žó U ”g Œ` ‹L ˜^
‹
N U Žž ‰ “® “ž ’B Žž
“ ` ”d Žž ŠÔ ‚s Œ
ú ‚³ ‚c Žž ŠÔ
‰Á‘
¬“
x
U•
ƒ ` ƒƒ [ ƒW ƒA ƒ“ ƒv i ƒŠ ƒI ƒ“ UV06j
ƒ ƒ‚ ƒŠ ƒŒ ƒR [ ƒ_ i “ú ’u ƒ ƒ‚ ƒŠ ƒn ƒC ƒR [ ƒ_ 8842j
’
e « ”g ‘¬ “x (‚u ) Œú ‚³ (‚c )^ “` ”d Žž ŠÔ (‚s )
Acceleration Sensor For Trigger Excitation of Elastic Wave By Hammer Knocking
Reinforced concrete column
Transmission of Elastic Wave
Thickness D
Charge Amp Memory Recorder
Received Wave Record Acceleration Sensor Acceleratio n Amplitude Time Start Time
of ExcitationInitial Wave Arrival Time Transmitting Time T
Elastic Wave Velocity (V) = Thickness (D) / Transmitting Time(T) “
S ‹Ø ƒR ƒ“ ƒN ƒŠ [ ƒg ’Œ ‘Ì
②The ratios of compressive strength of the concrete are within a range of 0.58~0.82 without reinforcement, 0.8~1.0 with reinforcement of rebar ratio of 0.7% and no further increase with more reinforcement.
③The ratios of elastic modulus are distributed within upper and lower limit obtained by literature review and are within a range of 0.37~0.76 without reinforcement, 0.56~0.83 with reinforcement of rebar ratio of approximately 1.0% and a slight increase with more reinforcement.
5. CONCLUSION
The material properties of the reinforced concrete structure affected by ASR have been studied by literature review, model tests and tests of the actual TG foundation.
As a result of the study the values of compressive strength, elastic modulus to be used in the strength capacity analysis of ASR affected structure have been determined.
REFERENCES
1) Kobayashi K: ‘Load carrying capacity of the members and structures affected by alkali silica
reaction - beam members - ’, Concrete
Journal, Vol.24, No.11, P.70~78, 1986
2) Kobayashi K et al. : ‘Diagnosis of alkali silica reaction’, Morikita Shuppan Co. Ltd., P.42~44, 1991:
3) Koyanagi W et al. : ‘Restraint effect of ASR expansion in RC members with small reinforcement ratios’, Cement Science and Concrete Technology, No. 52, P.786~791, 1998 4) Tanahashi K et al. : ‘Structural behavior of RC beams and columns deteriorated by ASR’, Japan Concrete Institute Annual Reports Vol.18, No.1, P.843~848, 1996
5) Yamura K et al. : ‘Effect of Steel-Reinforcement on Alkali Silica Reaction of Concrete’, Journal of the Society of Materials Science, Japan ,
Vol.43, No.491, P.970~975, 1994
ƒ g ƒŠ ƒK [ —p
‰ Á ‘¬ “x ƒZ ƒ“ ƒT i ƒŠ ƒI ƒ“ PV90Bj
“ ƒ} ‘Å Œ‚ ‚É ‚æ ‚é
’ e « ”g ‚Ì ‹N U
’
e « ”g ‚Ì “` ”d
Ž ó U ”g Œ` ‹L ˜^
‹ N U Žž ƒ n ƒ Ž ž ŠÔ [“ x ƒ ` ƒƒ [ ƒW ƒA ƒ“ ƒv
i ƒŠ ƒI ƒ“ UV06j
ƒ ƒ‚ ƒŠ ƒŒ ƒR [ ƒ_
i “ú ’u ƒ ƒ‚ ƒŠ ƒn ƒC ƒR [ ƒ_ 8842j
’
e « ”g ‘¬ “x (‚u ) ƒ¢ ‚c ^ ƒ¢ ‚s
E ’† ‚R ¬ •ª ‰Á ‘¬ “x ƒZ ƒ“ ƒT
i ‚S ˜A ƒ{ ƒA ƒz [ ƒ‹ ƒs ƒb ƒN j Reinforced concrete column
Acceleration Sensor ƒ ¢ ‚s ƒ ¢ ‚c ƒ { [ ƒŠ ƒ“ ƒO E Acceleration Sensor
For Trigger Charge Amp Memory Recorder
Received Wave Record
Depth Transmission of Elastic Wave Excitation of Bored Hole Elastic Wave
By Hammer Start Time of
Excitation Knocking
Time
Elastic Wave Velocity (V)=△D/△T
Fig.5-2 Schematic Figure to Measure Elastic
Fig.5-1 Schematic Figure to Measure Elastic
Wave Velocity by Logging Method
Wave Velocity by Transmission Method
Locations of Core Samples
M3 M11 Turbine Side M6 Other than Table Deck Table Deck M10 G GEN Generator Mountain Side Side No1L1 No2L1 HP M4 Sea Side M9 M1 M2’ M1 M2 M2’ M3 T C G
Table Deck Other than Table Deck
T M2 M4 M6 M10 M11 M9 C Location Compressive Strength (N/mm2) Static Elastic Modulus (N/mm2) Location Compressive Strength (N/mm2) Static Elastic Modulus (N/mm2)
M1 24.7 14600 M9 40.4 30000
M2 27.0 15800 M10 31.7 24100
M2’ 23.4 14600 M11 29.8 25900
M3 33.5 13200 T 33.6 24600
M4 30.4 23700 C 30.0 19200
M6 29.8 26000 G 29.5 15200
Fig.6 Locations of Core Specimens and Test
Results
Properties
Compressive strength (N/mm2)
Static elastic Modulus (×104N/mm2)
Average of ASR concrete 28.8 1.67
Average of sound
concrete 30.4 2.49
Ratio of the properties 0.95 0.67
Rebar ratio 0.82 0.82
1.2
1.0
0.8
0.6
0.4
0.2
0.0 0.5 1.0 1.5 2.0 2.5
0.0
Fig.7 Relation rebar ratio vs. compressive strength of concrete
Ratio of Compressive S
trength
Rebar Ratio p (%)
Reference 3 Reference 4 Reference 5
Cylinder Core Member w/o rebar Member RC-1
2002 Core Measuring
Literature Review
Model Test
In-situ tests of actual foundation
1.2
APPENDIX 1 METHOD TO CALCULATE THE MATERIAL PROPERTIES OF THE ASR CONCRETE USING COMPRESSION TEST
Calculation of the material properties of the ASR concrete has been performed by following method.
①To select major data (load-displacement curve) of compression test on ASR concrete specimen from the literature.
②To establish mathematical model with parallel nonlinear springs to replace concrete and rebar of the test specimen respectively.
To perform the analysis of the specimen under uni-axial compression load and find the material property by which the analysis result fit the test data. By deducting the force born by rebar with definite material property from the total force and considering that remaining force is born by concrete, to assume stress strain relation of the concrete.
③To perform the analysis indicated in ② above for both sound concrete specimens and specimens affected by ASR at each rebar ratio level of the specimens and calculate the concrete material properties then determine α the ratio of the material property of the concrete affected by ASR to the sound concrete.
α=testEA / testEN (at Rebar Ratio p)
here A: ASR member N: sound member
ASR ƒ Rƒ “ƒ Nƒ Š [ƒ g• ¨ «“ Á «
0.0 0.5 1.0
0.0 1.0 2.0
“ S‹ Ø” ä p @i “j
’e
«
ŒW
”
ӊ
@
ƒ
¿
• ¶Œ £1 • ¶Œ £2 • ¶Œ £3
‰ × dP-• ψ ʃ Š ÖŒ W
• ψ ʃ  ‰ × dP
Ž ÀŒ ±Œ ‹‰ Ê
‰ ð ÍŒ ‹‰ Ê
Ec,Fc,ƒ Ãc ¨ ƒ Rƒ “ƒ Nƒ Š [ƒ gƒ oƒ l
Es,ƒ Ðy ¨ “ S‹ ؃ oƒ l
P-ƒ ‚ ªˆ ê’ v‚ ·‚ éƒ Rƒ “ƒ Nƒ Š [ƒ g• ¨ «
Ec,Fc,ƒ Ãc ‚ ÌŒ ˆ’ è
ˆ ³ k— Í
“ S‹ Ø” ä‚ É‰ ž‚ ¶‚ Ä CŒ ’‘ S• ” Þ‚ É
‚ ·‚ éASR • ‚ Ì• ¨ «” ä‚ ðŽ Z’ è
‘ Î ” Þ
” ñ üŒ `• À— ñ ƒ oƒ l‚ ðŽ g— p
“ S‹ ؃ oƒ l
ƒ Rƒ “ƒ Nƒ Š [ƒ g ƒ oƒ l
Test Result Load P-Disp.δRelation
Concrete Spring Non Linear Parallel Spring
Displacementδ
Rebar Spring
Material properties of ASR member
Ratio of E
lastic Modulus
α
1.0
0.5
0.0
0.0 1.0 2.0
Rebar Ratio p (%)
εc Є σ
Ec Fc
Concrete Spring Rebar Spring
Є σ
σy
Es Ec,Fc,εc →Concrete Spring
Es,σy →Rebar Spring
Calculate the ratio of material properties of ASR member to sound member for each rebar Ratio
Determine concrete material properties Ec,Fc,εc to meet P-δcurve
Reference 3 Reference 4 Reference 5
Compression Force Load P
Analysis Result
1.0
0.8
0.6
0.4
0.2
0.0 0.5 1.0 1.5 2.0 2.5
0.0
Fig.8 Relation rebar ratio vs. elastic modulus of concrete
Rebar Ratio p (%)Ratio of Elastic Modulus
Reference 3 Reference 4 Reference 5
Cylinder Core Member w/o rebar Member RC-1
2002 Core Measuring Beam Vibration Test Micro Tremolo Measuring Test Dynamic Wave
(Logging Method)
Dynamic Wave (Transmission Method)
Literature Review
Model Test