ISSN(Online): 2319-8753
ISSN (Print): 2347-6710
International Journal of Innovative Research in Science,
Engineering and Technology
(An ISO 3297: 2007 Certified Organization)
Vol. 4, Issue 5, May 2015
Fatigue Damage Estimation for a Fuselage
Structure with Multiple Cut-outs under Cyclic
Loading
Remya Varghese1, Manu Jayakumar2
M.Tech Scholar, School of Aeronautical Engineering, Hindustan University, Chennai, Tamil Nadu, India1 M.Tech Scholar, School of Aeronautical Engineering, Hindustan University, Chennai, Tamil Nadu, India2
ABSTRACT:Discontinuities are common in airframe structure. These lead to the emergence of stress concentration regions. This turns deliberately pronounced when airframe structure experiences fluctuating loads during flight. These elevated tensile stress locations undergoing fluctuating loads may lead to fatigue cracks. In case of situations where these cracks are unnoticed they could lead to catastrophic failure of the structure. So it is highly pertinent to involve in the stress analysis of a segment of the fuselage with multiple cut-outs and fatigue damage calculation due to fluctuating pressurization loads. The fatigue damage calculation requires constant amplitude S-N data for various stress ratios and local stress history at the stress concentration. Fatigue life prediction methodologies through damage calculation are empirical in nature and therefore require test validation. Here CATIA software is used for the modelling, MSC PATRAN is used for meshing the fuselage panel and stress analysis is carried out using MSC NASTRAN.
.
KEYWORDS:Fatigue, fuselage panel, stress concentration, stress analysis.
I. INTRODUCTION
The aerospace industry, since it attained completeness as a separate industry is always subjected to numerous challenges. These unidentified problems which emerged long back turned more pronounced when much attention is laid upon the performance and design criteria. Several researches and experimentations are going on to tackle down and reduce the impact of these undesirable phenomena on aircrafts and other flying vehicles. It is always a matter of interest to revert attention to one of these undesirable damage or failure inducers. Fatigue is a usual and frequent mode of failure that occurs in a component subjected to alternate and repeating loads. In general, it is the weakening of a material caused by repeatedly applied loads. Also it is the progressive and localized structural damage that occurs when a material is subjected to cyclic loading. The nominal maximum stress values that cause such damage may be much less than the strength of the material typically quoted as much less than the strength of the material typically quoted as the ultimate tensile stress limit, or the yield stress limit. Fatigue occurs when a material is subjected to repeated loading and unloading. If the loads are above a certain threshold, microscopic cracks will begin to form and leads to failure [1]. This undesirable event occurs based on the stress involved and the number of load cycles [3]. The fatigue varies on its nature as high cycle, low cycle and very high cycle based on this [5]. A drastic change can be noticed in the failure life when any stress concentration factors are present in the structure [2],[9]. The elevated stress in these regions can be found using suitable finite element techniques and related softwares [4],[17].
ISSN(Online): 2319-8753
ISSN (Print): 2347-6710
International Journal of Innovative Research in Science,
Engineering and Technology
(An ISO 3297: 2007 Certified Organization)
Vol. 4, Issue 5, May 2015
aluminium castings [10]. It is primarily due to the high strength-to-weight ratio associated. When the weight considerations are being fulfilled by these light metals, on the other hand it fails under repeated pressurization loads [8]. This fatigue cracks developed thereby is mainly due to intense hoop stress. Cabin pressure results in radial growth of the skin and this radial growth is resisted by frames and stringers giving local bending along the fastener lines. Fuselage skin panels are curved and these panels are under biaxial tension loading due to cabin pressure. The service life of components is estimated based upon the damage estimation occurring on it with respect to the flying environment [7],[12].
II. GEOMETRICCONFIGURATION
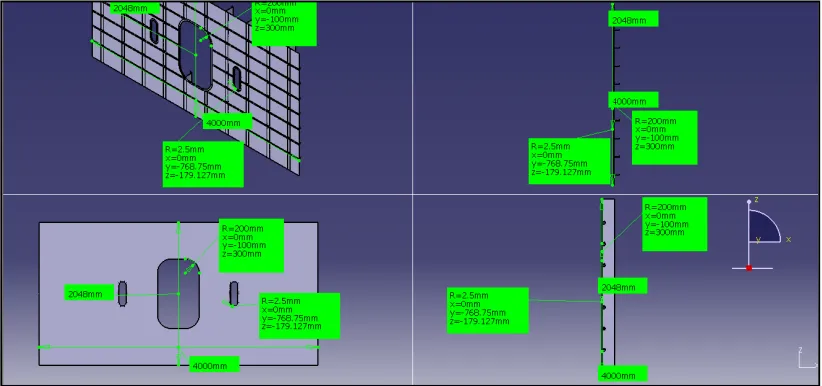
The geometric modelling of the fuselage with multiple cut-outs indicating bulkheads, stiffeners and rivets are carried out by using Catia. The cut-outs mentioned here refers to the openings for door and windows. The bulkheads serve to maintain the required external contour at the region and they provide rigidity and strength to the structure. For purposes of stabilizing the skin there are a multiplicity of stiffeners arranged orthogonally relative to one another. The stiffeners form a multiplicity of intersection regions, which in particular when using a differential form of construction represent weak points. Furthermore, as a result of their orthogonal arrangement relative to one another the stiffeners are not optimally orientated in terms of loading.. The Catia model representing the respective region is shown in figure 1. The view associated with all mentioned components are presented clearly with dimensions indicated. The tilt and front views are also given separately in figure.1.
Figure 1 :CAD model of fuselage panel with multiple cut outs
III.MATERIALSPECIFICATION
It should be really meticulous while selecting a material for a specific part of an aircraft. The selected material should mandatorily follow all the design guidelines and comply with the pertinent performance parameters. Weight and cost considerations coupled with the following features paved Aluminium 2024-T3 as the suitable material.
Density
Young’s modulus
Fatigue strength
Ultimate and Yield strength
ISSN(Online): 2319-8753
ISSN (Print): 2347-6710
International Journal of Innovative Research in Science,
Engineering and Technology
(An ISO 3297: 2007 Certified Organization)
Vol. 4, Issue 5, May 2015
The material properties with the corresponding magnitudes are indicated in Table.1. The Aluminium with low density is selected as it is always a matter of choice for the designer due to its light weight and good tensile and yield strength. The material constants and Poisson’s ratio with comparatively moderate values enable the analysis of 2024-T3 alloy easier when comparing to the other alloys of aluminium.
Table. 1: Material properties of Aluminium 2024-T3
Property Aluminium 2024-T3
Density 2.77 g/cm3
Ultimate Tensile Strength 483Mpa
Tensile Yield Strength 362Mpa
Young’s Modulus 72Gpa
Poisson’s Ratio 0.33
Material Constant, C 5 x 10-11
Material Constant, n 3
IV.MATHEMATICALFORMULATIONANDLOADCALCULATION
The formulation involves representation of loads acting on the fuselage panel. This incorporates skin, bulkheads and stiffeners. When the panel associated with all these members subjected to pressurization at high altitudes, certain stresses act upon it. The stresses are highly pronounced over here when a differential pressure prevails. When altitude increases the need for pressurization turns more pertinent and this in turn makes the differential pressure between inside of cabin and outside more noticeable. In this type of conditions, hoop stress which acts tangential to the structure plays a vital role and is considered for calculation. Here from the International Standard Atmosphere [21], the pressure loads acting are obtained. Here calculation is presented for a differential pressure of 9 psi and for the other load cases the summary is tabulated in table.2
Diameter of given cylindrical fuselage = 2690mm
Thickness of skin = 2mm Area of skin, Askin = 8000 mm2 Area of bulkhead, Abh= 452 mm2
Differential Pressure 9 psi = 0.0063kg/mm2
The hoop stress is given as, σhoop= (P*d)/ 2*t = 4.23675 kg/mm2
This stress is being acted upon the skin and bulkhead. In order to represent the load acting on skin and bulkhead separately, the following approach is used.
Skin : Stress= Load/Area
σhoop = 4.23675 kg/mm2,Askin=8000 mm2, then Load, P = 33894 kg
ISSN(Online): 2319-8753
ISSN (Print): 2347-6710
International Journal of Innovative Research in Science,
Engineering and Technology
(An ISO 3297: 2007 Certified Organization)
Vol. 4, Issue 5, May 2015
σhoop = 4.23675 kg/mm2,Abh=452 mm2 , then Load, P = 1915.011 kg
Total Load acting on 10 bulkheads = 1915.011 *10= 19150 kg
Table. 2 : Loads on skin and bulkhead for various differential pressures
Pressure
(psi)
Pressure
(kg/mm2)
Hoop stress,
σhoop= (P*d)/ 2*t (kg/mm2)
Load acting on the Skin,
P= σhoop * A (kg)
Load acting on 10 bulkheads
P= σhoop * A (kg)
6 0.0042 2.8245 22596 12766.74
6.5 0.00455 3.0598 24479 13830.64
7 0.0049 3.295 26362 14894.53
7.5 0.00525 3.5306 28245 15958.43
8 0.0056 3.766 30128 17022.32
8.5 0.00597 4 32000 18080
9 0.0063 4.236 33894 19150.11
The Table.2 provides a clear illustration of variation of loads acting on the components, namely skin and bulkheads for different pressure conditions. It is found that the hoop stress increases based on rise of pressure. This points out to the influence of pressure on hoop stress. The loads on skin and bulkheads increases with the rise in hoop stress.
V. FINITEELEMENTMODELOFAFUSELAGEPANELWITHMULTIPLECUT-OUTS
ISSN(Online): 2319-8753
ISSN (Print): 2347-6710
International Journal of Innovative Research in Science,
Engineering and Technology
(An ISO 3297: 2007 Certified Organization)
Vol. 4, Issue 5, May 2015
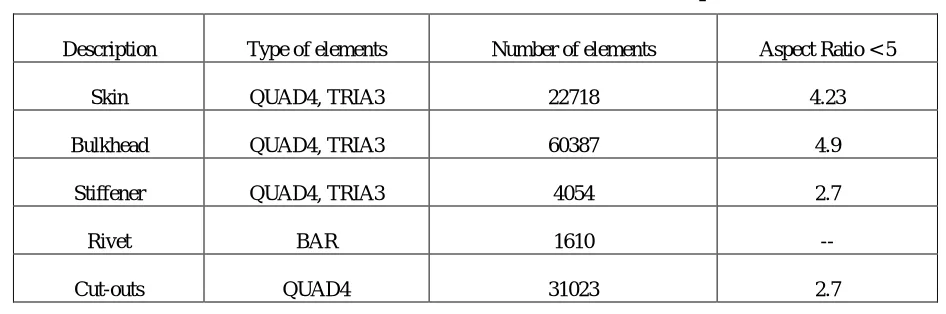
Figure 2 : Finite element meshing of fuselage panel with multiple cut-outs
The software used for analysis here is MSC NASTRAN. Finite element meshing is carried out for all the components of the panel. QUAD 4 and TRIA 3 elements are used for the purpose of meshing the structure. The representation is done with clear differentiation between cut-outs for door and windows.
Table 3 :Finite Element model summaries of the stiffened panel
Description Type of elements Number of elements Aspect Ratio < 5
Skin QUAD4, TRIA3 22718 4.23
Bulkhead QUAD4, TRIA3 60387 4.9
Stiffener QUAD4, TRIA3 4054 2.7
Rivet BAR 1610 --
Cut-outs QUAD4 31023 2.7
VI.LOADSANDBOUNDARYCONDITIONS
ISSN(Online): 2319-8753
ISSN (Print): 2347-6710
International Journal of Innovative Research in Science,
Engineering and Technology
(An ISO 3297: 2007 Certified Organization)
Vol. 4, Issue 5, May 2015
Figure 3: Loads and Boundary conditions applied to the stiffened panel
VII. STRESSANALYSISANDDISPLACEMENTS
Once the loads and boundary conditions are meticulously imparted on the model, it is subjected to stress analysis. The main objectives are to find out the magnitude of maximum stress and the stress concentration regions. Here loads are
given from 6psi to 9 psi and the maximum magnitude obtained is 24 kg/mm2 corresponding to 9 psi. Also the location
of stress concentration region remained sameand it is found around the bulkhead cut-out region. Here the stress analysis results corresponding to the maximum load of 9 psi is shown. When the stress concentrated region is examined specifically, the stress magnitude will be 24.236 kg/mm2.
ISSN(Online): 2319-8753
ISSN (Print): 2347-6710
International Journal of Innovative Research in Science,
Engineering and Technology
(An ISO 3297: 2007 Certified Organization)
Vol. 4, Issue 5, May 2015
The above figure illustrates the stress analysis of the selected structure and also indicates the location of maximum stress i.e. near the bulkhead cut-out. This can be referred as a stress concentration region, where stress accumulates as a result of discontinuities in the structure. The probability of crack occurrence is very high in this area.
VIII. DAMAGEESTIMATIONUSINGPRINCIPLESOFFATIGUE
The fatigue problem relating to metals has been investigated for more than a century. The failure occurs depending upon the total number of cycles and the stress involved. Based on this criteria the fatigue can be broadly categorized into low cycle ,high cycle and very high cycle fatigue. Also there are theories which state the probability of damage. Palmgren Miner’s rule states that where there are k different stress magnitudes in a spectrum, Si (1 ≤ i ≤ k), each contributing ni(Si) cycles, then if Ni(Si) is the number of cycles to failure of a constant stress reversal Si, failure occurs when:
C is experimentally found to be between 0.7 and 2.2. Usually for design purposes, C is assumed to be 1. For the case considered here, the different stress magnitudes are given in Table.2 and k=7. The calculation for 9 psi is shown below and the other cases are illustrated in Table. 4. It is obtained that the maximum stress value near the bulkhead cut-out is 24.236kg/mm2 or 34.622 ksi. To improve the accuracy of the calculations, correction factors are to be included. This
takes into account the irregularities and surface discontinuities. To calculate the value of stress amplitude (σamp), we make use of the maximum stress and correction factors.
Stress Concentration Factor : 1
Design Reliability : 0.897
Surface Roughness : 0.8
Then maximum stress incorporated with correction factors = 34.622/(0.897*0.8) = 48.2469 ksi. The stress amplitude
(σamp) is given by, (σamp) = (σmax – σmin)/2 = 24.1235 ksi. We have ni = 850 cycles ( for 9 psi). Then using constant-life diagram [22], the value of Ni is obtained as 90000 cycles.
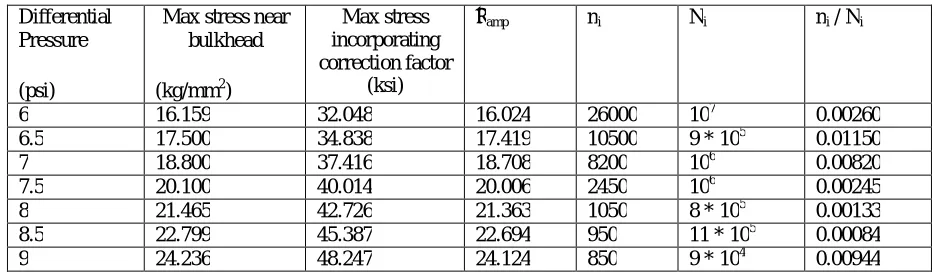
Table 5: Representation of stress amplitude calculation and corresponding life cycles
Differential Pressure
(psi)
Max stress near bulkhead
(kg/mm2)
Max stress incorporating correction factor
(ksi)
σamp ni Ni ni / Ni
6 16.159 32.048 16.024 26000 107 0.00260
6.5 17.500 34.838 17.419 10500 9 * 105 0.01150
7 18.800 37.416 18.708 8200 106 0.00820
7.5 20.100 40.014 20.006 2450 106 0.00245
8 21.465 42.726 21.363 1050 8 * 105 0.00133
8.5 22.799 45.387 22.694 950 11 * 105 0.00084
9 24.236 48.247 24.124 850 9 * 104 0.00944
ISSN(Online): 2319-8753
ISSN (Print): 2347-6710
International Journal of Innovative Research in Science,
Engineering and Technology
(An ISO 3297: 2007 Certified Organization)
Vol. 4, Issue 5, May 2015
Then, ∑( ni / Ni ) = 0.03637
According to Miner’s rule the design is safe if ∑(ni / Ni) <1. The condition is valid here and the material is safer to operate in the conditions selected for study.
IX.CONCLUSIONS
The study conducted here based on the fuselage panel with multiple cut-outs enabled to locate the region where stress is concentrated. This is found near the bulkhead cut-outs and the magnitude of maximum stress is 24.236 kg/mm2.
The damage estimation is done hereafter to investigate the structure is safe under the prevailing load conditions and cycles. It has been validated that the selected fuselage panel can accommodate the impact of load spectrum considered here.
Also a weight optimization is done so as to analyze the load baring capacity of a thinner panel. This has been validated by reducing the panel thickness from 2mm to 1mm keeping all other criterias and parameters same.
REFERENCES
[1] S.R. Ignatovich, A. Menou, M.V. Karuskevich, P.O. Maruschak, Fatigue damage and sensor development for aircraft structural health monitoring, Theoretical and Applied Fracture Mechanics, Volume 65, June 2013, Pages 23-27.
[2] M. Liakat, M.M. Khonsari, Entropic characterization of metal fatigue with stress concentration, International Journal of Fatigue, Volume 70, January 2015, Pages 223-234.
[3] A. Fatemi, L. Yang, Cumulative fatigue damage and life prediction theories: a survey of the state of the art for homogeneous materials, International Journal of Fatigue, Volume 20, Issue 1, January 1998, Pages 9-34.
[4] AdarshAdeppa, Patil M S and Girish K E, “Stress Analysis and Fatigue Life Prediction for Splice Joint in an Aircraft Fuselage through an FEM Approach”, International Journal of Engineering and Innovative Technology (IJEIT), (2012), Vol. 1, pp. 142-144.
[5] S.Q. Hou, X.J. Cai, J.Q. Xu, A life evaluation formula for high cycle fatigue under uniaxial and multiaxial loadings with mean stresses, International Journal of Mechanical Sciences, Volume 93, April 2015, Pages 229-239.
[6] Lech Dietrich, Joanna Radziejewska, The fatigue damage development in a cast Al–Si–Cu alloy, Materials & Design, Volume 32, Issue 1, January 2011, Pages 322-329.
[7] AyhanInce, Grzegorz Glinka, A generalized fatigue damage parameter for multiaxial fatigue life prediction under proportional and non-proportional loadings, International Journal of Fatigue, Volume 62, May 2014, Pages 34-41.
[8] Venkatesha B K, Prashanth K P & Deepak Kumar T, Investigation of Fatigue Crack Growth Rate in Fuselage of Large Transport Aircraft using FEA Approach, Global Journal of Researches in Engineering, Mechanical and Mechanics Engineering, Volume 14 Issue 1 Version 1.0 Year 2014. [9] Sartaj Patel, Mahesha.K, Harish E.R.M, Stress Analysis of Fuel Access Cut out of the
bottom skin of a transport aircraft, International Journal of Innovative Research in Science, Engineering and Technology Vol. 2, Issue 7, July 2013. [10] Q.G. Wang, D. Apelian, D.A. Lados, Fatigue behavior of A356-T6 aluminum cast alloys. Part 1: Effect of casting defects, J Light Met, 1 (2001), pp. 73–84.
[11] B.C. Li, C. Jiang, X. Han, New approach of fatigue life prediction for metallic materials under multiaxial loading, International Journal of Fatigue, 12 March 2015.
[12] Grigory I. Nesterenko, “Service life of airplane structures”, Central Aerohydrodynamic Institute (TsAGI), Russia, 2002.
[13] Pengfei Wang, Toshiyuki Takagi, Takanori Takeno, Hiroyuki Miki Early fatigue damage detecting sensors—A review and prospects, Sensors and Actuators A: Physical, Volume 198, 15 August 2013, Pages 46-60.
[14] P.D. Lee, A. Chirazi, D. See, Modelingmicroporosity in aluminum–silicon alloys: a reviewJ Light Met, 1 (2001), pp. 15–30.
[15] J. C. Newman, Jr, “Advances in fatigue and fracture mechanics analyses for aircraft structures”, Mechanics and Durability Branch, NASA Langley Research Center, USA.
[16] F.H.Darwish, G.M.Atmeh, Z. F. Hasan Design (2012) “Analysis and Modelling of a General Aviation Aircraft” Volume 6, Number 2, ISSN 1995-6665 Pages183 – 191.
[17] Lance Proctor et al, local analysis of fastener holes using the linear gap technology using MSC/NASTRAN, Presented at MSC Aerospace Users’ Conference, 2000, pp1-24.
[18] George Bibel, “Fuselage metal fatigue in large commercial aircraft”, Int. J. Forensic Engineering,volume 1, No. 1, pp. 47–57, 2012.
[19] L. Molent , R. Jones, S. Barter, and S. Pitt, “Recent developments in fatigue crack growth assessment”, International Journal of Fatigue, vol.28, pp 1759– 1768, Received 6th May 2005; received in revised form 14th November 2005; accepted 4th January 2006.
[20] D.Broek, MartinusNijhoff, The Hague, Elementary Engineering Fracture Mechanics, Springer, 4th Edition, 1986. [21] Gyatt, Graham (2006-01-14): "The Standard Atmosphere". A mathematical model of the 1976 U.S. Standard Atmosphere.