The Evolution of Dimorphic Traits: Predicting the Genetic Correlation
Between Environments
Derek A. Roff
Department of Biology, McGill University, Montrial, Quibec, Canada H3A IBI Manuscript received May 14, 1993
Accepted for publication September 28, 1993
ABSTRACT
Many traits vary in a dichotomous manner, although the underlying genetic determination is polygenic. T h e genetic basis of such dimorphic traits can be analyzed using the threshold model, in which it is assumed that there is a continuously distributed underlying character and the phenotype is determined by whether the character is above or below a threshold. Threshold traits frequently vary with environmental variables such as photoperiod, temperature and density. This effect can be accounted for using a threshold model in which ( 1 ) there is a critical value of the environmental variable at which a genotype switches to the alternate morph, and (2) switch (threshold) points are normally distributed in the population. I term this the environmental threshold (ET) model. I show that the E T model predicts that across environments differing in only one factor the genetic correlation will be 1. This prediction is supported by data from three wing dimorphic insects. Evidence is presented that the genetic
-
correlation between environments differing in two components (tempera- ture and photoperiod) is less than 1.M
ANY traits occur as dimorphic, rather than con- tinuously distributed characters: for example, pupal color in swallowtail butterflies (HAZEL 1977), shell shape in acorn barnacles (LIVELY 1986), cyclo- morphosis in zooplankters (DODSON 1989), pedomor- phosis in amphibia (SEMLITSCH 1985), dental di- morphism in some species of fish (SK~LASON, NOAKES and SNORRASON 1989; MEYER 1990), wing dimorph- ism in insects (HARRISON 1980; ROFF 1986a), sex ratio in turtles (BULL, VOGT and BULMER 1982) and dia- pause in insects (MOUSSEAU and ROFF 1989).Although only two phenotypes are discernable, di- morphic variation may be due to the additive effect of many loci, the particular manifestation of the trait being a function of a threshold of sensitivity. Accord- ing to the threshold model, a continuously varying character underlies the expression of the trait, indi- viduals with values lying above the threshold devel- oping into one morph, individuals lying below the threshold developing into the other morph (FAL-
T h e threshold model was developed specifically to address the question of discrete states in a fixed envi- ronment. However, the proportion of each morph in a population frequently varies both with genotype and environment. For example, in wing dimorphic insects both temperature and genotype determine the pro- portion of macropterous (fully winged, flight capable) individuals (HARRISON 1980; ROFF 1986a). Similarly, the proportion of males in some reptile species is determined by incubation temperature of the eggs as well as genotype (BULL, VOGT and BULMER 1982;
CONER 1989).
Genetics 136: 395-401 (January, 1994)
JANZEN 1992). A character expressed in two environ-
ments can be viewed as two characters that are genet- ically correlated (FALCONER 1952). Such an approach becomes mathematically intractable if there are a
large number of environments. In the case of variation in a single environmental factor, we can approach the problem by mathematically describing the relation- ship between the character and the environment (the reaction norm), and then viewing the model parame- ters as themselves inherited characters. In a recent paper, HAZEL, SMOCK and JOHNSON (1 990) proposed an alternate model for reaction norms of dimorphic traits. This model is a special case of the more general approach outlined above and is notable in that, as shown below, it predicts the genetic correlation be- tween environments differing in a single factor (e.g., two different temperatures) to be 1. This prediction is tested using data from three wing dimorphic insects, the sand cricket, Gryllus Frmus, the ground cricket, Dianemobius fascipes, and the small brown planthop- per, Laodelphax striatellus.
THE ENVIRONMENTAL THRESHOLD MODEL
Reaction norm for a single genotype
)""""""""" I I I I I I
I
8
I """""I
6
f
P
LL E
I I
I Dlstributlon of thresholds in popuiatlon I
Environment
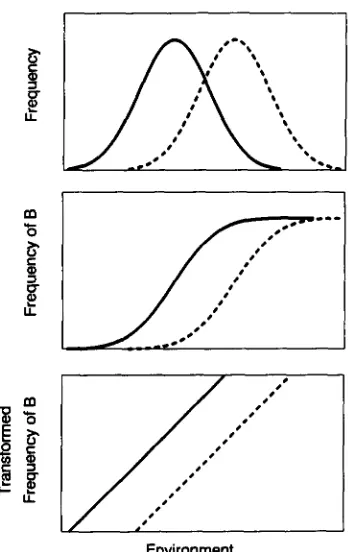
FIGURE 1 .-Schematic illustration of the environmental thresh- old model for a dimorphic trait that varies with genotype and environment. For each genotype there is a fixed threshold of the environmental variable that switches the phenotype to the alternate morph (A, B, upper panel). These thresholds are normally distrib- uted in the population (middle panel), giving rise to a population reaction norm that is a cumulative normal (bottom panel).
micropterous (short winged and flightless) morph while larva with JH titers below this threshold develop into macropters (long winged and flight capable). Genetic variation in wing dimorphism is then a con- sequence of genetic variation in JH titers (ROFF
1986a). Experimental support for this model comes from analysis of the two cricket species Gryllus rubens
and G . fzrmus (ZERA and TIEBEL 1988, 1989; YAD-
LOWSKI and FAIRBAIRN, unpublished data).
In contrast to the above, the model proposed by
HAZEL, SMOCK and JOHNSON (1 990) assumes that it is the threshold that is variable and the underlying trait distribution that is fixed. It is assumed that each genotype has a switch point, or threshold, along the environmental gradient at which the phenotypic expression of the genotype abruptly shifts from one morph to the other (Figure 1). I shall refer to this model as the environmental threshold (ET) model. To apply standard quantitative genetic theory to the
E T model, we make the usual assumption that the character, in this case the switch point, is normally distributed in the population. As a consequence, the norm of reaction for the population (the relationship between proportion of a particular morph and the value of the environmental variable, as opposed to the relationship for a particular genotype as shown in the
Environment
FIGURE 2.-Schematic illustration of the effect of selection on the norm of reaction under the E T model. Selection for an in- creased frequency of one morph shifts the distribution of threshold values at which the switch between morphs occurs (dashed curve in top panel), causing a concomitant shift in the reaction norm (middle panel). By appropriate transformation (cg., probit) the two curves can be linearized, the curve after selection remaining parallel to the original.
top panel of Figure 1) will be a cumulative normal (Figure 1). Since the distribution of thresholds in each environment along the gradient is, by definition, the same, it follows that while the proportion of a morph will vary across environments, the heritability of the trait will not. Thus, if we designate one environment as x and the other as y, we have h,' = h:, and for the phenotypic variances, a: = a;. The genetic correlation across environments along the gradient will be + l . This can be demonstrated in two ways. First, by chang- ing the environment we do not change the underlying character, only its expression on the 0-1 scale: since the method of estimation corrects for this (FALCONER
Genetic Correlations of Dimorphic Traits 397
Value of underlying trait
a b C
Environment
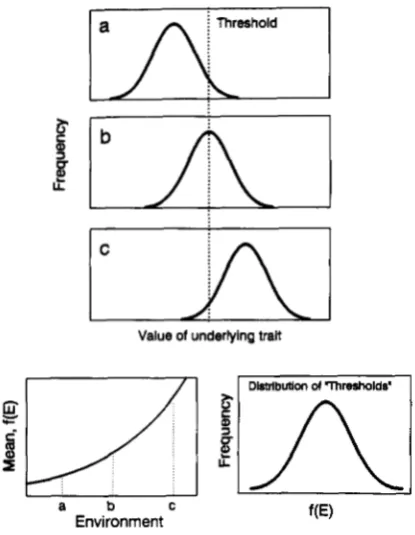
FIGURE 3."Top three panels (a, b, c) show hypothetical shift in the distribution of the continuously distributed trait underlying the expression of a dimorphic character with variation in a single environmental factor (a < b < c). Individuals lying to the right of
the fixed threshold develop into one morph, individuals to the left into the alternate. The change in the value of the mean can be expressed as a monotonic function,JE), of the environment (bottom left panel). By transforming the environmental value usingJE), the trait can be mathematically described as a normal distribution of
thresholds as in the ET model.
correlation between x and y, T A , is given by (FALCONER
1989, p. 318),
where R, is the direct response to selection on x, Ry is the correlated response of y to selection on x, and i is the selection intensity. From the considerations above,
ay = ax, h, = h,, and the correlated response of y is the same as the response of x, R, = Ry Substituting in Equation 1 gives rA = I .
To relate the ET model to the more usual model in which the threshold remains fixed and the under- lying character (e.g., JH titer) varies along the envi- ronmental gradient we proceed as follows. First, we assume that the only action of the environmental factor is to shift the distribution of the underlying character (Figure 3). Thus, we can define a function RE) that describes the relationship between the mean and the environmental value, E. We can now rescale the character value such that the underlying character remains fixed and the threshold varies: the "thresh- old" when the environment has the value E is T -RE),
TABLE 1
Mean proportion of macropterous adult C. fimw produced under three different photoperiod/temperature combinations
17/30 12/30 15/25
Female 0.42 0.21 0.13
Male 0.21 0.19 0.05
where T is the value of the threshold on the original scale. T h e distribution of "thresholds" will be normal on the transformed environmental scaleNE). In this model the genetic correlation of 1 arises from the assumption that the same ranking applies along the environmental gradient (i.e., a simple shifting of the distribution), which is equivalent to assuming that the functionRE) applies to all genotypes. If this is not the case then the genetic correlation will be less than 1.
In many cases traits vary in response to more than one variable: for example, wing dimorphism in insects is frequently responsive to both photoperiod and tem- perature (HONEK 1976). T h e above argument can be extended to two environments, a genetic correlation of 1 then requiring that a common function, sayREl, E2) where the two environmental variables are E1 and ES, applies to all genotypes.
EMPIRICAL TESTS
Test 1.
G.
firmus: Crickets were raised in full sib groups of 60 hatchlings in mouse cages (29 cm long X 19cm wide X 13 cm high), and fed ad libitum with rabbit chow. Full details of the rearing regime and history of the stock are given in ROFF (1986b).Twenty-two families were each split upon hatching into four groups (cages) and raised under four pho- toperiod/temperature combinations (hr of light/ temp): 17/30; 12/30; 15/25; 12/25. Only two families produced macropterous adults under the last combi- nation (12/25), and therefore the data for this com- bination could not be used. T h e proportion macrop- terous produced under the other three combinations varied widely, from 0.05 to 0.42 (Table 1).
T h e value of the genetic correlation between envi- ronments can be estimated by the family mean cor- relation (VIA 1984), where in the present case, the family mean is the proportion of macropterous adults per family. T h e observed genetic correlation will be less than the true value because the numerator in the formula for the correlation contains sampling error in addition to genetic covariance, and the denomina- tor may be inflated by within-family error (VIA 1984).
Because Fisher's r-transformation goes to infinity as the correlation approaches 1, it is not possible to test an estimated proportion against an expected value of
a modification of the model of OLAUSSON and RON-
NINGEN (1975). T h e phenotypic value of the under-
lying continuous variable for the ith individual from full sib family j , Pi,, is equal to
where
X,
is a random normal variate with zero mean and unit variance common to familyj, y l , j is a randomnormal variate with zero mean and unit variance unique to individual i,j, and hZ is the heritability of the trait. The phenotypic value of the individual on the expressed dimorphic scale is determined from the value of the underlying variable relative to the thresh- old value. T h e latter, z, is the abscissa on the stand- ardized normal curve corresponding to the propor- tion macropterous,
p ,
in the population. T h e formula given by HAMAKER (1978) was used to derive z fromp .
A genetic correlation of +1 was simulated by gen- erating a full sib family of size N, and then dividing the group into two environments specified by two different values ofp .
To conform approximately to the regimes 17/30 and 12/30, the two values ofp
were set at 0.42 and 0.21, respectively (Table 1). T h e number per environment, N/2, was set at 16, the average number of individuals per sex per cage. T h e proportion per cage was transformed (arcsine-square root) prior to the estimation of the correlation be- tween cages. T h e mean correlation, r , based on 100 replicates is 0.744 (SD = 0.1 1 l), and even when N/2 is increased to 100 the mean value of r is still only 0.942 (SD = 0.024). These results demonstrate that even when the genetic correlation is +1 the method of family mean estimation may be seriously biased downward.In addition to the present experiment, data from split family rearings are available from rearings re- ported in ROFF (1 986b). There are significant corre- lations across all environments (Table 2), confirming the existence of positive genetic correlations. T h e correlations across the two environments differing in only a single factor (1 7/30 vs. 12/30) are the highest, r ranging from 0.79-0.87, and within the 95% con- fidence region obtained from the simulation. T h e genetic correlation between environments differing in only a single factor (1 7/30 vs. 12/30) is significantly higher (one-tailed test, z-transformation method, SO-
KAL and ROHLF 198 1) than those between environ- ments differing in both photoperiod and temperature (17/30 vs. 15/25, and 12/30 vs. 15/25, comparisons a-b and b-c, Table 2). There is no significant differ- ence between the two environments differing in both photoperiod and temperature (comparison b-c, Table 2).
Test 2. D. fascipes: According to the E T model, after several generations of selection the norms of
TABLE 2
Family mean correlations across environments in the incidence
of macroptery
17/30 12/30 15/25
17/30 0.87***’ 0.63**b
12/30 0.79***’ 0.65**‘
15/25 0.49*b 0.58**‘
0.83***’
0.81***n
*
P < 0.05; ** P < 0.01; *** P < 0.001.’
Data from ROFF (1986b).Comparison Females Males
f P(one-tailed) t &‘(one-tailed)
a b 1.76 0.04 2.38 0.01
a,c 1.63 0.05 1.99 0.02
b,c 0.1 1 0.46 1.37 0.09
Results for females are shown in the upper portion, males in the lower. Comparisons among environments restricted to data from the experiment outlined in this paper, shown by superscripts a, b,
c. All statistical tests done using Fisher’s z-transformation (SOKAL and ROHLF 1981).
reaction curves should be shifted but not changed in shape. Because the norm of reaction curve is predicted to be cumulative normal, it should be linearized by transformation to z, where z is the abscissa on the unit normal corresponding to the proportion macropter- ous (Figure 1). Selection for, say, increased macrop tery is predicted to shift the reaction curve to the left, but it should remain parallel to the reaction curve of the unselected population.
MASAKI and SENO (1990) selected for increased proportion macropterous in a photoperiod of 12L:12D (LW line), and for increased proportion micropterous in a photoperiod of 13L: 1 1 D (SW line). In each generation a subsample of each selected line was reared in the photoperiodic regime under which the line was not being selected. T h e heritability of wing dimorphism in D. fascipes is moderate (h2 = 0.30), and a significant change in proportion macroptery was achieved within 14 generations (Figure 4). The correlated response to selection can be predicted using data from the base population (generation zero) and the response of the selected lines. We first transform the environmental variable, x, by arbitrarily setting x
= 0 for a photoperiod of 12L:12D, and x = 1 for 13L: 1 1 D. T h e estimated relationship between the transformed proportion macropterous and x in the base population is z = -0.89
+
1 . 1 3 ~ . Assuming a genetic correlation of 1, the predicted correlated re- sponse of the LW line is given by IC = ZLW+
1.13,where zc is the transformed predicted proportion macropterous, and zLW is the transformed observed
Genetic Correlations Dimorphic Traits
I I
Generation
0 2 4 6 8 1 0 1 2 1 4
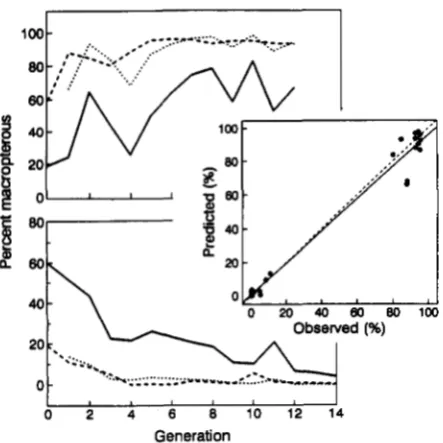
FIGURE 4.-Direct (solid lines) and correlated (dashed lines) re- sponses to selection for increased (upper panel) and decreased (lower panel) macroptery in the ground cricket, D.fascipes. Selection
for increased macroptery carried out at a photoperiod of 12L: 12D, and the correlated response measured at 13L: 1 ID. Selection for
decreased macroptery carried out at 13L: 1 1 D and the correlated response measured at 12L: 12D. Dotted lines show the predicted correlated response. Middle panel shows the regression of predicted correlated response on observed ( r = 0.99, TZ = 26, P < 0.001). Data from MASAKI and SENO (1 990).
between observed and predicted correlated responses ( r = 0.99, n = 26,
P
<
0.001, Figure 4).Test 3.
L.
striatellus: Selection for decreased ma- croptery in the small brown planthopper, L. striatellus,produced a highly significant response, the incidence declining from about 80% in the initial population to about 10% after 13 generations of selection (MORI and NAKASUJI 1990). T h e effect of density on the incidence of macroptery was measured in generations
1, 5 and 1 1. In this case density can be considered an environmental variable in the same manner as tem- perature or photoperiod. T h e E T model predicts that the transformed reaction norms will be parallel, with that from the initial generation being to the left of that from generation 5, which itself will be to the left of that from generation 11. These predictions are upheld (Figure 5 ) , there being highly significant ef- fects due to density
(P
<
0.001) and generation(P
c
0.001), but no significant interaction
(P
= 0.85).DISCUSSION
A corollary of the model proposed by HAZEL, SMOCK and JOHNSON (1990) for the inheritance of dimorphic traits is that the genetic correlation be- tween two environments differing in only a single factor such as photoperiod, temperature or density will be exactly 1. The three tests presented in this paper all utilize the phenomenon of wing dimorphism
u .I
. / .
I-2
1
.
-3
'
I0 5 10 15 20
Density
FIGURE 5.-Reaction norms for the small brown planthopper, L.
striatellus, in the initial population (circles), after 5 (triangles) and 1 1 (squares) generations of selection. Lines show regressions fitted to each generation separately. Data from MORI AND NAKASUJI (1 990).
in insects. For G. jirmus the estimated genetic corre- lation between two environments differing in photo- period (17 hr and 12 hr) was estimated using family mean correlation. In his analysis of the inheritance of sex ratio in the snapping turtle, Chelydra serpentina,
JANZEN (1992) used the same approach to estimate
the genetic correlation between environments differ- ing in temperature. T h e usual statistical test for cor- relation, Fisher's %-transformation, precludes the test- ing of the hypothesis of an expected correlation of 1 because z approaches infinity as the correlation ap- proaches 1. JANZEN (1992) attempted to overcome this problem by use of the jackknife to estimate con- fidence limits. This approach is inadequate for two reasons: first, the jackknife should not be used unless it can be shown either theoretically or by simulation that the estimated confidence limits are correct (POT-
VIN and ROFF 1993). T h e second reason is that be- cause of sampling variation the expected correlation using the family mean correlation will be less than 1 even when the hypothesis ?-A = 1 is correct. This arises
because the proportion estimated for each family will itself have sampling error. The deletion of single families in the jackknife method in no way corrects for this bias. T h e expected family mean correlation and its distribution can be estimated using Monte Carlo simulation. For G.jirmus the genetic correlation between 17/30 and 12/30 is consistent with the cor- relation estimated by simulation under the hypothesis
regime: the ET model can be used to predict the correlated response in this regime. T h e predicted responses closely match the observed (Figure 4), and thus the hypothesis = 1 cannot be rejected. This test does not directly answer the question of whether a genetic correlation substantially less than 1 would also be consistent with the data. T o predict the cor- related response for a genetic correlation less than 1 requires estimates of the direct response, the herita- bilities and the phenotypic variances (see Equation 1). Such data are not available in the present case. How- ever, the fact that the predicted and observed re- sponses are so highly correlated ( r = 0.99, n = 26) suggests that alternate models are unlikely to fit the data more satisfactorily.
Of the three tests, that using the selection experi- ment of MORI and NAKASUJI (1 990) on the planthop- per, L. striatellus, is the most convincing. Utilizing the general model outlined in the introduction, we can write the norm of reaction as some function of density such as g(d,
p l ,
p 2. .
.), where d is density and the p sare parameter values. Thus, for example, the function might be P = p l
+
p 2
d , or P =p l
+
p 2
d+
p 3
d2,where P is the proportion macroptererous or some transformation thereof. T h e parameter values are then considered to be inherited traits, which them- selves could be correlated with each other. Selection on proportion macropterous will act to change the parameter values. T h e E T model postulates P = p l
+
p 2
d , where P is the transformed proportion (=the abscissa on the unit normal corresponding to theproportion macropterous), with
p l
= - p / u 2 and p 2 =l/u2, where p is the density at which 50% of adults
are macropterous, and u2 is the phenotypic variance. Selection shifts p but does not change u2; accordingly, the norm of reaction moves under selection but does not change its slope. T h e aforementioned transfor- mation of P clearly linearizes the reaction norms and there is no statistical evidence for an interaction be- tween the lines (Figure 5 ) . Even when the lines are fitted independently, as shown in Figure 5 , there is no substantial variation in slope.
T h e critical assumption of the ET model is that there is a single and unique switch point for each genotype: that is, when raised in a particular environ- ment, a given genotype will always develop into the same morph. An alternative hypothesis, called “adap- tive coin-flipping’’ (KAPLAN and COOPER 1984), is that even in an invariant environment individuals of the same genotype may differ in phenotype. This hypoth- esis requires that there are some probabilistic proc- esses happening during development, evidence for which is scant (KAPLAN and COOPER 1984). Such a model is not required to adequately account for the data reported in this paper.
All three tests reported here are based upon the
population consequences of the ET model. Obviously, the most stringent test is to show that the basic as- sumption of a step function for each genotype is correct. This is not possible with sexually reproducing animals but might be feasible using a parthenogenetic species. In the case of wing dimorphism a possible candidate is aphids, which are wing dimorphic and at some stage in their life cycle are parthenogenetic.
The data from G . jirmus suggests that the genetic correlation between environments differing along two axes (temperature and photoperiod) is less than 1 (Table 1). Since separate sensory systems are involved and possibly different biochemical pathways, this re- sult is perhaps not surprising. Further experiments are required to determine the correlation structure between the several environmental factors that can influence wing morph.
T h e three tests reported in this paper jointly pro- vide support for the E T model. However, the diffi- culties of establishing narrow bounds on the genetic correlation necessitate more experimental support; experiments utilizing the family mean correlation re- quire larger family sizes, while experiments based on the correlated response to selection need to be de- signed to measure both the genetic parameters re- quired to estimate and to examine the shift in the norm of reaction during the course of selection. Fi- nally, utilization of clonal organisms may permit a direct test of the critical assumptions of the E T model that there is a single switch point for each genotype.
I am most grateful for the helpful comments of D. FAIRBAIRN,
Y . CARRIERE, M. SLATKIN and an anonymous referee on earlier
drafts of this paper. SHARON DAVID provided invaluable technical assistance in rearing and measurement. This work was supported by a grant from the Natural Sciences and Engineering Council of Canada.
LITERATURE CITED
BULL, J. J., R. C. VOCT and M. G . BULMER, 1982 Heritability of sex ratio in turtles with environmental determination. Evolu- tion 3 6 333-341.
DODSON, S., 1989 Predator-induced reaction norms. Bioscience
FALCONER, D. S., 1952 The problem of environment and selec-
FALCONER, D. S., 1989 Introduction to Quantitative Genetics. Long- mans, New York.
HAMAKER, H. C., 1978 Approximating the cumulative normal distribution and its inverse. Appl. Statist. 27: 76-77.
HARRISON, R. G., 1980 Dispersal polymorphism in insects. Ann. Rev. Ecol. Syst. 11: 95-1 18.
HAZEL, W. N., 1977 The genetic basis of pupal color dimorphism and its maintenance by natural selection in Papilio polyxenes (Papilionidae: Lepidoptera). Heredity 38: 227-236.
HAZEL, W. N., R. SMOCK and M. D. JOHNSON, 1990 A polygenic model for the evolution and maintenance of conditional strat- egies. Proc. R . SOC. Lond. B 242: 181-187.
HONEK, A., 1976 Factors influencing the wing polymorphism in
Pyrrhocoris apterus (Heteroptera, Pyrrhocoridae). Zool. Jahrb. 39: 447-452.
tion. Am. Nat. 86: 293-298.
JANZEN, F. J., 1992 Heritable variation for sex ratio under envi- ronmental sex determination in the common snapping turtle (Chclydra serpetina). Genetics 131: 155-161.
KAPLAN, R. H. and W. S. COOPER, 1984 The evolution of devel- opmental plasticity in reproductive characteristics: an applica- tion of the "adaptive coin-flipping" principle. Am. Nat. 123:
LIVELY, C. M., 1986 Predator-induced shell dimorphism in the acorn barnacle Chthamalus anisopoma. Evolution 4 0 232-242.
MASAKI, S., and E. SENO, 1990 Effect of selection on wing di- morphism in the ground cricket Dianemobiusfuscipes (Walker). Bol. San. Veg. Plagas (Fuera de serie) 2 0 381-393.
MEYER, A., 1990 Morphometrics and allometry in the trophically polymorphic cichlid fish, Cichlasoma citrinellum: alternative ad- aptations and ontogenetic changes in shape. J. Zool. (Lond.)
MORI, K., and F. NAKASUJI, 1990 Genetic analysis of the wing- form determination of the small brown planthopper, Laodel- phax striatellus (Hemiptera: Delphacidae). Res. Popul. Ecol. 32:
MOUSSEAU, T. A., and D. A. ROFF, 1989 Adaptation to seasonality in a cricket: patterns of phenotypic and genotypic variation in body size and diapause expression along a cline in season length. Evolution 43: 1483-1496.
OLAUSSON, A., and K. RONNINGEN, 1975 Estimation of genetic parameters for threshold characters. Acta Agr. Scand. 25: 20 1 -
208.
POTVIN, C., and D. A. ROFF, 1993 Distribution-free and robust statistical methods: viable alternatives to parametric statistics? Ecology 7 4 1617-1628.
393-410.
221: 237-260.
279- 287.
ROFF, D. A., 1986a The evolution of wing dimorphism in insects. Evolution 40: 1009-1 020
ROFF, D. A., 1986b The genetic basis of wing dimorphism in the sand cricket, Gryllusjrmus and its relevance to the evolution of wing dimorphisms in insects. Heredity 57: 221-231.
SEMLITSCH, R. D., 1985 Reproductive strategy of a facultatively paedomorphic salamander Ambystoma talpoideum. Oecologia
65: 305-3 13.
SK~LASON, S., D. L. G. NOAKES and S. S. SNORRASON, 1989
Ontogeny of trophic morphology in four sympatric morphs of arctic charr Saluelinus alpinus in Thingvallavatn, Iceland. Biol. J. Linn. SOC. 38: 281-301.
SOKAL, R. R., and F. J. ROHLF 198 1 Biometry. W. H. Freeman, San Francisco.
SOUTHWOOD, T. R. E., 196 1 A hormonal theory of the mechanism of wing polymorphism in Heteroptera. Proc. R. SOC. Entomol. Lond. (A) 36: 63-66.
VIA, S., 1984 The quantitative genetics of polyphagy in an insect herbivore. 11. Genetic correlations in larval performance within and among host plants. Evolution 3 8 896-905.
WIGGLESWORTH, V. B., 1961 Insect polymorphism-a tentative synthesis. Symp. R. Entomol. SOC. Lond. 1: 103-1 13.
ZERA, A. J., and K. TIEBEL, 1988 Brachypterizing effect of group rearing, juvenile hormone I11 and methroprene in the wing- dimorphic cricket, Gryllus rubens. J. Insect Physiol. 34: 489- 498.
ZERA, A. J., and K. TIEBEL, 1989 Differences in juvenile hormone esterase activity between presumptive macropterous and bra- chypterous Gryllus rubens: implications for the hormonal con- trol of wing polymorphism. J. Insect Physiol. 35: 7-17.