ANGRISH, ATIN. Search and Tracking of 3D Product Manufacturing Data Using Deep Learning and Blockchain. (Under the direction of Dr. Binil Starly).
`
`
`
Search and Tracking of 3D Product Manufacturing Data Using Deep Learning and Blockchain.
by Atin Angrish
A thesis submitted to the Graduate Faculty of North Carolina State University
in partial fulfillment of the requirements for the degree of
Doctor of Philosophy
Industrial Engineering
Raleigh, North Carolina 2019
APPROVED BY:
_______________________________ _______________________________ Dr. Binil Starly Dr. Yuan-Shin Lee
Committee Chair
iii BIOGRAPHY
iv ACKNOWLEDGMENTS
First and foremost, my sincerest thanks to Dr. Binil Starly, whose patient guidance and motivation without which this dissertation would never have come to fruition. He has been a guide, mentor and a friend which, I have found, is an extremely rare combination for an advisor.
Special thanks for the faculty at NC State who gave me some of the necessary background for building my knowledge and skill set through their courses, which was crucial for work in this dissertation, notably Dr. David Dickey, Dr. Behnam Kia, Dr. Peter Bloomfield and Dr. Julie Ivy.
No acknowledgements are complete without thanks to friends and family. Shout out to Kaustav Mohanty, Sriram Chari, Harsh Khetawat, Utsab Ray and Sudhendu Singh for the post work fun and endless board games, Deepak Pahwa, Akshay Bharadwaj, Syed Nabeel Mehdi, Benjamin Craver and Mahmud Hasan for helping break the monotony of work and making the DIME Lab the best place in the campus to work in; and numerous others who made every day at NC State something to look forward to.
Thanks to my family and friends (KKT group) back home who, despite the distance, make every effort to make me feel comfortable.
v TABLE OF CONTENTS
LIST OF TABLES ... xii
LIST OF FIGURES ...xv
Chapter 1 : Introduction ... 1
1.1. Introduction ... 1
1.2. Problem Background ... 3
1.3. Research Motivation ... 5
1.4. Dissertation Objectives ... 10
1.5. Dissertation Outline ... 12
References ... 13
Chapter 2 : “Fabsearch”- A 3D CAD Model Based Search Engine for Sourcing Manufacturing Services ... 16
2.1. Introduction ... 16
2.2. Related Work ... 18
2.3. “Fabsearch” System Overview And Methodology ... 21
2.4. Development of 3D Part Model Dataset – “FabWave Repository” ... 24
2.5. Shape Analysis methodology ... 32
2.6. Backlink Generation ... 33
2.7. Results ... 35
2.8. Discussion ... 42
2.9. Conclusions ... 44
References ... 46
Chapter 3 : MVCNN++ : CAD Shape Classification using Multi-View Convolutional Neural Networks ... 51
3.1. Introduction ... 51
3.2. Related work ... 54
3.2.1. 3D Shape Based Retrieval and Classification using Traditional Methods ... 54
3.2.2. Neural Network Methods for Retrieval and Classification ... 56
3.3. Methodology ... 58
3.3.1. Image Inputs... 60
3.3.2. ResNet Architecture ... 64
3.3.3. Multi-View CNN (MVCNN) ... 65
3.3.4. MVCNN++: Addition of Metadata ... 67
vi
3.4. Results ... 69
3.4.1. CAD Part Classification ... 70
3.4.2. Observations regarding categorization of no-label data ... 74
3.5. Conclusions ... 76
3.6. Funding... 77
References ... 78
Chapter 4 : A Case Study For Blockchain In Manufacturing - “FabRec”- A Prototype For Peer-To-Peer Network Of Manufacturing Nodes ... 83
4.1. Introduction ... 83
4.2. System Implementation ... 87
4.2.1. FabRec System Overview ... 87
4.3. Blockchain Fundamentals ... 89
4.3.1. Block and Its Data Payload ... 89
4.3.2. Differences between public and private chains ... 90
4.3.3. Consensus Algorithms ... 91
4.3.4. Block Architecture at Manufacturer Level ... 92
4.4. Smart Contract Structures ... 96
4.5. FabRec System Nodal Data Exchange ... 101
4.6. Prototype Implementation and Evaluation ... 103
4.7. Results ... 105
4.8. “FabRec” in Context of National Manufacturing Initiatives ... 111
4.8.1. Application Scenarios in Manufacturing ... 111
4.9. Industrial Implementation Challenges ... 112
4.10. Future Work ... 114
4.11. Conclusion ... 115
4.12. Acknowledgements ... 116
References ... 117
Chapter 5 : Tracking Product Manufacturing Data Using Non-Fungible Crypto-Tokens across Digital Supply Chains ... 120
5.1. Introduction ... 120
5.2. Related Work ... 125
5.3. FabRec System Components and Architecture in a Peer-to-Peer Network of Manufacturing Resources ... 129
5.3.1. Blockchain ... 131
vii
5.4. Architecture of the FabRec system: ... 132
5.4.1. Design of Non-Fungible Tokens as Smart Contracts ... 134
5.5. Case Study ... 141
5.5.1. Experimental Setup ... 144
5.5.2. Results ... 145
5.6. Discussion ... 150
5.7. Conclusions ... 154
5.8. Acknowledgements ... 154
References ... 155
Chapter 6 : Overall Summary, Research Contributions and Future Work ... 163
6.1. Overall summary and research contributions ... 163
6.2. Future Work ... 167
6.2.1. Shape Correspondence: ... 167
6.2.2. Blockchains in manufacturing ... 169
viii LIST OF FIGURES
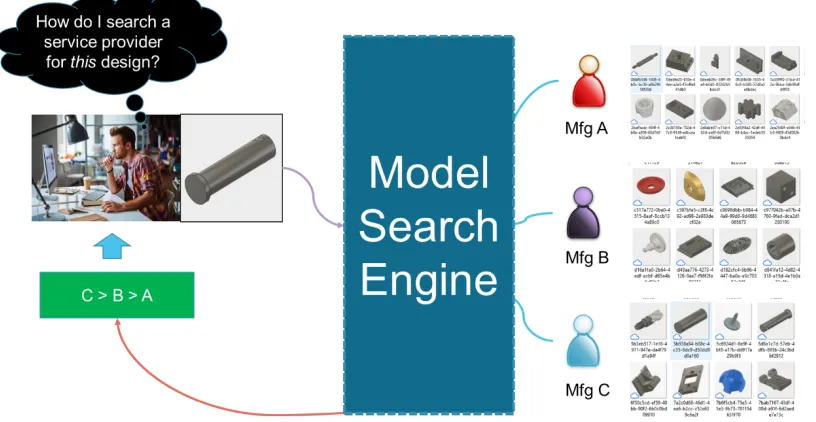
Figure 1-1: A manufacturing services search engine ... 7
Figure 1-2: Trust Evaluation via monitoring a decentralized ledger ... 9
Figure 2-1: Manufacturing search engine matching query part to historic parts produced by manufacturers ... 23
Figure 2-2: Sample of non-standard components ... 25
Figure 2-3: Examples of standard parts (Screws, Washers, Sprockets, Brackets, and Retaining Rings) ... 26
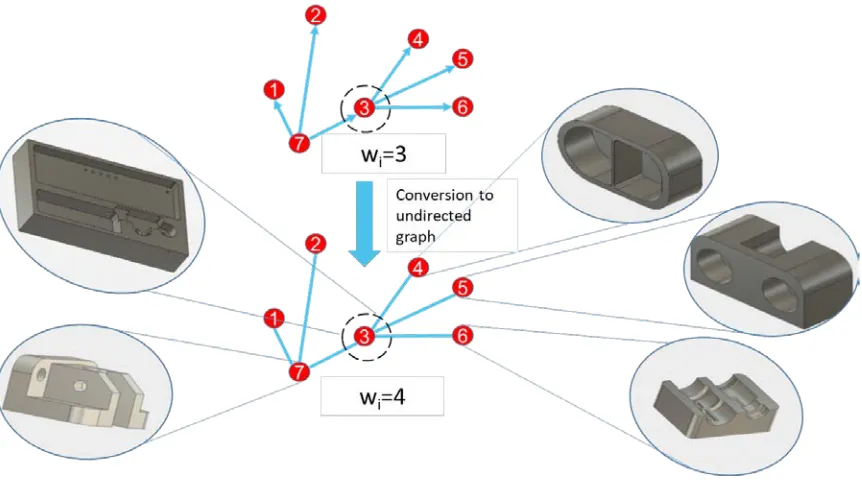
Figure 2-4: Conversion of directed kNN graphs to undirected graph (Part ID 3 is the Query part) ... 34
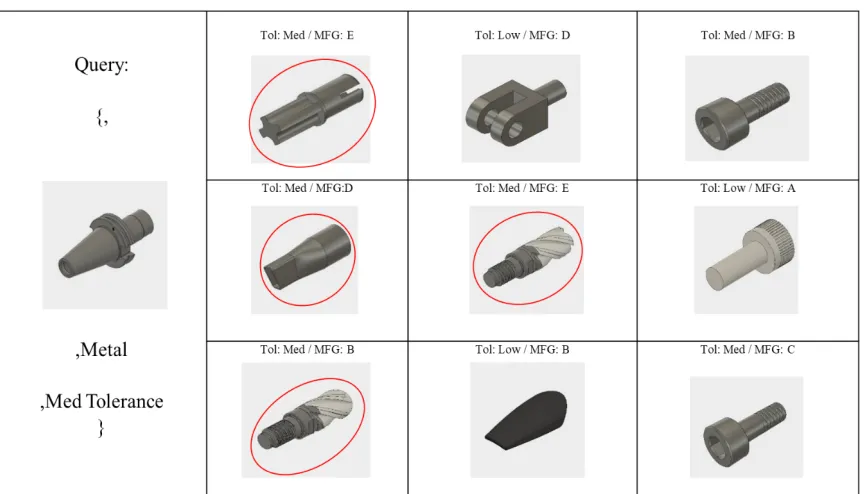
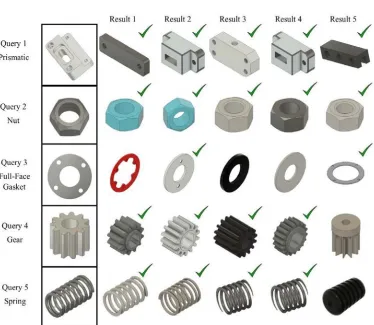
Figure 2-5: Sample Query Part and the results (circled shapes indicate the closest shape match) ... 36
Figure 2-6: Sample Query 2 ... 37
Figure 2-7: Sample Query 3 ... 38
Figure 2-8: Sample Query 4 ... 38
Figure 3-1: Example of a connection in ResNet ... 65
Figure 3-2: MVCNN++ Architecture ... 66
Figure 3-3: Loss vs. Epochs (a) Pure MVCNN (b) MVCNN++ (our network) ... 69
Figure 3-4 : Confusion Matrices for (a) Pure MVCNN (b) MVCNN++ (our network) ... 70
Figure 3-5: Precision vs Recall: Pure MVCNN (Blue) and MVCNN++ (Red) ... 72
ix Figure 4-1: FabRec Overview. A sample snapshot of manufacturers, designers,
asset builders and regulators participating on a decentralized network. This network enables controlled information sharing across trust boundaries (dotted circles) ... 87 Figure 4-2: Linked data blocks with content hashed to detect modification. The
chain of blocks leads to a bread crumb trail of events linked to
manufacturing transactions across participants in the network. ... 90 Figure 4-3: This example block displays the certification of a machine’s capabilities
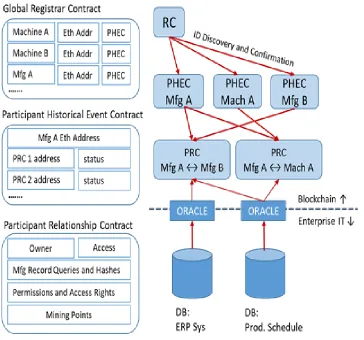
by a neutral 3rd party. This ‘Block’ maintains a chain-link to all events generated by the specific machine in the past and all future events that will be created during its life ... 94 Figure 4-4: Transaction Model ... 95 Figure 4-5: Block Model ... 96 Figure 4-6: Smart Contract Structure in FabRec. On the right, a subset of the
relationship graph between various nodes on the chain ... 97 Figure 4-7: Smart Contract Structure for GRC ... 98 Figure 4-8: Some function definitions for the PHEC ... 99 Figure 4-9: Sample System Data Exchange between sample participants (designers
and machines) ... 101 Figure 4-10: Physical devices interacting on the FabRec chain through the Smart
Contract, specifically the Participant Relationship Contract (PRC). ... 104 Figure 4-11: Time to mine a transaction using the PoW and PoA consensus
x
Figure 4-12: Time to reach 12 confirmations in PoW vs PoA consensus mechanisms ... 109
Figure 5-1: Digital Thread with blockchain ... 122
Figure 5-2: Distributed Ledgers provide a way of trusted automated information transactions without the need for cross talk between siloed organizational IT systems. The DL is tied to a product and changes hands as it makes its way through the supply chain ... 127
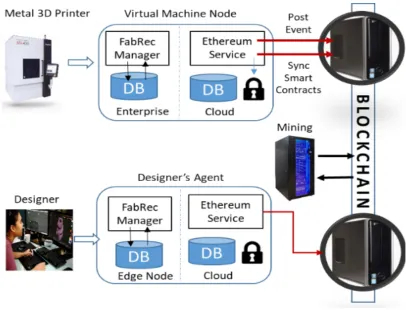
Figure 5-3: Left: Architecture of the machine digital twin interfacing with a decentralized blockchain representing the digital thread of parts and process data. ... 131
Figure 5-4: Virtual Machines interacting with Smart Contracts of the Organization hosted on the blockchain. ... 131
Figure 5-5: Token Movements and Events across the supply chain. Events in Yellow and the tokens are represented by blue circles ... 142
Figure 5-6: Distribution of the amount of gas consumed -- Ropsten ... 146
Figure 5-7: Right: Distribution of time needed to mine a transaction - Ropsten ... 146
Figure 5-8: Distribution of the amount of gas consumed - Rinkeby ... 147
Figure 5-9: Distribution of time needed to mine a transaction - Rinkeby ... 147
Figure 5-10 : Distribution of the amount of gas consumed ... 148
Figure 5-11: Distribution of time needed to mine a transaction ... 148
Figure 5-12: Average time taken to mine burn, merge, mint and split functions ... 149
Figure 5-13: Average gas consumption for transactions using burn, merge, mint and split functions ... 149
xi Figure 6-2: A matryoshka doll structure will present problems with the image
based approach since the camera will only capture outermost structure images. Right: A protein structure where occluded portions might create problems in full view capture ... 168
xii LIST OF TABLES
Table 2-1: Manufacturer Service Provider Assignment by Process Category ... 29
Table 2-2: Part assignments by process ... 30
Table 2-3: Part assignment by tolerance ... 31
Table 2-4: Manufacturer assignment by part ... 32
Table 2-5: Search Engine performance on Metric 1 ... 40
Table 2-6: Search Engine Performance on Metric 2 ... 41
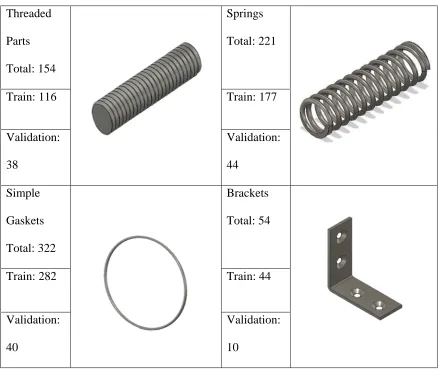
Table 3-1: Part Classes with categorized training data (example Train-Validation split shown) ... 62
Table 3-2: Comparison- Top Row: Before Rotation, most of the views do not represent the part features adequately. Bottom Row: After Rotation, there is a visible improvement in the representations ... 64
Table 3-3: Results of Classification and Recall on the FabWave FW10C dataset ... 69
Table 3-4: Precision at k: values for each class ... 73
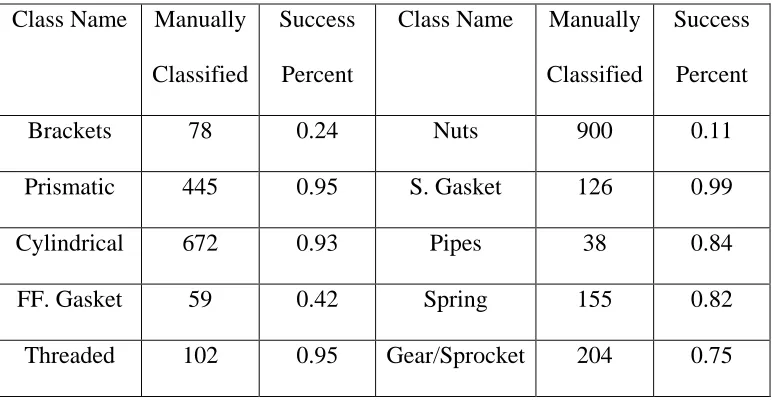
Table 3-5: Manual vs. MVCNN++ Classification Comparison ... 75
Table 4-1: PoA and PoA analysis for time to mine ... 109
Table 4-2: PoA and PoW analysis for time to 12 confirmations ... 110
Table 5-1: Functions in an ERC-721 Token ... 135
Table 5-2: Proposed functions and events to be added to ERC-721 for manufacturing applications ... 137
Table 5-3: Contract Definition for the GRC ... 139
1 Chapter 1 : Introduction
1.1. Introduction
The manufacturing sector of the US economy contributes 12% to the US GDP, supports close to 18M jobs, and provides higher wages and standards of living across rural and suburban regions of the United States. The US must advance its manufacturing strength and the country’s ability to make ‘things’ is vital to the US economy. By many accounts, we are in the midst of the 4th Industrial Revolution, in which data is envisioned to make physical machine assets on the production floor to be intelligent and self-aware. Smarter machine assets will eventually create digital factories of the future. While the value of Big Data is being leveraged by the large manufacturers, it is hardly making an impact on the small and medium scale manufacturing enterprises across the country. These SME’s are responsible for more than 70% of all US manufacturing. How can ‘Big Data’ be of value to the small and medium scale enterprises? Many of the SME’s have strong manufacturing expertise, yet the data generated by their processes are least understood. Even when they do recognize its value, they have limited skills available to leverage the data to make their production systems more efficient.
2 manufacturing. A recent study has shown that data generated from the US manufacturing sector is 2 times larger than the healthcare and banking sectors combined. Yet this data is untapped and not fully utilized. There is a tremendous opportunity to advance computing research into the field of manufacturing processes by having the machines compute and communicate in real-time with low latency and unparalleled resiliency.
The widespread use of data analytics has provided a boost to the productivity and the profits of numerous industries such as banking, advertising and logistics. However, manufacturing as a field and manufacturers have been unable to reap the benefits of the large amounts of data generated during the product design and manufacturing process. Unfortunately, this lack of adoption has to do with the lack of digitization in the field of manufacturing and also with the paucity of enthusiasm and risk aversion amongst manufacturers towards newer technologies. While the technology acceptance levels are rising slowly but surely, the lack of digitization and associated infrastructure for manufacturing analytics remains a challenge, one that this dissertation intends to focus on.
3 enhancements in service levels of the manufacturers. As a combined result of these three factors, manufacturers are not only capable of storing but also generating vast amounts of data. Much of this data is simply stored in local enterprise level databases or simply discarded. Data is the new asset, yet many, particularly the small manufacturers have not leveraged their own asset in terms of improving product lifecycle management activities or overall production efficiency.
We focus our problem scope to two areas within the manufacturing supply chain – First, how does a product designer find new manufacturing service providers? Can new algorithmic methods be developed to enable this search space to match designer’s requirements with that of manufacturing capabilities? Second, we address the issue of how can we search for information related to manufacturing capabilities and experiences that are built across time. Can we leverage decentralized architectures to help enable data associated with a manufacturer to be searchable and tracked across the lifetime of a manufacturer. If possible, this capability data becomes important to drive better search results in terms of the first question to be addressed.
1.2. Problem Background
4 information, siloed data and increasing incumbency with the existing suppliers. Expectedly, the result is that the product designers are constantly looking for new manufacturers/suppliers for adding to their supply chains. This problem is especially pronounced for small product design firms who don’t have the capacity or the financial wherewithal for holding a captive manufacturing setup. On the other extreme, large manufacturers face a slightly altered set of challenges. They share the same concerns as small product designers as far as the need for constant updating of their supplier databases, they have an increasing need for closer tracking of the parts they get manufactured. Part provenance has come to be a major research area in recent times [6] [7] [8] and will continue to do so. However, this task of tracking is not without its own challenges. The ability to track parts and data from across the supply chain implies the need for an overarching systems overhaul across the supply chain which is a major problem. Different companies may use different Enterprise Resource Planning (ERP) /Manufacturing Execution Systems (MES) which might not be compatible with one another and is extremely expensive to standardize.
5 potential lost opportunities. There is a lack of platforms for manufacturers to be able to reuse their past manufacturing data in order to showcase their abilities and get more clients.
While the research community works towards solving several problems associated within the shop floor, adequate attention has not be given to the problems of the interaction between manufacturers and their potential clients. An analogy to this problem is the one solved by Google in 1999 which is helping a website being found by a person browsing the internet. The resulting research motivation is loosely based on the same idea: How can we use existing and advancing technologies to enable the manufacturer and the client find each other while meeting their personal requirements of data security, extracting value out of their existing datasets and complete part tracking from cradle to grave?
1.3. Research Motivation
The described problem background immediately leads to two research questions, each of which has been discussed in detail as below:
6 resulted in a massive increase in the growth of product designers and amateurs who are more interested in making things for recreational or professional purposes. The design process barriers have been reduced but the barriers for finding the right manufacturer still exists. Design software was so complex that a user had to understand the various geometrical and topological requirements required by graphics engines to be able to render parts/assemblies in 3D. Today, design software has significantly advanced by providing powerful tools to those not skilled in the trade to be able to design new products with much ease.
This increase in the ease of design has not translated into ease of finding manufacturers suited for making the prototypes on short production runs for these new designers who have entered the manufacturing space.As such, the most popular way of connecting designers with manufacturers has been through 2 traditional mediums: Personal connections and via consultants. Recently, there are a number of startup companies that are trying to solve these problems of connecting manufacturers to the product designers [10] [11] [12] [13]. However not all of them are using the 3D shape data for finding the right manufacturers. Instead they rely on bidding amongst the existing manufacturers on their platform on the 3D models. As a result, there are no trivial ways of connecting manufacturers with product designers apart from the ways mentioned above.
7 adoption of these techniques has been the lack of manufacturing context in the algorithms developed for computer graphics which are primarily motivated by shape recognition rather than taking into account associated applications or the processes that need to be performed to make these shapes.
Therefore, a simple way of enabling manufacturers to find designers and vice versa will be development of a search engine which would allow designers to upload their designs along with associated requirements such as material/tolerance/process requirements on a repository shared by the manufacturers.
Figure 1-1: A manufacturing services search engine.
8 2. Enabling trustworthiness of the manufacturers and enhancing connectivity on the
digital thread : Significant resources need to be spent to keep the supply chain information relevant and updated in the modern manufacturing set up. This problem becomes exponentially larger with increasing size of supply chains and increasing complexity of part designs and organizations resulting in high expenditures for the companies involved and increase in product lead times. Often this updating requires site visits by companies which want to outsource manufacturing which is an added expense for companies and time needs to be spent by the manufacturers to keep updating their own process plans. The importance of updated manufacturer capabilities and thus, the trustworthiness of the manufacturer cannot be overstated. Large organizations are often hesitant on changing their established suppliers because they trust them to make sure they are handling their projects in a compliant manner and keep the companies updated on their progress. The closer a manufacturer works with a designer/contractor, the more trusted they are. Therefore it becomes important to monitor and analyze not just the manufacturer, but also the parts they work on through the supply chain.
9 ensuring a meaningful interaction on a thread is a major technical challenge. There are several competing paradigms at play here:
a. The need of the manufacturer to make minimal changes to their own machines and internal systems.
b. The need of the large organization/contractor for an overhaul of the supply chain c. The need for transparency for the contractor and at the same time secrecy from
other contractors from peering into their existing supply networks.
An inspiration to the solution to these research problems has come from the recent developments in cryptocurrencies. Cryptocurrencies are based on the development of decentralized and distributed databases called blockchains [18]. Blockchains allow for the development of applications which require no central parties to host a database and ubiquitous data storage and computation.
10 The use of the blockchain allows for new methods of establishing a “trustless” system where there is no need to trust an individual but rather trust the system which works in a determistic and transparent manner to all its participants. Participation in such a system would allow manufacturers and contractors new ways to find each other in a manner which is consistent with both their objectives of transparency, connectivity and competition.
1.4. Dissertation Objectives
11 Research Objective 1: To develop a search engine suitable for manufacturing capable of handling the multimodal requirements of the designers’ requests.
Manufacturers accumulate large amounts of data in the form of the CAD/CAM models they use when they make parts for the product designers in a physical form. This data is often rich in semantic information containing shapes of the parts, their tolerances, material information and text annotations, in essence a rich dataset which codifies their capabilities and experience in the conductance of this project. We propose a concept for a multimodal search engine which takes this semantic information into account and enables manufacturers to index their past work with the engine in a manner which is suitable for fast querying while adequately obfuscating the critical information of the part design, thus ensuring data confidentiality. We present a search and ranking mechanism which allows fair ranking for manufacturers based on their experience levels in an objective manner which to our knowledge is the first documented effort in terms of a manufacturing services search strategy. Advancements in GPU based computations allow for extending search based methodologies and improving the shape classification and retrieval results using deep neural networks. This is further explored in chapter 3.
Research Objective 2: To enable development of a decentralized mechanism for part provenance, establishment of a public digital thread and a trust rating for a manufacturer
12 demonstrate the utility of the architecture, the best configurations for optimal performance and discuss the associated smart contracts. We also introduce a token contract based on prevailing standard contracts which we have extended to make them suitable for adoption in manufacturing contexts. These tokens were tested on multiple existing public blockchain networks and the results for the same have been presented with a discussion on the direction which the convergence of manufacturing and blockchain might take in the future.
1.5. Dissertation Outline
13 References
[1] Vijayaraghavan A., Huet L., Dornfeld D.A., Sobel W., Blomquist B., Conley M., Addressing process planning and verification issues with MTConnect, Transactions of the North American Manufacturing Research Institution of SME, 2009; 557-564
[2] Hannelius, T., Salmenpera, M., & Kuikka, S., Roadmap to adopting OPC UA., 6th IEEE International Conference on Industrial Informatics, 2008; 756-761.
[3] Hunkeler, U., Truong, H. L., & Stanford-Clark, A., MQTT-S—A publish/subscribe protocol for Wireless Sensor Networks, 3rd international conference on Communication systems software and middleware 2008; 791-798
[4] Hiller, J. D., & Lipson, H. (2009, August). STL 2.0: a proposal for a universal multi-material additive manufacturing file format. In Proceedings of the Solid Freeform Fabrication Symposium (No. 1, pp. 266-278).
[5] Xu, X. W. (2006). Realization of STEP-NC enabled machining. Robotics and Computer-Integrated Manufacturing, 22(2), 144-153.
[6] Kim, H. M., & Laskowski, M. (2018). Toward an ontology‐driven blockchain design for
supply‐chain provenance. Intelligent Systems in Accounting, Finance and Management, 25(1), 18-27.
[7] Glover, D. G., & Hermans, J. (2017). Improving the Traceability of the Clinical Trial Supply Chain. Applied Clinical Trials, 26(11/12), 36-38.
14 In Innovations in Information Technology (IIT), 2015 11th International Conference on (pp. 184-189). IEEE.
[9] Angrish, A., Starly, B., Lee, Y. S., & Cohen, P. H. (2017). A flexible data schema and system architecture for the virtualization of manufacturing machines (VMM). Journal of Manufacturing Systems, 45, 236-247.
[10] ThomasNet, (2017, November 22). Retrieved from https://www.thomasnet.com/
[11] Xometry CNC Machining and 3D Printing Services. (2017). Retrieved from https://www.xometry.com/
[12] Maketime Streamlined CNC Machining Procurement. (2017). Retrieved from https://www.maketime.io
[13] Fictiv Online Manufacturing Platform. (2017), Retrieved from https://www.fictiv.com/ [14] Funkhouser, T., Min, P., Kazhdan, M., Chen, J., Halderman, A., Dobkin, D., & Jacobs,
D. (2003). A search engine for 3D models. ACM Transactions on Graphics (TOG), 22(1), 83-105
[15] Iyer, N., Jayanti, S., Lou, K., Kalyanaraman, Y., & Ramani, K. (2005). Three-dimensional shape searching: state-of-the-art review and future trends. Computer-Aided Design, 37(5), 509-530.
15 [17] Hedberg, T., Lubell, J., Fischer, L., Maggiano, L., & Feeney, A. B. (2016). Testing the digital thread in support of model-based manufacturing and inspection. Journal of computing and information science in engineering, 16(2), 021001.
[18] Nakamoto, S. (2008). Bitcoin: A peer-to-peer electronic cash system.
16 Chapter 2: “Fabsearch”- A 3D CAD Model Based Search Engine for Sourcing
Manufacturing Services
Angrish, A., Craver, B., Xu, X., & Starly, B. (2018, September). A Search Engine for Manufacturers Using Product Manufacturing Information (PMI) Enhanced 3D Model Search. In ASME 2018 13th International Manufacturing Science and Engineering Conference. American Society of Mechanical Engineers Digital Collection.
2.1. Introduction
17 service providers necessary for the production of one-off parts or personalized products since suppliers may need to constantly change due to the need for reduced cost and faster delivery times.
18 advertising expenses spent by the SME in order to rise up in search results in these web based platforms.
In this chapter, “FabSearch”, a prototype to connect manufacturing service providers with users who are searching for their services by having them conduct a 3D model based search query to find manufacturers is proposed. The algorithm would generate a ranked list of service providers who are best suited to fabricate the part. The underlying assumption is that finding the best manufacturing process service providers for a particular query part design model amounts to finding the ones who have made similar parts to the query part with comparable material specifications and tolerance requirements in the past. If an assumption is made that service providers are willing to share specific shape signatures of part models they have built in the past, our algorithm captures the shape signature of the 3D model query based on information contained with its definition, and then compares it against a repository of part models built previously by the manufacturing service provider. This concept would be a shift away from how new manufacturing service suppliers are found and sourced. The design of the part and information contained within it drives the supplier search process as opposed to selecting service providers through human trust based relationships. The remainder of this study describes the process through which a ranked list of supplier services best suited to make a particular query design part is generated. Our algorithm is tested against more than 2000 product models assumed to be shared by 13 service providers with various process capabilities.
2.2. Related Work
19 geographic location, experience, cost etc. As a result, a large body of research has been performed with regards to optimal manufacturer selection across various product category domains of aerospace, automobile, textiles and semiconductor industries. The optimality of choice often depends on several constraints such as manufacturer competence, experience, trust level and the management structure with the values of these metrics often subjectively decided by the team conducting the pruning and selection process. Since the problem of supplier selection is often a multidimensional one involving several stakeholders, the most popular methodologies for solving them have been the techniques used in multi criteria decision making (MCDM) tools such as Analytical Hierarchy Process (AHP), Analytical Network Process (ANP), Fuzzy AHP (F-AHP), TOPSIS etc. Relevant work by Noci et al [5] and Lee et al [6] develop a green supplier selection in different industry types by the use of AHP and ANP methods. Similarly, there have been several works extending the AHP/ANP methodologies using fuzzy techniques by Kahraman et al [7], Kilincci and Onal [8] and Chamodrakas et al [9] for identification of suppliers for the manufacturing of consumer products in electronic marketplaces. Similarly, extensive work has been done using methodologies such as TOPSIS, as explained in the works by Boran et al [10], fuzzy hierarchical TOPSIS for generating supplier rankings by Wang, Cheng and Huang [11] and similar work by Liao and Kao [12]. A major limitation of these approaches is that these techniques often rely on subjective assessment of various characteristics of the vendors based on “expert” opinion, which can often be misleading and suffers from the lack of solution generalizability.
20 main benefit of these techniques is that they allow a robust approach towards solving multi-objective problems with a given set of limitations. Often these are complimented by the use of genetic algorithms. Some of the more popular works in this area are by Xu and Ding [13] and Sadeghieh et al [14]. Liao and Rittscher also demonstrated the use of multi-objective supplier selection under stochastic demands [15]. Similar works extend the idea for solving the same problem under period assembly constraints [16]. Approaches based on linear multi-objective optimization are more robust mathematically compared to MCDM methods. However, they also suffer from the problem of subjectivity in their initial assumptions used to drive the selection process.
A number of academic papers have made use of a multitude of parameters pertinent to manufacturing such as energy consumption, transportation costs, inventory management etc. to drive the supplier service selection process in discrete manufacturing. Such metrics are relatively easily obtained or may be simulated with appropriate distributions based on historical data. At the same time, data based on subjective criteria such as quality of past work, trust levels and product design requirements and historical manufacturer performance are very hard to obtain and can often vary based on the team conducting the selection. As a result, to the best of the authors’ knowledge, no papers have been published which utilize the product manufacturing information (PMI) such as the computer aided design models (CAD models), tolerance requirements and the material requirements for a given design to search suitable manufacturers for the part design who have the best expertise and experience needed to fabricate the part.
21 Iyer et. al. [17] divides major methods of shape search into major categories: Manufacturing feature recognition (feature relationship graphs [18]), global feature descriptors [19][20], local feature descriptors [21], graph based methodologies [22] and Histogram based [23][24][25] techniques. As discussed in the study, shape search algorithms can have a variety of applications beyond the areas of computer graphics. When combined with appropriate databases and tacit domain knowledge, these applications can find numerous applications in manufacturing. Recent advances in computer vision techniques to search for complex shapes are enabled by the use of Extended Gaussian Images [26] and Convolutional Neural Networks [27][28] which often rely on supervised learning methods for classification and retrieval tasks. However this is often achieved at high computational costs and with large amounts of training data involved to train these networks. These methods are not directly applicable to solving the problem of manufacturer search which relies not just on the shape of the 3D part, but also on related process specifications such as assigned material, geometric and dimensional tolerance requirements on part features that play a direct role on the process planning and appropriate suppliers who can adhere to such specifications. There has been no reported work on the use of shape search methodologies for supplier selection in manufacturing.
2.3. “Fabsearch” System Overview And Methodology
22 will not be able to automatically seek and find such experienced manufacturers. If such users had the ability to search for service providers who have done similar jobs, product development times could be shortened yielding better quality results and faster product lifecycle times. Hence, the central paradigm for the development of a manufacturing search engine is the following: Manufacturers who have worked with similar parts in the past are more “suitable” for making a new part of the product assembly system, since they have the tacit knowledge and the tools available for the new projects based on experience and data available from old projects.
23 Figure 2-1: Manufacturing search engine matching query part to historic parts produced by
manufacturers.
Assuming that if the manufacturers share signatures of CAD data in the form of .STEP files of the parts from their previous projects in Figure 2-1(subset1), the search engine can compute a shape signature for the CAD model with the part specific metadata and store the information in a database (subset 2). When a designer needs to make a part, they upload their own CAD model to the engine, which calculates the signatures for the query model and then compares the signatures against the database which then results in the ranking of manufacturers based on their past experience of making similarly shaped parts with similar material assignments and GD&T specifications (sub-set Region 3 and 4 of Figure 2-1).
24 voluntarily by the manufacturers for the parts that have been made by them in the past. The shape signature shall allow us to build an undirected K nearest neighbor graph search space followed by a Bayesian ranking algorithm.
2.4. Development of 3D Part Model Dataset – “FabWave Repository”
To adequately test the search engine algorithm, a large number of 3D engineering definitions of 3D part models was required. There are a number of shape based repositories available online [29][30][31][32] which contain different kinds of shapes used by the computer graphics community for the development, validation and testing of shape classification and retrieval algorithms. However, data contained in these repositories contain 3D models of assemblies with incomplete information necessary to fabricate the part. For example, the models in the repository contain surface mesh data without the necessary boundary representation (B-REP) information required to fully define part models. The most popular repository for engineering parts - Engineering Shape Benchmark(ESB) [30] was developed by Jayanti and Ramani et. al with about 867 engineering oriented models. The repository contained models belonging to 3 main categories: Flat-thin wall components, Rectangular-cubic prism and solids of revolution, with several varying components in each of the three categories. The repository still lacked sufficient number of models with data only stored in the .STL and .OBJ formats therefore losing all feature level and associated meta-data (units, material, geometric tolerance) necessary for fabrication.
25 original author were included in the automated crawl and retrieval. In the second approach, a template model was built for standard parts (ex. washers, rings, bolts, seals etc.) of a part and iterated through parametric variations on the features based on standard dimensions obtained from websites of part supply companies such as McMaster-Carr and Global Spec. As of Sept 2018, more than 100,000 engineering part models in either their native CAD format (such as Fusion .f3D) or in the cross platform .STEP format have been collected and are being continuously updated. The full repository is available for access at http://www.dimelab.org/fabwave [33].
Figure 2-2: Sample of non-standard components.
26 parts. Every part generated within the repository has a 32 bit unique id assigned to ensure similar names were not generated. A related meta-data document was also generated for each product model such as the volume, surface area, volume/surface ratio, number of features. A sample set of the parts used in this study is as shown in Figure 2-3:
Figure 2-3: Examples of standard parts (Screws, Washers, Sprockets, Brackets, and Retaining Rings).
The models were segmented further with the following criteria:
1. Standard parts were broken down into subcategories as identified by conventional naming classification of these parts. Such sub-categories included brackets, washers, pipe fittings, o-rings, seals, springs, screws etc.
2. The Non-standard parts were assigned to a large unassigned group and were classified under manufacturing process categories as opposed to part name categories.
27 • Material: Metals (Stainless Steel, Titanium, Fe, Cu) and Nonmetals (Plastics such as PP,
Urethane etc.)
• Tolerances: The simulation code was written to generate only the tightest dimensional tolerance for each part which was assigned using a sampling from an appropriate uniform distribution. The reasoning behind using only the tightest dimensional tolerance is the assumption that if the manufacturer can achieve the tightest tolerances, they are capable of producing parts with lower tolerances specifications as well. After the tolerances were assigned, K-Means clustering was used to segment them into 3 clusters: standard, medium and high tolerances.
• Manufacturing processes: Each part was assigned the manufacturing processes that would be required for making the parts with the required tolerances. While some parts may need multiple manufacturing processes, for the purposes of this study, only the “dominating” manufacturing process which will meet the majority of manufacturing tolerances required was considered. This was also used for further subdividing the non-standard parts into 4 process categories: Casting, Machining, Forming and Molding.
29 Table 2-1: Manufacturer Service Provider Assignment by Process Category.
Manufacturer Casting Forming Machining Molding Grand Total
A 329 329
B 334 334
C 339 339
D 346 111 457
E 96 96
F 105 105
G 83 92 175
H 84 84
I 76 76
J 15 81 96
K 12 12
L 15 15
M 15 15
30 Table 2-2: Part assignments by process.
Parts
Castin
g Forming
Machinin
g Molding
Grand Total
Bearings 58 58
Bolts 10 10
Brackets 54 54
Casting 57 57
Forming 46 46
Machining 255 255
Molding 67 67
Other 78 78
Pipe Fittings 33 33
Retaining Rings 207 207
Rollers 14 14
Slotted Oval Head
Screws 50 50
Socket Head Screws 202 202
Sprockets 277 277
Unthreaded Flanges 11 11
Washers 714 714
31 Table 2-3: Part assignment by tolerance.
Tolerance Ranges
Parts High Medium
Standar
d Grand Total
Bearings 58 58
Bolts 10 10
Brackets 54 54
Casting 57 57
Forming 46 46
Machining 255 255
Molding 67 67
Other 78 78
Pipe Fittings 33 33
Retaining Rings 207 207
Rollers 14 14
Slotted Oval Head
Screws 50 50
Socket Head Screws 202 202
Sprockets 277 277
Unthreaded Flanges 11 11
Washers 714 714
32 Table 2-4: Manufacturer assignment by part.
2.5. Shape Analysis methodology
Spherical Harmonics [25] was used for our implementation to capture the shape signature of the part. This descriptor was designed for rigid body search which is appropriate for the rigid parts contained within the dataset. It is an established and a well-known global shape descriptor, inexpensive to compute (~0.28s on average on the FabWave dataset), has good discriminative ability (~65% on the Princeton Shape Benchmark) and is deterministic in nature. The SPH also allows us to compare shapes using simple Euclidean distance between the query signature and signatures of shapes within the search space. A quick overview of the SPH algorithm is as follows:
1. Voxelize the model to R x R x R grid, where R is a whole positive number that allows the model to be sufficiently voxelized to gather enough detail necessary. The value of R, typically ranges from (25 – 28). R=32 was used for our study.
33 3. Convert voxel center coordinates to spherical coordinates with radius R and angles θ
and ϕ
4. Discretize the radius to n concentric spheres and compute the following:
fr(θ,ϕ) = ∑mfrm(θ,ϕ) where
frm(θ,ϕ) = ∑ amnPmn(cosθ)einϕ�(2m+1)(m−|n|)! 4π (m+|n|)!
m
n=−m ...(2)
, where Pmn is Legendre polynomial. This generates a n x m signature unique for each part.
The n x m signatures provides an easy way to compare the shape signatures of different parts. The models in the repository were processed through the SPH algorithm to find their respective signatures for each part. The difference between a query model (denoted Q) and the models in the repository ( ri ∈R) , where R denotes the repository set and ri denotes the i-th model in the repository) by comparing the L2 norm difference of the signatures. The difference may be treated as a distance between the models in multi-dimensional space and therefore maybe used to build a K-nearest neighbor graph [34].
2.6. Backlink Generation
34 is built with each node containing the mapping →{S, M, T} : where P contains the part ID and the triplet {S, M, T} contains the ordered set of the shape signature computed from the SPH method and M denotes the manufacturer made with tolerance T. The S component for Q is used for generation of a KNN graph. At the same time, all the K-nearest neighbors for all the existing parts in the repository can be found. This technique is similar to finding backlinks from all webpages to an existing page in the PageRank algorithm. This allows us to find not only the parts Q ~ ri,s but also ri,s ~ Q. This may be thought of as finding KNN graph for all models including ri,s and Q and converting the directed graph thus generated into an undirected graph. As a result, a more relevant search space for a query part can be found. This process is illustrated in the figure below:
35 The above methodology also enables parts which are mutually similar to each other to be clustered together. Since the nodes of the graph contain the manufacturer information as well, consequently having the “nearest” manufacturers for part Q may be found as well. The nodes contain information about the manufacturer M and the tolerance T, which may then be used to rank the manufacturers using the Bayes Theorem:
P(M = m | (S~Si ∈ �Ki→j ∪ Kj→i� ∩ T = x∈{L, M, H})) ……. (3)
Equation (3) calculates the probability of a given manufacturer ‘m’ belonging to the nodes connected to the query part Q (having shape signature S). This is matched from the bidirectional KNN graph (denoted by Ka→b, where a→b signifying b is in the neighborhood of a) which find similar shapes with tolerances which match the requirement of the search part. The ranked solution would then approximate how close any manufacturer is suited to making the query part, based on historical parts built by each manufacturer service company in the past. The final ranking is sorted in a descending order to generate a list of manufacturers based on a descending order of their capability of finishing the query job fulfilling all of the PMI requirements.
2.7. Results
36 criteria. When the part is processed through the proposed engine, the part is voxelized and SPH signatures are generated for the query model. These signatures are used to find the L2 distance from all the parts in the library and vice versa, using the modification of the KNN graphs. As a result, the following results are observed for query part 1:
Figure 2-5: Sample Query Part and the results (circled shapes indicate the closest shape match).
37 outcomes of the undirected graphs with backlinks lie between 12 – 100 results for the dataset were tested the query against. Other sample parts with the associated results and the suggested manufacturer rankings are as shown in the Figures (Figures 2-6 to 2-8):
38 Figure 2-7: Sample Query 3.
39 Based on the fact that the engine assigned plastic parts to injection molding, 2033 metal parts were left from the repository. The metal parts are categorized into their dominant manufacturing processes and the manufacturers that were assigned to them in the simulation. Each part in the metals category is then run through the search engine and the following two metrics were used to evaluate the search results:
• Metric 1 – Correct Manufacturer Type Assignment: Within each category of manufacturing processes, in how many cases was a part assigned to a manufacturer who specializes in the correct manufacturing process as required for the part. For example, if the dominant manufacturing process for the query part is machining, the part should be assigned to a service provider who specializes in machining (who may or may not be the original vendor assigned at the beginning of the simulation)
• Metric 2 – Original vs New Manufacturer Assignment: If Metric 1 is satisfied (i.e. For the cases where the correct assignments were made), in how many cases was an improved assignment made compared to the one originally given manufacturer for the query part. That means if a part was made by a manufacturer X but the search engine finds a manufacturer Y who has done more similar parts with similar materials and tolerance requirement, the recommended vendor from the engine is vendor Y (which would have been a better assignment compared to X, which was made without any priori information about the vendor).
40 Table 2-5: Search Engine performance on Metric 1.
Category Number of parts Number of correct assignments
Percentage correct assignments
Casting 57 14 25%
Forming 1348 1320 98%
Machining 324 243 75%
Molding(Powder Metallurgy)
2066 1870 87%
Total 2066 1870 87%
41 of features within the part. In 25% of the cases, the parts have been matched to forming and casting manufacturers due to the similarity of designs.
Table 2-6: Search Engine Performance on Metric 2.
Category Improved assignments in
correctly identified parts
Improved assignments as a percent of all parts
Casting 50% 12.5%
Forming 23.4% 22.9%
Machining 51.4% 38.4%
Molding / Powder Metallurgy
35.1% 30.8%
Total 40.0% 34.8%
42 2.8. Discussion
The proposed methodology gives a suitable way for search and evaluation of manufacturers based on their past experience with different CAD models based on designer part requirements. The primary contributions of this study are the development of an appropriate dataset (available for use on request), use of back linked nearest neighbor graphs and the Bayesian ranking for manufacturers based on CAD and metadata similarity, allowing us to find potentially better manufacturers experienced with projects similar to the query parts. The approach benefits from large numbers of models shared by manufacturers with as many different diverse models. The larger the variety of shapes and associated metadata shared by manufacturers, the better the search engine would perform. It is crucial to note that with continuous updating and sharing of the models by the manufacturers, the manufacturer rankings may also change with time. The large amounts of specialized knowledge in the form of experiential learning by the manufacturers might be difficult to harness by machine learning methodology. However, we can rely on their past jobs to project the potential success of working with a similar but new project. Empirically, it can be expected that the cost for the new project execution will be lower because the manufacturer already has the knowledge and possibly even the tooling, material and the experience required for making the part. This can lower the barriers to product development lifecycles by improving the efficiency through which sourcing is conducted.
43 [27] etc. However, these newer shape search algorithms require significant computational power and tremendous amount of training on various classified models to allow deep learning algorithms to perform equally well. Another point of note is that the KNN generation uses a brute force approach to distance calculation which might not scale well as the size of the shared repository increases. Newer approaches towards KNN graph generation using approaches in [37][38][39][40] may be used to speed up the computation as the number of models in the repository increases.
A potential upgrade to the search engine could be the use of additional metadata such as the size of the part, use of the rich annotated text data available with associated PMI of the CAD models. The search engine results are also dependent on the amount of data shared by the individual manufacturing service companies. The search engine should also be able to allow multi-modal query data to be entered, i.e. 3D models with associated text and possibly even images to improve the relevancy of the search results. The search engine should be able to incorporate information from the content available on the manufacturing service providers’ websites to help reach an optimal selection for a designer searching for appropriate manufacturing services for their designs. A possible future version of the search engine could rely on joint embedding of multimodal data such as shape, tolerance and text information into a single higher dimensional manifold by use of neural networks with the objective function to reduce the distance between similar models [41] and [42].
44 service provider to directly share the original 3D model. Rather, only a signature of the part model need be shared with a third-party to increase the chances of the service provider being found. This aspect can perhaps lower the barrier of sharing past work done by a particular service provider, given that the original 3D model cannot be reverse engineered from the obtained signature. If the manufacturers did share the signature of CAD models of previous activities, it is observed that our algorithm is inherently biased towards manufacturers who share more data than those who do not which means deserving manufacturers might not be able to get equal opportunities. However, this is no different than a typical business which lags behind in Google’s search results due to an ineffective Search Engine Optimization (SEO) approach for a particular vendor’s website. To tackle the issue of computing on encrypted data without directly sharing the original files with an external third party is through the use of homomorphic encryption schemes [43] which allow rudimentary computations on encrypted data. Appropriate incentivization mechanisms can also be devised to encourage job shop service providers to share part model data.
2.9. Conclusions
46 References
[1] “Democratizing Manufacturing”, MForesight Report, 2016,
http://mforesight.org/projects-events/democratizing-manufacturing/
[2] Shen, M. J., & Chen, M. C. (2007). The relationship of leadership, team trust and team performance: A comparison of the service and manufacturing industries. Social Behavior and Personality: an international journal, 35(5), 643-658.
[3] http://www.themanufacturinginstitute.org/Research/Facts-About-Manufacturing/Economy-and-Jobs/Company-Size/Company-Size.aspx
[4] ThomasNet, http://adage.com/article/btob/thomasnet-relaunches-enhanced-product-search/287016/
[5] Noci, G. (1997). Designing ‘green’vendor rating systems for the assessment of a supplier's environmental performance. European Journal of Purchasing & Supply Management, 3(2), 103-114.
[6] Lee, A. H., Kang, H. Y., Hsu, C. F., & Hung, H. C. (2009). A green supplier selection model for high-tech industry. Expert systems with applications, 36(4), 7917-7927.
[7] Kahraman, C., Cebeci, U., & Ulukan, Z. (2003). Multi-criteria supplier selection using fuzzy AHP. Logistics information management, 16(6), 382-394.
[8] Kilincci, O., & Onal, S. A. (2011). Fuzzy AHP approach for supplier selection in a washing machine company. Expert systems with Applications, 38(8), 9656-9664.
[9] Chamodrakas, I., Batis, D., & Martakos, D. (2010). Supplier selection in electronic marketplaces using satisficing and fuzzy AHP. Expert Systems with Applications, 37(1), 490-498
47 group decision making for supplier selection with TOPSIS method. Expert Systems with Applications, 36(8), 11363-11368.
[11]Wang, J. W., Cheng, C. H., & Huang, K. C. (2009). Fuzzy hierarchical TOPSIS for supplier selection. Applied Soft Computing, 9(1), 377-386.
[12]Liao, C. N., & Kao, H. P. (2011). An integrated fuzzy TOPSIS and MCGP approach to supplier selection in supply chain management. Expert Systems with Applications, 38(9), 10803-10811.
[13]Xu, J., & Ding, C. (2011). A class of chance constrained multi-objective linear programming with birandom coefficients and its application to vendors selection. International Journal of Production Economics, 131(2), 709-720.
[14]Sadeghieh, A., Dehghanbaghi, M., Dabbaghi, A., & Barak, S. (2012). A genetic algorithm based grey goal programming (G3) approach for parts supplier evaluation and selection. International Journal of Production Research, 50(16), 4612-4630.
[15]Liao, Z., & Rittscher, J. (2007). A multi-objective supplier selection model under stochastic demand conditions. International Journal of Production Economics, 105(1), 150-159.
[16]Che, Z. H. (2010). A genetic algorithm-based model for solving multi-period supplier selection problem with assembly sequence. International Journal of Production Research, 48(15), 4355-4377.
48 [18]Ramesh, M., Yip-Hoi, D., & Dutta, D. (2001). Feature based shape similarity
measurement for retrieval of mechanical parts. Journal of Computing and Information Science in Engineering, 1(3), 245-256.
[19]Khotanzad, A., & Hong, Y. H. (1990). Invariant image recognition by Zernike moments. IEEE Transactions on pattern analysis and machine intelligence, 12(5), 489-497.
[20]Funkhouser, T., Min, P., Kazhdan, M., Chen, J., Halderman, A., Dobkin, D., & Jacobs, D. (2003). A search engine for 3D models. ACM Transactions on Graphics (TOG), 22(1), 83-105.
[21]Bronstein, M. M., & Kokkinos, I. (2010, June). Scale-invariant heat kernel signatures for non-rigid shape recognition. In Computer Vision and Pattern Recognition (CVPR), 2010 IEEE Conference on (pp. 1704-1711). IEEE.
[22]Zhang, Y., Hu, W., Rong, Y., & Yen, D. W. (2001). Graph-based set-up planning and tolerance decomposition for computer-aided fixture design. International Journal of Production Research, 39(14), 3109-3126.
[23]Osada, R., Funkhouser, T., Chazelle, B., & Dobkin, D. (2002). Shape distributions. ACM Transactions on Graphics (TOG), 21(4), 807-832.
[24]Ip, C. Y., Lapadat, D., Sieger, L., & Regli, W. C. (2002, June). Using shape distributions to compare solid models. In Proceedings of the seventh ACM symposium on Solid modeling and applications (pp. 273-280). ACM.
49 [26]Horn, B. K. P. (1984). Extended gaussian images. Proceedings of the IEEE, 72(12),
1671-1686.
[27]Maturana, D., & Scherer, S. (2015, September). Voxnet: A 3d convolutional neural network for real-time object recognition. In Intelligent Robots and Systems (IROS), 2015 IEEE/RSJ International Conference on (pp. 922-928). IEEE.
[28]Su, H., Maji, S., Kalogerakis, E., & Learned-Miller, E. (2015). Multi-view convolutional neural networks for 3d shape recognition. In Proceedings of the IEEE international conference on computer vision (pp. 945-953).
[29]Chang, A. X., Funkhouser, T., Guibas, L., Hanrahan, P., Huang, Q., Li, Z., ... & Xiao, J. (2015). Shapenet: An information-rich 3d model repository. arXiv preprint arXiv:1512.03012.
[30]Jayanti, S., Kalyanaraman, Y., Iyer, N., & Ramani, K. (2006). Developing an engineering shape benchmark for CAD models. Computer-Aided Design, 38(9), 939-953.
[31]Shilane, P., Min, P., Kazhdan, M. M., & Funkhouser, T. A. (2004, June). The princeton shape benchmark. In SMI (Vol. 4, No. 04, p. 00).
[32]Zhou, Q., & Jacobson, A. (2016). Thingi10K: A Dataset of 10,000 3D-Printing Models. arXiv preprint arXiv:1605.04797.
[33]Fabwave Repository, http://www.dimelab.org/fabwave
[34]Dong, W., Moses, C., & Li, K. (2011, March). Efficient k-nearest neighbor graph construction for generic similarity measures. In Proceedings of the 20th international conference on World Wide Web (pp. 577-586). ACM.
50 [36]Riegler, G., Ulusoy, A. O., & Geiger, A. (2017, July). Octnet: Learning deep 3d
representations at high resolutions. In Proceedings of the IEEE Conference on Computer Vision and Pattern Recognition (Vol. 3).
[37]Zhao, W. L., Yang, J., & Deng, C. H. (2017). Scalable Nearest Neighbor Search Based on kNN Graph. arXiv preprint arXiv:1701.08475.
[38]Fu, C., & Cai, D. (2016). Efanna: An extremely fast approximate nearest neighbor search algorithm based on knn graph. arXiv preprint arXiv:1609.07228.
[39]Boutet, A., Kermarrec, A. M., Mittal, N., & Taiani, F. (2016, May). Being prepared in a sparse world: the case of KNN graph construction. In Data Engineering (ICDE), 2016 IEEE 32nd International Conference on (pp. 241-252). IEEE.
[40]Hyvönen, V., Pitkänen, T., Tasoulis, S., Jääsaari, E., Tuomainen, R., Wang, L., ... & Roos, T. (2016, December). Fast nearest neighbor search through sparse random projections and voting. In Big Data (Big Data), 2016 IEEE International Conference on (pp. 881-888). IEEE.
[41]Weston, J., Bengio, S., & Usunier, N. (2010). Large scale image annotation: learning to rank with joint word-image embeddings. Machine learning, 81(1), 21-35.
[42]Xu, R., Xiong, C., Chen, W., & Corso, J. J. (2015, January). Jointly Modeling Deep Video and Compositional Text to Bridge Vision and Language in a Unified Framework. In AAAI (Vol. 5, p. 6).
51 Chapter 3: MVCNN++ : CAD Shape Classification using Multi-View Convolutional
Neural Networks
Angrish, A., Bharadwaj, A., Starly, B. (2019) MVCNN++: CAD Model Shape Classification using Multi-View Convolutional Neural Networks submitted to the Journal of Computing and
Information Science in Engineering (Under review – Equal Contribution by Mr. Bharadwaj)
3.1. Introduction
52 Early methods of shape matching for search involved heuristic methods, or hand-coded functions which were used to generate descriptors for the part, either in numeric or text form. These were then used for shape categorization or search and retrieval based on one of many algorithms. However, these methods lacked adequate generalizability particularly when tested on a large scale. Improvements in hardware and relative easy access to data has brought about a huge change in 3D shape classification algorithms. Convolutional Neural Networks [1] have been shown to be highly accurate for this task, when used for both 2D and 3D-based representations. Voxel-based 3D shape representations are dependent on the resolution of the voxel-space for better performance, and higher resolutions require much higher computing power and time. In contrast, 2D image-based representations of 3D models have been shown to out-perform 3D voxel-based representations [2] with lesser data due to the efficiency of image representations. An added advantage is the opportunity to leverage the rapid progress in image descriptors and the extensive image data available in the form of databases such as ImageNet. [3]
53 manufacturing data coined FabWave was built on a pilot basis. [4] Built to be an ever-expanding source of data, aggregating from different sources in academia and pre-existing repositories, the 3D models within FabWave provide extensive training data for deep learning methods. The FabWave dataset improves on existing standards for 3D CAD data such as the Engineering Shape Benchmark, [5] which are static and do not provide the large volume of data required for training deep learning models.
Current work in using 2D CNNs for shape classification has relied purely on polygon mesh representations of 3D models for image capture. This can particularly be an issue in the engineering domain. Relevant information regarding part design is lost during conversion to polygon mesh, including fundamental properties such as dimensions of the part and assigned material property. Such product manufacturing information (PMI) is critical to improved classification and search relevancy. Image capture of the 3D models cannot compensate for this problem through a global uniform image capture position for all models, since it is essential to capture the maximum information possible through the images. A unique feature of the FabWave Repository is the availability of different file-types of every part along with any associated part metadata. This information is extracted during part processing. Taking advantage of this data, a CNN architecture for classification is proposed, based on multiple views of CAD parts along with the associated part dimension data. The training data is gathered from a set of classified CAD models available within FabWave, for the purpose of training the CNN architecture.
54 shape/feature-based categories and experiments on the retrieval of models from unclassified data. This method can be applied to large scale classification of the thousands of CAD models such as those in the aforementioned sources, along with being implemented in information retrieval for the design and manufacturing sphere. Computing part similarities through features that are learned by neural networks, as opposed to hand-built features, is shown to be highly effective for both classification and retrieval tasks.
3.2. Related work
A large amount of work has been devoted to content-based retrieval of three-dimensional objects over the last four decades, by both the computer graphics and the engineering design communities. Section 2.1 describes classical methods of 3D shape search and retrieval, and section 2.2 elaborates on techniques using Neural Networks or Deep Learning for the same application. This section addresses limitations of existing approaches and gives reasons for new retrieval approaches that are critical to democratizing access to 3D design information available over the web.
3.2.1. 3D Shape Based Retrieval and Classification using Traditional Methods
55 However, this method requires pose normalization to provide rotational invariance. [9] One important method of obtaining a rotation invariant descriptor was described in [11], where the property of the invariance of spherical function energy was used. An application of this method for CAD model retrieval was illustrated in [12], where the Spherical Harmonic signature of the parts was applied to obtain part matches by applying an undirected graph, and matched the parts with manufacturers based on manufacturing process thereon.
Graph-based techniques have been developed in parallel to global feature-based techniques. This graph technique uses the Boundary Representation (B-Rep) structure of the CAD part. This focuses on feature decomposition followed by construction of a model dependency graph to find similar parts, as in the work of Cicirello and Regli. [13] The graph may consist of nodes representing faces, and arcs representing edges. [14] Other approaches have been to use different nodes representing various types of surfaces, [15] Reeb graph based techniques involving relations between nodes of adjacent levels [16] and Skeletal Graphs [17] which convert the model into a skeletal structure representing the approximate structure of the part. While the approaches may differ, most graph techniques involve the use of heuristics to decompose the graph into subgraphs, which can then be used for feature similarity detection. [14]
56 Exhaustive reviews of other classical CAD part recognition techniques are provided in [14], [20] and [21].
3.2.2. Neural Network Methods for Retrieval and Classification
Classification of parts and feature recognition using Neural Networks has been an ongoing field of research from the 1990s to date, with the aforementioned work by Chung and Kusiak [19] being an early example. Prabhakar and Henderson [22] proposed a method for classification that involved developing an adjacency matrix for a part, with topological relations between faces and their geometric descriptions encoded into this matrix. One network for each feature was constructed and the adjacency matrix fed row-by-row into every network, with the one neural net output recognizing a single feature if it is present. A classifier network for generating shape classes for GT applications was proposed in [23], which uses bitmap images to individually generate Opitz classification code for the part. Most of these methods involve a form of part encoding for classification; however, the latest methods of 3D shape classification involve shape descriptors obtained through Convolutional Neural Networks.
Convolutional Neural Networks (CNNs) were explored in 1998 by LeCun et al and were shown to out-perform techniques such as Nearest Neighbors (k-NN) and Support Vector Machines (SVM) for handwriting recognition. [1] However, significant breakthroughs were made with 2D CNNs with the availability of improved computing power and large amounts of annotated data in the form of the ImageNet database, [3] which enabled work on large-scale image recognition, notably by Krizhevsky et al [24] and He et al [25].
57 (DBNs), and VoxNet [28] which uses point cloud data as input, translated to volumetric occupancy grids. FeatureNet [29] describes a 3D CNN based method for machining feature recognition which is able to segment the parts for multiple feature recognition; this work focuses predominantly on prismatic parts and shows high accuracy for classification. However, 3D voxel based methods often result in loss of features, as they are dependent on the resolution of the voxelized model which directly affects the time and computing resources required for training. Small features which are often lost during the voxelization process are often critical during the classification and retrieval process.