Copyright Q 1992 by the Genetics Society of America
Simulation Study of a Multigene Family, With Special Reference
to
the
Evolution of Compensatory Advantageous Mutations
Christopher
J.
Basten’ and Tomoko Ohta
National Institute of Genetics, Mishima, 41 1, Japan
Manuscript received March 10, 1992 Accepted for publication May 18, 1992
ABSTRACT
We investigate the evolution of a multigene family incorporating the forces of drift, mutation, gene conversion, unequal crossing over and selection. The use of simulation studies is required due to the
complexity of the model. Selection is modeled in two modes: positive selection as a function of the number of different beneficial alleles and negative selection against deleterious alleles. We assume
that gene conversion is unbiased, and that all mutations are initially deleterious. Compensation between mutants creates beneficial and neutral alleles, and allowances are made for compensatory
mutations either within or between the members of a multigene family. We find that gene conversion can enhance the rate of acquisition of compensatory advantageous mutations when genes are
redundant.
M
ULTIGENE families are groups of similar genes thought to arise by gene duplications. New genes may evolve when mutations occur in the mem- bers of a multigene family for which selection has been relaxed (OHNO 1970, 1980; KIMURA 1983). Gene duplication events due to unequal crossing over are well documented (MAEDA and SMITHIES 1986). There is evidence that gene duplication may occur at substantial rates (1 0-4- 1 0-6) per locus per generation (GELBART and CHOVNICK 1979; SHAPIRA and FIN-NERTY 1986; MARONI et al. 1987).
Gene conversion is a process in which one segment of DNA contributes genetic information to another, making the “target” identical to the “donor”. Se- quence identity exceeds 96% in the major coding regions of ErA of the early chorion multigene family (HIBNER, BURKE and EICKBUSH 1991). T h e length of such sequences may be tens of thousands of base pairs (VOELKER-MEIMAN and ROEDER 199 1). Tight linkage is observed between two genes in the mouse kallikrein gene family (EVANS, DRINKWATER and RICHARDS 1987), and tight linkage has been posited to increase the rate of gene conversion (SMITHIES and POWERS 1986).
MAIZELS (1989) reviews evidence that indicates gene conversion contributes to gene diversity between members of a multigene family, and that it enhances diversification of a number of genes that respond to developmental and environmental cues. A hypercon- version mechanism is posited to generate the antibody diversity in the chicken immunoglobulin light chain (REYNAUD et al. 1987), wherein there is clustering of
GA 30602.
Genetics 134: 247-252 (September, 1992)
’
Present address: Department of Genetics. University of Georgia, Athens,diversity. An array of pseudo-genes, which for various reasons can not be expressed, show parallel changes. Antibody diversity in the VDJ genes in rabbits is generally found in clusters (BECKER and KNIGHT
1990), and although one gene is used preferentially to make antibodies, there is a great deal of antibody diversity.
Gene conversion may lead to functional diversity in the rat kallikrein gene family (WINES et al. 1991), which has 15-20 members. Gene conversion increases identity between members of a gene family, and thus a greater difference results between species. This may retard the spread of deleterious alleles to important members of the gene family. Alternatively, diversity can be enhanced through exchange of short sequences between members of a gene family, to allow for the reassortment of variants into new combinations. This is similar to what has been shown in the MHC class I
genes of mouse (GELIEBTER and NATHENSON 1987). For the evolution of a gene with a new function, it may often be the case that mutations are singly dele- terious but compensatory advantageous (KIMURA
248 C. J. Basten and T. Ohta
(a) Initial state 0 0 0 0 0 0 0 0 0 0 (b) First mutant 0 0 0 0 - 1 0 0 0 0 0
(c) Later mutant 0 - 2 2 5 0 0 - 1 0 0 0 0 0
(d) Much later mutant 0 -225 0 0 -1 0 0 0 0 -1050 (e) After compensation 0 225 0 0 1 0 0 0 0 1050
(f) Neutral allele 105 0 0 0 1435 0 0 0 734 0
FIGURE 1 .-Example of the change in an allele with 10 sites due to mutation or conversion. (a)-(e) show events that produce the beneficial allele (e). An example of a neutral allele is given in ( f ) ,
while (b) and (c) are both deleterious.
but genes in multigene families can change by muta- tion and gene conversion. Relaxed selection in some members of a multigene family will allow for the accumulation of variation within them. Gene conver- sion transfers some of this variation into active genes.
A good example of the above mode of evolution is the stomach lysozymes of ruminants, with evidence coming from deer and pigs (JOLL~S et al. 1989) and langurs (STEWART, SCHILLING and WILSON 1987). A series of amino acid substitutions occurred in these lysozymes in a rather short period of time, suggesting that compensatory advantageous subtitutions provide desirable properties of the lysozyme in the stomach environment. There are indications that 50% of these substitutions in langurs are the result of positive Dar- winian selection. Langur sequences converged on those of the cow, and this occurred while the lyso- zymes were acquiring a new function (STEWART, SCHILLING and WILSON 1987). Intergenic recombi- nation is also posited to play a role (IRWIN, PRAGER and WILSON 1992).
Here we examine the evolution of multigene fami- lies incorporating mutation, gene conversion, unequal crossing over, selection, and drift. Special attention is paid to the effect of gene conversion on the evolution of compensatory advantageous mutations. T h e accu- mulation of the number of beneficial alleles with compensatory mutations is examined. We show that gene conversion may increase the rate of accumula- tion of such beneficial alleles under realistic condi- tions.
FORMULATION OF THE MODEL
T h e model is similar to that of previous studies (OHTA 1987; 1988a,b,c; 1989) extended to incorpo- rate gene conversion. T h e simulations model a popu- lation of monoecious, diploid individuals evolving in discrete time with nonoverlapping generations. Each generation incorporates the forces of mutation, un- equal crossing over, gene conversion, random sam- pling and selection. A gene array ( i e . , multigene fam- ily) consists of one or more loci arranged linearly, and individuals each contain two homologous arrays. Each locus has a gene with 10 sites, each of which has the initial value of 0 (zero). Unequal crossing over occurs at a rate per locus per generation. If unequal cross-
e e
a2 b2
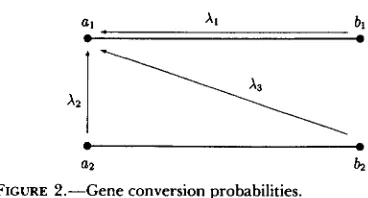
FIGURE 2.--Gene conversion probabilities.
ing over occurs during meiosis, the rightmost locus of one array pairs with the next rightmost gene of the homologous gene array, and crossing over occurs between a randomly selected pair of consecutive loci. This may entail nonhomologous pairing, e.g., if there is one locus per array. Mutations occur at a constant rate p per gene per generation. Mutations are not lethal, but all are deleterious. Basically, we model a situation in which mutations are individually delete- rious, but can become advantageous when another mutation occurs which compensates the original one. Such a model may be suitable for the evolution of protein function, when the function depends upon complex higher order structures. All new mutants are unique, and are marked at one of their 10 sites by consecutive negative integers, i.e., the first mutant that occurs will be marked with -1, the second -2, etc. Figure 1 shows how a new, beneficial allele might be created by compensation within a gene (defined below). T h e original allele is in the first line, and the first mutant is marked with the integer -1. Later mutation or gene conversion will bring together mu- tants that compensate one another. In this case, we assume that compensation occurs when a gene has two mutant sites, each of which are a multiple of -5.
We assume that gene conversion is unbiased and no symmetric heteroduplexes are formed. Three distinct rates of gene conversion are distinguished: between alleles at different loci on the same gamete
(XI),
be- tween alleles at the same locus(X,)
and between alleles at different loci and on different gametes within in- dividuals(X3)
(see Figure 2). T h e parameters for gene conversion are illustrated in the schematic (Figure 2), where A and B are arbitrary loci. In the simulations, two genes are picked at random from an individual. They are at the same locus on different chromosomes with probabilityX,,
and on the same chromosome with probabilityXI.
Two sites within the gene are chosen at random, and the sites between those two points are made identical (one gene converts the other).Multigene Family Evolution 249
compensation occurs when two genes in a gene array each have a site which is a multiple of
-5.
In one of these genes, all the negative sites are made positive. If an allele is composed entirely of non-negative sites, and at least one site is a multiple of 10, then it is considered to be a beneficial allele. T h e original allele (all zeros) is also assumed to be beneficial. Neutral alleles have all non-negative sites, but no multiple of ten. Any allele marked with a negative site is delete- rious.We model selection in two phases: positive selection on an individual based on the number of different beneficial alleles it possesses relative to the population average, and negative selection on a gene array based on the number of deleterious sites. If
k,
is the number of different beneficial alleles in an individual i, andK
the average of the
k,,
then the selective value of an individual, w+,, can be written:where s+ is the positive selection coefficient.
Negative selection coefficients are calculated for gene arrays, and we use two different methods for modeling it. If an array possesses at least one neutral or beneficial allele, relaxed negative selection means that there is no decrease in fitness regardless of the other alleles. When selection is unrelaxed, the total number of deleterious sites in an array determines the negative fitness component. Let 1, be the copy num- ber, d, the number of deleterious genes and mj the total number of mutant sites on the jth array, respec- tively. If selection is relaxed, then we can write
if lj = 0
for d h
<
Z,
w-,j = if dj =
Z,
( 2 )For unrelaxed selection we have,
w- ' =
if 1, = 0
exp[ -s-(mj/Z,)] else (3)
Analogous to s+, we have the negative selection coef- ficient s-. When selection is a factor, s+ and s- will be small positive numbers. Simulations use either ( 2 ) or
Finally, a new generation of N individuals is created from the old by randomly choosing 2N gene arrays with replacement subject to weighting by the above selection functions. If selection were absent, each ga- mete would have a probability of 1 / 2 N of being cho- sen. Selection modifies this weighting in the following manner. For convenience, a diploid individual i, i =
1,
. . .
, N , will have gene arrays numbered i and i+
(3).TABLE 1
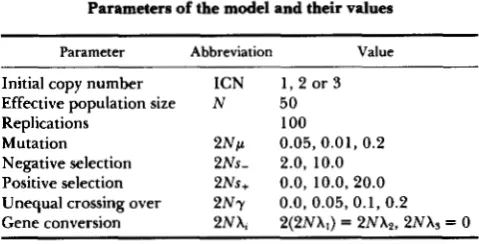
Parameters of the model and their values
Parameter Abbreviation Value
Initial copy number ICN 1 , 2 or 3 Effective population size N 50
Replications 100
Mutation 2 N p 0.05, 0.01, 0 . 2 Negative selection 2Ns- 2.0, 10.0
Positive selection 2Ns+ 0.0, 10.0, 20.0 Unequal crossing over 2 N y 0.0, 0.05, 0.1, 0 . 2 Gene conversion 2NX, 2(2NX1) = 2NX2, 2NXs = 0
N . We define an overall selective value for individual
i,
W + J w-,i W-,i+N
vi =
w+,j W - , j + N
that corresponds to a probability that this individual contributes a gamete to the next generation. Arrays i
and i
+
N are each assigned a probability ( v i / 2 ) of being picked when creating a new individual.NUMERICAL RESULTS
For brevity, we write ICN for the initial copy num- ber, NDBA for the average number of different ben- eficial alleles and NGDM for the average number of genes with deleterious mutations per gene family, respectively. In the tables, Pos. Div. and Neg. Div. are the positive and negative divergences, respectively, and are merely the proportion of sites per gene that are marked by positive or negative integers. Table 1 lists our parameters, their symbols and possible values. T h e parameters for mutation, selection, gene conver- sion and unequal crossing over are written as compos- ites, each multiplied by 2 N . In this manner we can change the value of N while keeping the composite parameters constant and obtain roughly the same results if time is scaled in terms of N generations.
When simulations were done with the same param- eters of an earlier paper (OHTA 1988c), the same qualitative results obtained. Herein we investigate the interaction between gene conversion and selection and how it effects the copy number and the number of beneficial genes.
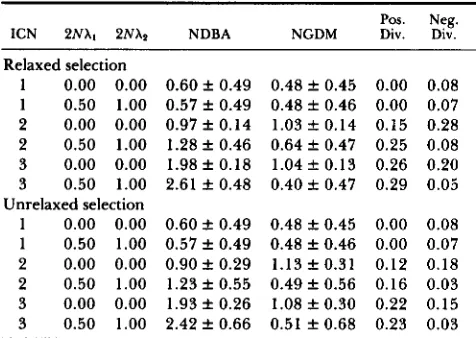
Table 2 presents the simulation results with and without gene conversion, where compensation occurs within genes that have 10 sites. Here, the compensa- tory factor is 5 and the following parameters are used:
N = 50, 2Ncc = 0 . 2 0 , 2Ns+ = 20, 2Ns- = 2 and 2NXs = 0.0. Figures in the table are the average k SD of
100 replications calculated at generation 1 OON. Only the average is given for divergence. In this set of simulations, no unequal crossing over is assumed ( 2 N y = O.O), and the copy number is constant. T h e conver- sion rate among alleles (X,) is twice that between loci
250 C . J. Basten and T. Ohta
TABLE 2
Simulation results with and without gene conversion
Pos. Neg. ICN 2NXt 2NXn NDBA NGDM Div. Div.
Relaxed selection
1 0.00 0.00 0 . 6 0 f 0.49 0.48 f 0.45 0.00 0.08
1 0.50 1.00 0.57 f 0.49 0.48 f 0.46 0.00 0.07 2 0.00 0.00 0 . 9 7 f 0.14 1.03 f 0.14 0.15 0.28 2 0.50 1.00 1 . 2 8 f 0.46 0.64 f 0.47 0.25 0.08
3 0.00 0.00 1.98 f 0.18 1.04 f 0.13 0.26 0.20
3 0.50 1.00 2.61 f 0.48 0.40 f 0.47 0.29 0.05
1 0.00 0.00 0 . 6 0 f 0.49 0.48 f 0.45 0.00 0.08 1 0.50 1.00 0.57 f 0.49 0.48 f 0.46 0.00 0.07 2 0.00 0.00 0 . 9 0 f 0.29 1.13 f 0.31 0.12 0.18 2 0.50 1.00 1.23 f 0.55 0 . 4 9 f 0.56 0.16 0.03 3 0.00 0.00 1.93 f 0.26 1.08 f 0.30 0.22 0.15 3 0.50 1.00 2.42 f 0.66 0.51 f 0.68 0.23 0.03 Note: See text for parameter values. NDBA and NGDM are the number of different beneficial alleles and the number of genes with deleterious mutations, respectively, per gene array. Pos. Div. and Neg. Div. are the positive and negative divergences.
different beneficial alleles increases by conversion when the copy number is two or more. In other words, when genes are redundant, conversion helps to spread compensatory mutations. This is because conversion brings these mutations together. It is also noted that positive divergence is accelerated when genes are redundant, because selection works effectively. Gene conversion also decreases the level of negative diver- gence in this case.
In order to see the generality of the effect of con- version, simulations were performed under different levels of conversion rates, mutation rates and selection intensities. Tables 3 and 4 summarize the results, wherein the initial copy number is 1 and there are 10
sites per gene. Negative selection is relaxed, compen- sation is within genes, time is generation 100N, the compensatory factor is 5 and the following parameters are used: N = 50, 2Ns+ = 10, 2NXs = 0.00. Table 3
sets 2Ns- = 2 while Table 4 sets 2Ns- = 20 and the results are the average f SD of 100 replications, al- though only the average is given for divergence. Un- equal crossing over is incorporated starting from a single gene, with the rate 2N7 = 0.2, and thus the copy number increases. T h e data in the table tell us that conversion is effective only when the mutation rate is high. It is likely that when the mutation rate is low, there are not enough mutations to be rearranged by gene conversion. Gene conversion is more effective if negative selection is weaker, although copy number is increased in either case.
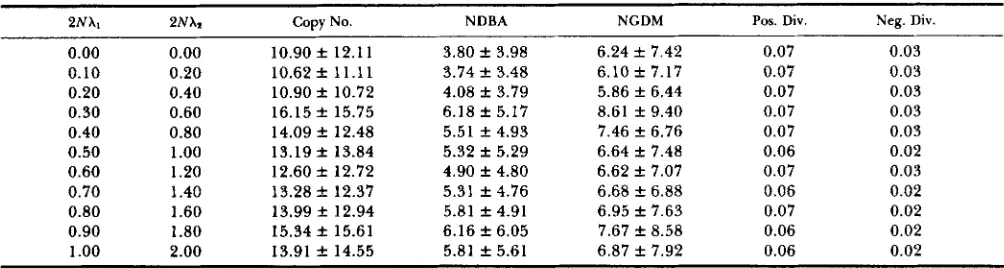
Table 5 gives the effect of increasing the conversion rate under a favorable condition: high enough rates of mutation and unequal crossing over. Initially, copy number is 1 and there are 50 sites per gene. Negative selection is relaxed, compensation is within genes, time is generation IOON, the compensatory factor is
Unrelaxed selection
5 and the following parameters are used: N = 50, 2Np
= 0.20, 2Ns+ = 10, 2Ns- = 2, 2N7 = 0.20, 2NXs =
0.00. Figures are the average f SD of 100 replications and only the average is given for divergence. As can be seen from the table, both the number of different beneficial alleles and the copy number increase by increasing the conversion rate. T h e accumulation of five to six beneficial alleles starting from a single gene within a period of lOON generations means that this system is highly efficient.
So far, only cases of
X1
= 2x2 with As = 0 are presented. We have performed several other cases, but the results are similar and thus not shown here. Such simulations indicate that the total rate, X, +X2+X3, is important for accelerating the rate of spreading
of compensatory mutations.
DISCUSSION
Our simulation studies have verified that conversion accelerates the evolution of compensatory advanta- geous mutations, when the mutation rate is high enough and genes are redundant. It appears that these conditions are often satisfied in real gene families like those of cow lysozyme (IRWIN and WILSON 1990),
primate 7-globins (FITCH et al. 1991), and rat kalli- krein (WINES et al. 1991).
It should be remembered that compensatory evo- lution proceeds through an intermediate deleterious state and is very slow at ordinary single copy genes. Kimura (KIMURA 1985) has shown that tight linkage between the interactive sites enhances the rate, but even so, the compensatory evolution is very slow when
4Np is less than unity. When genes are redundant, the rate is greatly accelerated if 4Np
<<
1 (OHTA 1 9 8 8 ~ ) .This is because, for a single locus, the compensating second mutation must occur while the first mutation is kept in low frequency by mutation-selection balance, whereas the first mutation can increase its frequency for redundant genes due to relaxed constraint. Our study has shown that gene conversion further accel- erates the rate. T h e results .of Table 3 indicate that frequent gene conversion allows the accumulation of twice as many beneficial genes as compared with the case of no conversion. If compensatory mutations are genuinely needed by the organisms, such an effect would be quite significant.
Multigene Family Evolution 25 1 TABLE 8
Effect of changes of X, and XI under various conditions
2 N r 2NX1 2 N An Copy No. NDBA NGDM
0.05 0.0 0.0 2.48 f 2.02 1.25 f 1.15 1.16 f 1.15 0.13 0.1 1 0.05 0.10 0.20 4.91 f 5.09 1.29 f 0.96 2.56 f 3.54 0.04 0.06 0.05 0.20 0.40 6.36 f 7.10 1.54 f 1.44 3.56 f 5.00 0.04 0.07 0.05 0.30 0.60 4.91 f 5.47 1.42 f 1.33 2.68 f 4.21 0.03 0.06 0.05 0.40 0.80 5.83 f 5.65 1.40 f 1.22 3.40 f 4.25 0.04 0.07
Pos. Div. Neg. Div.
0.10 0.0 0.0 4.28 f 4.28 1.76 f 1.56 2.36 f 2.92 0.18 0.1 1 0.10 0.10 0.20 5.85 f 5.34 1.85 f 1.81 3.27 f 3.71 0.09 0.09 0.10 0.20 0.40 6.61 f 6.75 2.00 f 1.99 3.93 f 4.75 0.10 0.10 0.10 0.30 0.60 7.65 f 8.59 2.30 f 2.71 4.36 f 5.32 0.12 0.09 0.10 0.40 0.80 7.43 f 7.56 2.28 f 2.40 4.30 f 4.76 0.10 0.10
Note: See text for parameter values. NDBA and NGDM are the number of different beneficial alleles and the number of genes with deleterious mutations, respectively, per gene array. Pos. Div. and Neg. Div. are the positive and negative divergences.
TABLE 4
Effect of changes of X, and X, under various conditions
2 N r 2NX1 2NXz Copy No. NDBA NGDM Pos. Div. Neg. Div.
0.05 0.0 0.0 2.57 f 2.22 1.55 f 1.06 0.97 f 1.42 0.12 0.08 0.05 0.10 0.20 5.12 f 4.28 1.34 f 0.98 2.79 f 3.31 0.03 0.07 0.05 0.20 0.40 5.13 f 4.90 1.41 f 1.12 2.47 f 3.76 0.03 0.05 0.05 0.30 0.60 4.66 f 4.63 1.24 f 0.78 2.47 f 3.76 0.02 0.05 0.05 0.40 0.80 5.59 f 5.32 1.38 f 0.93 3.09 f 4.25 0.03 0.06 0.10 0.0 0.0 4.85 f 4.65 2.14 f 2.03 2.47 f 2.72 0.1-5 0.12 0.10 0.10 0.20 6.85 f 6.53 1.95 f 1.64 3.99 f 4.37 0.09 0.10 0.10 0.20 0.40 7.04 f 6.48 2.09 f 1.70 4.28 f 4.82 0.09 0.10 0.10 0.30 0.60 6.99 f 7.91 2.12 f 2.06 4.01 f 5.33 0.08 0.09 0.10 0.40 0.80 7.42 f 9.47 2.63 f 2.94 3.66 f 5.43 0.10 0.07
Note: See text for parameter values. NDBA and NGDM are the number of different beneficial alleles and the number of genes with deleterious mutations, respectively, per gene array. Pos. Div. and Neg. Div. are the positive and negative divergences.
TABLE 5
Effect of increasing the conversion rate under a favorable condition
2Nh1 2NX1
0.00
0.10 0.20 0.30 0.40 0.50 0.60 0.70 0.80 0.90 1
.oo
0.00
0.20 0.40 0.60 0.80 1
.oo
1.20 1.40 1.60 1.80 2.00Copy No.
10.90 f 12.11 10.62f 11.11 10.90 f 10.72 16.15 f 15.75 14.09 f 12.48 13.19 f 13.84 12.60 f 12.72 13.28 f 12.37 13.99 f 12.94 15.34 f 15.61 13.91 f 14.55
NDBA
3.80 f 3.98 3.74 f 3.48 4.08 f 3.79 6.18 f 5.17 5.51 f 4.93 5.32 f 5.29 4.90 f 4.80 5.31 f 4.76 5.81 f 4.91 6.16 f 6.05 5.81 f 5.61
NGDM Pos. Div. Neg. Div.
6.24 f 7.42 6.10 f 7.17 5.86 f 6.44 8.61 f 9.40 7.46 f 6.76 6.64 f 7.48 6.62 f 7.07 6.68 f 6.88 6.95 f 7.63 7.67 f 8.58 6.87 f 7.92
0.07 0.07 0.07 0.07 0.07 0.06 0.07 0.06 0.07 0.06 0.06
0.03 0.03 0.03 0.03 0.03 0.02 0.03 0.02 0.02 0.02 0.02
Note: See text for parameters. NDBA and NGDM are the number of different beneficial alleles and the number of genes with deleterious mutations, respectively, per gene array. Pos. Div. and Neg. Div. are the positive and negative divergences.
the other hand, in our study, the conversion rate is mutations when the mutation rate is sufficiently high, similar to the mutation rate, and compensatory mu- but for gene conversion to be effective, there must be tations are not so rapidly separated during the time enough mutation. Thus gene conversion and redun- needed for fixation. Also, the effect of gene redun- dancy via unequal crossing over interact in a compli- dancy is pronounced when 4 N p
<<
1, whereas the cated way.252 C . J. Basten and T. Ohta
or on two genes of an array depending on whether
we consider within or between gene compensation) with a value that is a multiple of 5, then all sites in the gene become positive. Since one-half of all multiples of 5 are also multiples of 10, three-fourths of compen- sated genes will be beneficial. We might change this value to anything else, for example, 8. If we use 8 ,
then one-fifth of the multiples of 8 are also multiples of ten, and (9/25) of all compensated genes are also beneficial. If we use an odd number (not 5 ) , then (1/ 10) of the multiples of that number will also be mul- tiples of 10, thus (1 9/100) or approximately one-fifth
of the newly compensated genes will also be beneficial.
We thank H. TACHIDA and J. B. WALSH for their many useful comments on the manuscript. This investigation was supported in part by a postdoctoral grant from the Japan Society for the Pro- motion of Science to C.J.B. and a Grant-in-Aid from the Ministry
of Education, Science and Culture of Japan to T.O. This is contri- bution no. 191 2 from the National Institute of Genetics, Mishima, 41 1 Japan.
LITERATURE CITED
BECKER, R. S., and K. L. KNIGHT, 1990 Somatic diversification of immunoglobulin heavy chain VDJ genes: evidence for somatic gene conversion in rabbits. Cell 63: 987-997.
EVANS, B. A., C. C. DRINKWATER and R. 1. RICHARDS, 1987 Mouse glandular kallikrein genes. Structure and partial sequence analysis of the kallikrein gene locus. J. Biol. Chem.
FITCH, D. H. A., W. J. BAILEY, D. A. TAGLE, M. GOODMAN, L. SIEU and J. L. SLIGHTOM, 1991 Duplication of the a-globin gene mediated by repetitive L1 Line sequences in an early ancestor of simian primates. Proc. Natl. Acad. Sci. USA 88: 7396-7400. GELBART, W. M., and A. CHOVNICK, 1979 Spontaneous unequal
exchange in the rosy region of Drosophila melanogaster. Ge- netics 92: 849-859.
GELIEBTER, J., and S. G. NATHENSON, 1987 Recombination and the concerted evolution of the murine MHC. Trends Genet. 3: 107-112.
HIBNER, B. L., W. D. B U R K E ~ ~ ~ T. H. EICKBUSH, 1991 Sequence identity in an early chorion multigene family is the result of localized gene conversion. Genetics 128: 595-606.
IRWIN, D. M., and A. C. WILSON, 1990 Concerted evolution of ruminant stomach lysozymes. J. Biol. Chem. 265: 4944-4952. IRWIN, D. M., E. M. PRAGER and A. C. WILSON,
1992 Evolutionary genetics of ruminant lysozymes. Anim. Genet. 23: 157-166.
262: 8027--8034.
J O L L ~ , J., P. J O L L ~ , B. H. BOWMAN, E. M. PRAGER, C-B. STEWART and A. C. WILSON, 1989 Episodic evolution in the stomach lysozymes of ruminants. J. Mol. Evol. 2 8 528-535.
KIMURA, M., 1983 The Neutral Theory of Molecular Evolution. Cambridge University Press, New York.
KIMURA, M., 1985 The role of compensatory neutral mutations in molecular evolution. J. Genet. 64: 7-19.
MAEDA, N., and 0. SMITHIES, 1986 The evolution of multigene families: human haptoglobin genes. Annu. Rev. Genet. 2 0 81- 108.
MAIZELS, N., 1989 Might gene conversion be the mechanism of somatic hypermutation of mammalian immunoglobulin genes? Trends Genet. 5: 4-8.
MARONI, G., J. WISE, J. E. YOUNG and E. OTTO, 1987 Metallothionein gene duplications and metal tolerance in natural populations of Drosophila melanogaster. Genetics 117: 739-744.
OHNO, S., 1970 Evolution by Gene Duplication. Springer-Verlag, New York.
OHTA, T., 1980 Evolution and Variation of Multigene Families. (Lecture Notes in Biomathematics, Vol. 37). Springer-Verlag, New York.
OHTA, T., 1987 Simulating evolution by gene duplication. Ge- netics 1 1 5 207-213.
OHTA, T., 1988a Evolution by gene duplication and compensa- tory advantageous mutations. Genetics 1 2 0 841-847. OHTA, T., 1988b Further simulation studies on evolution by gene
duplication. Evolution 4 2 375-386.
OHTA, T., 1988c Time for acquiring a new gene by duplication. Proc. Natl. Acad. Sci. USA 85: 3509-3512.
OHTA, T., 1989 Time for spreading of compensatory mutations under gene duplication. Genetics 123: 579-584.
REYNAUD, C-A., V. ANQUEZ, H . GRIMAL and J-C. WEILL, 1987 A hyperconversion mechanism generates the chicken light chain preimmune repertoire. Cell 48: 379-388.
SHAPIRA, S. K., and V. G. FINNERTY, 1986 The use of genetic complementation in the study of eukaryotic macromolecular evolution: rate of spontaneous gene duplication at two loci of Drosophila melanogaster. J. Mol. Evol. 23: 159-167.
SMITHIES, O., and P. POWERS, 1986 Gene conversions and their relation to homologous chromosome pairing. Phil. Trans. R. SOC. Lond. B 312: 291-302.
STEWART, C. B., J. W. SCHILLING and A. C. WILSON, 1987 Adaptive evolution in the stomach lysozymes of foregut fermenters. Nature 330: 401-404.
VOELKER-MEIMAN, K., and G. S. ROEDER, 1991 Gene conversion tracts stimulated by hotl-promoted transcription are long and continuous. Genetics 1 2 6 851-867.
WINES, D. R., J. M. BRADY, E. M. SOUTHARD and R. J. MACDONALD, 1991 Evolution of the rat kallikrein gene family. Gene con- version leads to functional diversity. J. Mol. Evol. 32: 476-492.