Equilibrium Values of Measures of Population Subdivision
for Stepwise Mutation Processes
Frangois Rousset
Laboratoire Ginitique et Environnement, Institut des Sciences de lgvolution, Universiti de Montpellier II, 34095 Montpellier, France
Manuscript received September 26, 1995 Accepted for publication November 29, 1995
ABSTRACT
Expected values of WRIGHT’S Fstatistics are functions of probabilities of identity in state. These values may be quite different under an infinite allele model and under stepwise mutation processes such as those occurring at microsatellite loci. However, a relationship between the probability of identity in state in stepwise mutation models and the distribution of coalescence times can be deduced from the relation- ship between probabilities of identity by descent and the distribution of coalescence times. The values of
F,,
and FsT can be computed using this property. Examination of the conditional probability of identity in state given some coalescence time and of the distribution of coalescence times are also useful for explaining the properties of F,, and FST at high mutation rate loci, as shown here in an island model of population structure.T
he estimation of WRIGHT’S Fstatistics is standard practice (e.g., WEIR 1990) and has multiple uses(e.g., HARTL and CLARK 1989; SLATKIN 1993). Most dis- cussions of their properties have been based on the values of probabilities of identity by descent in the infi- nite allele model. In a recent paper SLATKIN (1995) has emphasized that such theory may not be appro- priate for the analysis of loci evolving under a stepwise mutation process with a high mutation rate, taking the example of the estimation of the number of migrants in an island model.
In its simplest form the stepwise mutation model as- sumes that mutation acts by increasing or decreasing the electrophoretic mobility of an allele by one unit. This model was initially considered in charge state mod- els of protein polymorphism ( OHTA and KIMURA 1973; WEHRHAHN 1975) and has been reconsidered as a model of evolution of microsatellite allele sizes ( SHRIVER et al. 1993; VALDES et al. 1993)
.
Microsatellite loci have high mutation rates and there is some evi- dence from pedigree data for a stepwise pattern of mu-tation ( WEBER and WONG 1993). However the exact
nature of the mutation process is still not clear ( ESTOUP
et al. 1995a,b), and variants of the stepwise model in- cluding changes by more than one unit must be consid- ered ( DI RIENZO et al. 1994).
In such models alleles can be identical in state with- out being identical by descent. It is then appropriate to define F-statistics as intraclass correlations for the probability of identity in state ( “11s correlations”) , ie.,
Address for correspondence: Laboratoire Genitique et Environnement, Institut des Sciences de I’Evolution, CC065, USTL, Place E. Bataillon,
34095 Montpellier Cedex 05, France. E-mail: [email protected]
Genetics 1 4 2 1357-1362 (April, 1996)
where the
QI
are probabilities of identity in state,Q1 for pairs of genes within individuals,
Q2
betweenindividuals within subpopulations, and Q3 between
subpopulations ( COCKERHAM and WEIR 1987)
.
Throughout this paper the standard notation
=
is used to distinguish the definition of parameters from their values under particular models, and thejindices( j = 1 to 3 ) will always refer to the same pairs of genes.
Infinite allele models provide the value of the probabilities of identity by descent 6, for the differ- ent pairs of genes, and correlations for the probabil- ity of identity by descent (IBD correlations) are de- fined in the same way:
PIS
=
( 0 , - 0,)/
( 1 - 0,)and
PST
=
(e2
- 6 3 )/
( 1 - 0 , ).
In this paper, proba-bilities of identity in state are given for stepwise mu- tation models ( SMMs)
.
The values of FST and Fls in this case are compared to their values in the infinite allele model (IAM) and in a simple k-allele model (KAM),
and some explanations are provided for the properties of F-statistics under the different muta- tion models.EQUILIBRIUM VALUES IN AN ISLAND MODEL
As an example, I consider an island model with ga- metic migration. n subpopulations of Ndiploid individ- uals exchange migrant gametes at rate m. The following quantities are useful (NAG- 1983) : after migration, the frequency of pairs of genes within a subpopulation that originate from one subpopulation in the previous generation is a = (1 - m )
+
m2/ ( n - 1 ) , and the1358 F. Rousset
tions that also originate from one subpopulation in the previous generation is b = ( 1 - a )
/
( TZ - 1 ).
Themutation rate is u for all alleles. Let y
=
( 1 - u)'.
Some offspring are produced by selfing in each subpop- ulation: if s is the conditional probability of selfing given both genes are copies of genes from one subpopulation in the previous generation, the overall amount of selfing is as. In a random mating hermaphroditic s u b population, s = 1
/
N. The notation (T=
s - 1/
N willbe used.
Identity by descent (infinite allele model): Re- cursions for the IBD probabilities follow from the defi- nitions:
e,,+,
= YThis is a special case of the model considered by MARU- YAMA and TACHIDA ( 1992)
.
The equilibrium value of the IBD correlations are4 s = P I S =
2
- a a yFST =
PST
= Ydy d
+
N(2 - n a y ) ( 1 - yd)9 ( 3 )
w h e r e d = a - b = ( 1
-
m [ n / ( n - l ) ] ) ' .Symmetric k allele model: If there is a finite number k of possible alleles and each allele can mutate to an- other one at rate u/ ( k
-
1 ) , copies at generation t+
1 of pairs of genes that were identical in state at genera- tion tare identical at generation t
+
l with probabilityv = (1 - u)'
+
u ' / ( k - l ) , and pairs of genes thatwere different can become identical at rate ( 1 - v)
/
( k - 1 ) (CROW and AOKI 1984). Hence
QJ+1 = a( s y
+
( 1 - s)&)
+
( 1 - a ) !&,N 2
x
(L-+
N 2 (1-;)a,.)
+
( 1 - b)@&, ( 4 )in which QJ,/ is the conditional IIS probability of a pair of genes given the type j of pair of genes sampled
Q j , t = @ I , / + ( 1 - Q j , t ) ( l - v ) / ( k - 1 )
= 7 ' Q j . t
+
( 1 - y ' ) / k , ( 5 )where y'
=
u - ( 1 - v ) / ( k-
1 ) = ( 1 - u k / ( k - 1 ) )'.
At equilibrium the IIS correlations have the same expression as the IBD correlations ( 3 ) , with y' instead of y.aay'
2 - aay' '
Y ' d
4 s
=FST =
y'd
+
N ( 2 - gay') ( 1 - y'd).
( 6 )This model is therefore equivalent to an infinite allele model with a higher mutation rate, u' = ku/ ( k - 1 ) .
Stepwise mutation model: It is useful to consider the generating function of the probabilities p k that a ran-
domly chosen gene differs by k steps from another ran- domly chosen gene. In a subdivided population, these probabilities p k , j differ for the different pairs of genes,
so we consider the generating functions I,!Ij( z )
=
E?:
p k , , z k . Pairs of genes can be sampled symmetri-cally in two ways, therefore P - k , , = p k , j and I,!Ij( e'*) =
+
2 ETrn p k , J cos ( k x ) ( MORAN 1975) from whichindividual probabilities p k , j can be extracted by inte-
gration of I,!IcI,( e") cos ( k x )
.
Thus, IIS probabilities areQ =
p
= - I,!Ij( ezx) dx.Os' 7r
r
0( 7 )
Mutation occurs at rate u as above. According to the one-step mutation model, it increases the size differ- ence of a pair of genes with regard to the size difference of their ancestors in the previous generation by
+
1 with probability= u,
by -1 with probability=
u , and willnot change it with probability 1 - 2u. Hence the effect of mutation is to change the generating function
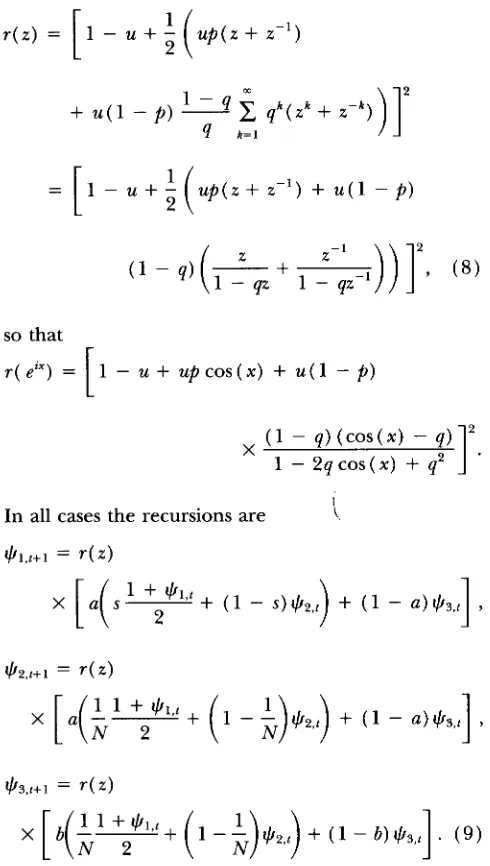
+ ( z ) by a factor r ( z )
=
1 - 2u+
uz+
u / z (MOW 1975; WEHRHAHN 1975). The exact expression is r (z)
= [ l - ( 2 - z - l/z)u/2]',thesquareoftheeffect
of mutation on each allele.
The results given below are valid whenever changes in allele size due to mutation are independent of the nature of the allele. A two-phase mutation model was proposed by DI RIENZO et al. (1994) to take into ac- count the fact that some mutations may increase or decrease microsatellite size by more than one repeat. In this model with probability
p ,
mutation increases or decreases allele size difference by one repeat, and with probability 1 -p
it increases or decreases allele size difference by k repeats, where k follows some probability distribution. DI RIENZO et al. (1994) considered a trun- cated geometric distribution where Pr ( k ) = ( 1 -+
u ( l -p )
-
4 k = l
=
[
1 - u+
;
(up(z+
% - I )+
u ( l -p )
so that
1 - u
+
upcos(x)+
u ( 1 -p )
In all cases the recursions are
i
$ l , t + l = 0 )
These recursions are mathematically identical to those for IBD. At equilibrium the generating functions are
$1 ( z )
- T ( z ) ( u - d r ( z ) )
+
aNu(1 - r ( z ) ) ( l - d r ( z ) )-
V ( z )
,
where V ( z ) = r ( z ) ( a - d r ( z ) )
+
N ( l - r ( z ) ) ( l -There is no simple relationship between N, m, u, u and the Q s , so that the Fs need to be evaluated by
numerical methods. However, SLATKIN ( 1995) has
shown that the variances of the distributions of size difference, S,, are proportional to the average coales cence times of the respective pairs of genes, which themselves have simple relationships to the different d r ( z ) )
( 2
- U O T ( Z ) ) .parameters describing population structure. This is confirmed by computation of these variances,
S,
E [ k;] = ( d2$j( z )
/
dz2)I
r=l (since E [ k ] = 0 ) . ThusSi = 2uT1 = 4Nu(l - d ) (1 - a a )
b = 4Nun(l - a a ) ,
S,
= 2uT2 = Sl+
~ N u u ( 1 - d ) CTb = Sl
+
2Nuna0,& = 2 u T 3 = S , + - . 2 ud
b
Quantities analogous to Fstatistics are
S,
- Sl PIS=
~s,
and pST=
~& -
s,
& .
( 1 2 ) In the stepwise mutation model the values of the ps are the values of the ratios of average coalescence times,Cis= ( T 2 - T , ) / T 2 a n d G T = ( T 3 - T * ) / T s . T h e y have the same expression as the values of the P s ( 3 ) ,
with 1 instead of y. Hence 2pIS/ ( 1
+
pIs) = m and pST [ l+
4aNm(l - cr/2)]-' for msmall, where (Y=
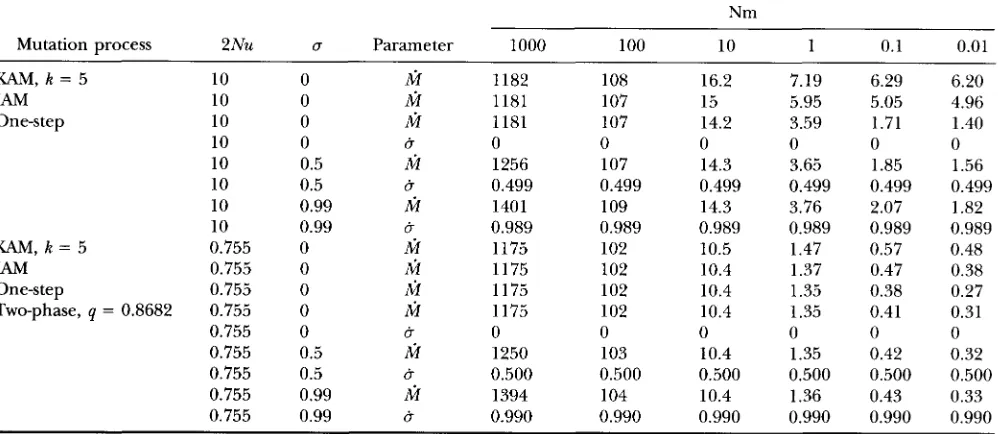
n / ( n - 1 ) .Table 1 shows values of the functions tr and M de- fined as
evaluated for the different mutation processes and dif- ferent values of m and u. These definitions are chosen only for ease of comparison to common reference val- ues that are tr (
GS)
= cr andhi(
GT
) = Nm. For the infinite allele model f i ( F s T ) is computed using the value of FST according to ( 3 ),
for IIS in the k-allelemodel according to ( 6 ) , and for IIS in the stepwise mutation model according to
( 7 )
and ( 1 0 ) .hiis larger than Nm, the relative difference between them increasing with decreasing values of Nm, and de- creasing with decreasing mutation rate. These results are in agreement with SLATKIN'S ( 1995) simulation re- sults for the SMM. However,
hi
is larger and differs more from Nm in theIAM
and is still larger in theKAM.
The discrepancies between cr and tr are very small.RELATIONSHIP TO COALESCENCE TIMES
The island model with gametic migration illustrates some relationships between IBD, IIS in the k-allele model, and generating functions in stepwise mutation models. These results are a simple consequence of the fact that, given some coalescence time t, the conditional IBD probability is y I , the IIS probability in the KAM is
1360 F. Rousset
TABLE 1
Examples of values of
ni
and &Nm
Mutation process 2Nu L7 Parameter 1000 10 100 1 0.01 0.1
K A M , k = 5 IAM
One-step
K A M , k = 5
I"
One-step
Two-phase, q = 0.8682
10 0
10 0
10 0
10 0
10 0.5
10 0.5
10 0.99
10 0.99
0.755 0
0.755 0
0.755 0
0.755 0
0.755 0
0.755 0.5
0.755 0.5
0.755 0.99
0.755 0.99
M M M
M
M M M M M M M u b u u uu
1182 1181 1181 0 1256 0.499 1401 0.989 1175 1175 1175 1175 0 1250 0.500 1394 0.990 108 107 107 0 107 0.499 109 0.989 102 102 102 102 0 103 0.500 104 0.990 16.2 15 14.2 0 14.3 0.499 14.3 0.989 10.5 10.4 10.4 10.4 0 10.4 0.500 10.4 0.990 7.19 5.95 3.59 0 3.65 0.499 3.76 0.989 1.47 1.37 1.35 1.35 0 1.35 0.500 1.36 0.990 6.29 5.05 1.71 0 1.85 0.499 2.07 0.989 0.57 0.47 0.38 0.41 0 0.42 0.500 0.43 0.990 6.20 4.96 1.40 0 1.56 0.499 1.82 0.989 0.48 0.38 0.27 0.31 0 0.32 0.500 0.33 0.990is 50 (SLATKIN 1695).
and f ( x)
=
C c,x' is the generating function of coales- cence times, then the IBD probability is C cry1 = f ( y ) ( SLATKIN 1991 ),
the IIS probability in the KAM is C c,[ 1+
( k - l ) y f ' ] / k = [l+
( k - l ) f ( y ' ) ] / k , and the generating function of allele size difference isx
c, ( T ( z) ) =f(
r ( z ) ).
Then, if the IBD correlation is expressed as some functiong (
y ),
the IIS correlation in the KAM is g( 7' ),
and the ratio of coalescence times i s g ( 1 ) .TACHIDA (1985) has shown that the study of genea- logical process and of the mutation process can be "sep- arated" when the mutation process is a Markov chain. The reason is that any conditional IIS probability given the coalescence time t can be written as C eiX: where the
hi
are the eigenvalues of the transition matrix of the Markov chain, so that the unconditional 11s probabilityis C e i f (
hi).
The symmetric k-allele model is a simpleillustration of this fact. It is also possible to analyze
stepwise mutation processes by such an approach
(hlAR-
UYAMA 1977).
Existing theory for IBD in various population struc- tures (e.g., MARUYAMA 1970; NAGYLAKI 1983; MARUYAMA and TACHIDA 1992) actually provides the generating functions of coalescence times ( SLATKIN 1991 ) and can immediately be used for obtaining the equilibrium value of FsT in stepwise mutation models and to com- pare them to ratios of average coalescence times that reflect the consequences of various factors of interest such as inbreeding, population size and migration pat- terns but not mutation. As another example consider a one-dimensional circular stepping-stone of d subpop- ulations. Each subpopulation receives m / 2 immigrants
They were computed as described in text, using Muthemuticu (WOLFRAM 1991). n = 100 and 2 N = 20,000 in all cases. In the two-phase model, with probability 1 -
p
= 0.25 the increment in allele size is assumed to follow a geometric distribution. The values of u and a are chosen so that the variance of increment in allele size per generation due to the second phase mutations~~
from each of their two neighbors. The generating func- tions for pair of genes sampled in subpopulations dis- tant by 1 steps are the solution of
XP
= r ( z) M ( Q+
( 1- +,,)
x/
2N) where M is a matrix describing the effectsof migration and x = (1, 0, 0,
. . .
,
0 ) ' (MARUYAMA 1970). The solution is[ ( d + 1 ) / 2 1
+ l ( z ) = ai cos(P.iriZ/d), (14)
,=O
where ai = [ L ( l -
+ ) ) a ~ l / [ ( l
- ~ ( z ) L ) A i l ,r ( z ) X k ) A k ] ) ) , X, = ( 1 - m ( 1
-
c o s ( 2 ~ i / d ) ) ) ~ , andA,
= 1 if i = 0 or i = k/2, and'/*
otherwise. If the variances of the distributions of differences between genes 1 locations apart are proportional to coalescence times, the following approximation holds for pST (I)
=
( V, - VO)
/
V,, assuming a small migration rate ( SLATKIN 1993):= T ( z ) / ( ( 1 - r ( z ) ) ( 2 N d
+
C k r ( Z ) A k / [ ( l -but this approximation is not valid in general for FsT ( I )
creases much less than M ( p s T ) in the more distant subpopulations (Figure 1 )
.
A similar lack of variation is observed for coalescence measures in some nonequi- librium models ( SLATKIN 1993).=
( Q -8)
/
( 1 -Q J .
M(Fsr)=
' / q ( l / & - 1) de-DISCUSSION
Effects of the mutation process on F-statistics: For
7 lot: *
.
1 2 5 10 20
FIGURE 1.- M ( Fsr ) vs. M ( pST ) in a circular stepping stone. Note the logarithmic scale. lis the number of steps two
demes are apart. The steppin stone has 80 subpopulations, subpopulation size is N = 10 and mutation follow the one- step mutation model with u =
6:
high probability, coalescence times of genes between subpopulations are sufficiently long for two or more mutations events to occur. This is well illustrated by the stepping stone model in which the more distant the subpopulations, the longer the coalescence times and the more FsT differs from the ratio of coalescence times
cj,. psT will also differ from C& when coalescence times get longer and the mutation process is not independent of the nature of the allele ( BOWCOCK et aZ., 1994; DEKA
et aZ., 1994; GARZA et aZ., 1995; GOLDSTEIN et aZ., 1995).
However, long coalescence times are not sufficient for the mutation process to matter. The fact that FIs is virtually insensitive to this process is not due to the fact that most coalescence events for pairs of genes within subpopulations occur before the occurrence of two or
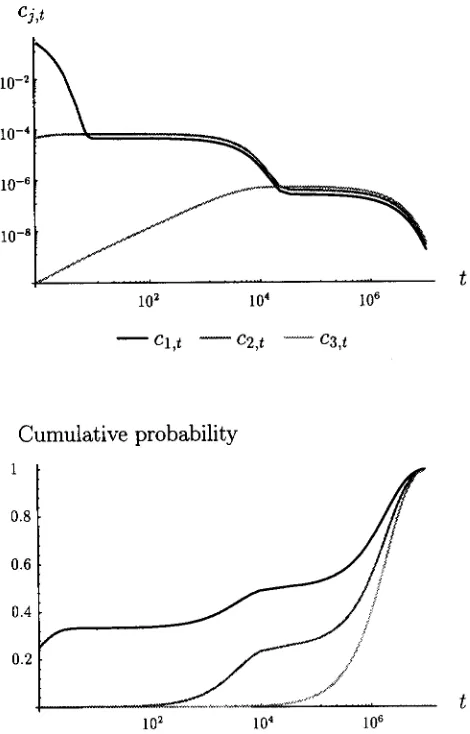
more mutations, because they do not. For example in the case Nm = 1, u = 0.5, 2N = 20000 and n = 100,
the probability of coalescence within
l o 4
generations is only 0.49 for pairs within individuals and 0.23 for pairs between individuals within subpopulations (Figure 2 ).
Yet u is very close to ir in this case.
An examination of the distribution of coalescence times shows that a fraction = x / ( 1 - x) (where x
=
aa
/
2 ) of pairs of genes within individuals, and almost none between individuals, coalesce in the first genera- tions in which case they are almost always identical. Thereafter the respective probabilities of coalescence at time t , cl,f and c ~ , ~ are proportional: cl,t w c * , ~ ( 1 -2 x)
/
( 1 - x ) (Figure 2 ) . This is sufficient to ensure that Q=
[ x + ( 1 - 2 x ) Q ] / ( 1 - x) and that&-
x/ ( 1 - x) is virtually independent of the mutation process. By the same argument, S,
=
( 1 - 2 x )&/
( 1- x) so that PIS
=
x/ ( 1 - x) even if the mutationprocess is not stepwise. In contrast, it takes -30,000
generations for c ~ , ~ to become proportional to c ~ , ~ . The mutational processes occurring within this time affect the values of FST and pST. This time interval is longer
when the migration rate decreases, so that FST is always performing worse when m decreases.
There are two aspects of the mutation process that
10-8
t
102 104 106
-
c1,t-
C2,t " C3,tCumulative probability
1
0.8
0.6
0.4
0.2
1
~ ,,./, -.
t
1
o2
104 1 O6FIGURE 2.-Distributions of coalescence times. Note the log or log-log scale. The probabilities c ~of , ~coalescence time
t and their cumulative distributions are given for the different pairs of genes in the case Nm = 1, u = 0.5, TZ = 100 and 2N
= 20000.
may cause deviation from the ratios of coalescence times ( SLATKIN 1995) : high mutation rates and the na- ture of the mutations. When the probability of identity decreases linearly with time the
Fs
are identical to the ratios of coalescence times, but when multiple muta- tions occur the probabilities of identity are no longer linearly decreasing with time. Figure 3 shows that the deviation from linearity is more pronounced in theIAM
than in the SMM, and even more in the K A M , as as- sessed by the convexity of the curves. As a consequence FsT deviates more from C& in the
IAM
than under a stepwise process, and FST is a poorer measure of popula- tion subdivision if mutation is not stepwise. For a given value of the mutation rate, FST is closer toGT
in theone-step than in the two-phase SMM (Table 1 )
.
HenceFST is closer to c j T in the two-phase model with 2Nu =
0.755 than in the one-step model with 2Nu = 10 only because the mutation rate is lower, not because the mutation process is less stepwise.
1362 F. Rousset
Probability
8 0 0 0 10000
t
FIGURE 3.-Comparison of probabilities of identity. For the present comparison [ 1
+
( k - 1 ) y’‘1
/ k is equivalent to y’*.
u = ’ / 2 0 0 0 , k = 5 , a n d r ( e ‘ x ) = [ 1 - u ( l - c o s ( x ) ) ] 2 ( o n e - step mutation model).
than in the I A M , while it is larger in the
KAM.
This shows that there is no simple effect of homoplasy on FST.Estimation and relationship to SLATKIN’S
GT:
If un- biased estimates $2 and$
are obtained then a simple estimator of psT is fisT ($
- $)/
$.
Likewise prs canbe estimated by
PIS
=
($
- )/
$
(R.
STREIFF, unpub- lished DEA thesis, Montpellier) . SLATKIN ( 1995) con- sidered the weighted sumwhere n, is the sample number and s, the sample size. Thus
where c
=
( 2ss - 1 )/
(2 . 5 , ~ ~ ~
- 1 ) . The relation between &T andPST
is similar to that between ‘‘GrA’’ and‘‘0”
in COCKERHAM and WEIR ( 1993).
MICHAMS and EXCOETIER ( 1996) have defined an analysis of variance ( ANOVA) estimator of psT by anal- ogy to the definition of the estimator
8
of Fsr (WEIRand COCKERHAM 1984). There are several possible AN- OVA estimators of pST that are all based on unbiased estimates of the
S,
but differ by the weights given to samples of different sizes. They should provide different estimates only when sample sizes are variable as for theANOVA estimators of FsT ( COCKERHAM 1973). Their small sample properties remain to be investigated.
I thank P. JARNE, M. RAYMOND, M. SLATKIN and F. V mfor discus- sion, and T. GUILLEMAUD for his patience. This work was supported by the Programme Environnement d u Centre National d e la Recherche Scientifique (GDR 11.05). This is paper 96004 of the Institut des Sciences de I’Evolution.
LITERATURE CITED
BOWCOCK, A. M., A. RUIZ-LINARFS, J. TOMFOHRDE, E. MINCH, and J. R.
KIDD et ab, 1994 High resolution of human evolutionary trees
with polymorphic microsatellites. Nature 368: 455-457.
COCKERHAM, C. C., 1973 Analyses of gene frequencies. Genetics 74:
COCKERHAM, C. C . , and B. S. WEIR, 1987 Correlations, descent mea- sures: drift with migration and mutation. Proc. Natl. Acad. Sci.
COCKERHAM, C. C., and B. S. WEIR, 1993 Estimation of gene flow from Fstatistics. Evolution 47: 855-863.
CROW, J. F., and IC AOKI, 1984 Group selection for a polygenic behavioural trait: estimating the degree of population subdivi- sion. Proc. Natl. Acad. Sci. USA 81: 6073-6077.
DEKA, R., M. D. SHRNER, L. M. Yu, L. JIN, C. E. ASTON et al., 1994 Conservation of human chromosome 13 polymorphic microsat- ellite
(a),
repeats in chimpanzees. Genomics 22: 226-230. DI RIENZO, A,, A. C. PETERSON, J. C. GARZA, A. M. VALDES, M. SIATKINet al., 1994 Mutational processes of simple-sequence repeat loci in human populations. Proc. Natl. Acad. Sci. USA 91: 3166- 3170.
ESTOUP, A,, L. GARNERY, M. SOLICNAC and J.-M. CORNUET, 1995a Microsatellite variation in honey bee (Apis mll@ra L.) popula- tions: hierarchical genetic structure and test of the infinite allele and stepwise mutation models. Genetics 140: 679-695. ESTOUP, A,, C. TAILLIEZ, J.-M. CORNUET and M. SOLIGNAC, 1995b
Size homoplasy and mutational processes of interrupted micro- satellites in two bee species, Apis mellifea and Bombus terrestris (Apidae) . Mol. Biol. Evol. 14: 1074-1084.
GARZA, J. C., M. SIATKIN and N. B. FREIMER, 1995 Microsatellite allele frequencies in humans and chimpanzees, with implications for constraints on allele size. Mol. Biol. Evol. 1 2 594-603. GOLDSTEIN, D. B., A. R. LINARES, L. L. CAVALIJ-SFORZA and M. W.
FELDMAN, 1995 An evaluation of genetic distances for use with microsatellite loci. Genetics 1 3 9 463-471.
HARTI., D. L., and A. G. CLARK, 1989 Principles of Population Genetics. Sinauer, Sunderland, MA.
” A , IC, and H. TACHIDA, 1992 Genetic variability and geo- graphical structure in partially selfing populations. Jpn. J. Genet.
MARUYAMA, T., 1970 Effective number of alleles in a subdivided population. Theor. Pop. Biol. 1: 273-306.
MARUYAMA, T., 1977 Stochastic Problems in Population Genetics. Springer Verlag, Berlin.
MICHALAKIS, Y., and L. EXCOFFIER, 1996 A generic estimation of population subdivision using distances between alleles with spe- cial reference for microsatellite loci. Genetics 142: 1061-1064. MOW, P. A. P., 1975 Wandering distributions and the electropho-
retic profile. Theor. Pop. Biol. 8: 318-330.
N A G M S I , T., 1983 The robustness of neutral models of geographi- cal variation. Theor. Pop. Biol. 24: 268-294.
OHTA, T., and M. KIMURA, 1973 A model of mutation appropriate to estimate the number of electrophoretically detectable alleles in a finite population. Genet. Res. 22: 201-204.
SHRIVER, M. D., L. JIN, R. C H A K R A B O R ~ and E. BOERWINKLE, 1993 VNTR allele frequency distributions under the stepwise mutation model: a computer simulation approach. Genetics 134: 983-993. SLZTKIN, M., 1991 Inbreeding coefficients and coalescence times.
Genet. Res. 58: 167-175.
SLATKIN, M., 1993 Isolation by distance in equilibrium and non- equilibrium populations. Evolution 47: 264-279.
SLATKIN, M., 1995 A measure of population subdivision based on microsatellite allele frequencies. Genetics 139: 457-462. TACHIDA, H., 1985 Joint frequencies of alleles determined by sepa-
rate formulations for the mating and mutation systems. Genetics
11 1: 963-974.
VALDES, A. M., M. SLATKIN and N. B. FREIMER, 1993 Allele frequen- cies at microsatellite loci: the stepwise mutation model revisited. Genetics 1 3 3 737-749.
WEBER, J. L., and C. WONG, 1993 Mutation of human short tandem repeats. Hum. Mol. Genet. 2 1123-1128.
WEHRHAHN, C. F., 1975 The evolution of selectively similar electro- phoretically detectable alleles in finite natural populations. Ge- netics 80: 375-394.
679-700.
USA 8 4 8512-8514.
67: 39-51.
WEIR, B. S., 1990 Genetic Data Analysis. Sinauer, Sunderland, MA. WEIR, B. S., and C. C. COCKERHAM, 1984 Estimating Fstatistics for
the analysis of population structure. Evolution 3 8 1358-1370. WOLFRAM, S., 1991 Mathematicu, Ed. 2. Addison Wesley, Redwood
City, C A .
![FIGURE 3.-Comparison present comparison u = ’ / 2 0 0 0 , k = 5 , a n d r ( e ‘ x ) = [ 1 - u ( l - c o s ( x ) ) ] 2 ( o n e - of probabilities of identity](https://thumb-us.123doks.com/thumbv2/123dok_us/1694023.1214385/6.591.55.274.65.235/figure-comparison-present-comparison-k-o-probabilities-identity.webp)