Joint Self-adaptive Correlation Method and Modified Empirical
Mode Decomposition for Soft Defect Detection
in Cable by Reflectometry
Soumaya Sallem* and Nicolas Ravot
Abstract—In a previous paper, we have introduced an innovative approach called the self-adaptive correlation method (SACM). It consists in treating the reflectogram in order to amplify the signatures of soft defects and make them more easily detectable. This method allows to highlight the soft defect while attenuating the noise present on the reflectogram and has the advantage of reducing the computational complexity compared to the state of the art. We drew attention to the sensitivity of the performance of this method to noise. In this paper, we propose a solution for the pre-denoising of reflectogram before applying the SACM. This solution consists of an adapted version of the empirical mode decomposition algorithm, we called MEMD for Modified Empirical Mode Decomposition which bypasses some limitations of the conventional EMD.
1. INTRODUCTION
Reflectometry based methods [1–3] are among the most common for cable diagnosis. At present, these methods exhibit good performance for the detection of hard defects, corresponding to important variations of cable characteristic impedance, and therefore to high reflection coefficients.
Hard defects can have serious economical and material consequences. So it is necessary to be able to detect them early, before they arise (called soft defects).
Soft defects do not prevent the signal propagation, are less detectable and are therefore difficult to be localized. These kind of degradations may not have significant impact on the system. However, if nothing is done, the environmental and mechanical stresses may change the soft defect to a hard defect. Detecting emerging defects allows to reduce repair costs and therefore a better management of maintenance. Hence, the development of new methods efficient for the detection of soft defects is a major issue of wire diagnosis. It also fulfills the urgent expectations of industrials.
As shown in [4], no current method, in itself, seems efficient enough for detecting systematically such damages. Various techniques have been proposed in the literature to overcome this problem. It has thus been shown that the application of a time-frequency cross correlation function using the Wigner-Ville transform (the method of “Joint Time-Frequency Domain Reflectometry” [5]), improves the results. This method has some limitations such as complexity and false alarms caused by cross terms generated by the quadratic form of the Wigner Ville transform.
Some works [6] focused on the last problem by improving time-frequency method in order to reduce or cancel the cross terms. This resulted in effective but complex and complicated algorithms in terms of calculation time.
In a noisy environment, soft defects detection evoke much difficulty. Indeed, these defects result in a very small local variation of characteristic impedance (few ohms). It is then needed to be able to
Received 5 December 2014, Accepted 5 January 2015, Scheduled 9 January 2015 * Corresponding author: Soumaya Sallem ([email protected]).
detect reflected signals with very low amplitude. This is so difficult as in real conditions these reflections can be masked by noise or other greater interference signals.
Processing noisy data is a classical problem in signal processing, particularly in the case of an additive white Gaussian noise and where a number of filtering methods have been proposed [7, 8]. Linear approaches such as the Wiener filter [7] are generally used for their implementation simplicity. However, these methods are not effective for non-stationary signals. To overcome these difficulties, nonlinear approaches have been proposed such as wavelets [8, 9]. However, the limitations of the wavelet approach is the need to predefine the basic functions necessary for the decomposition of the signal.
EMD has recently been introduced by Huang et al. [10] as a local and self-adaptive decomposition method into sub-bands, for the analysis of non-stationary signals. EMD is entirely data-driven, and unlike the Fourier transform or the wavelet decomposition is not based on predefined elementary functions. Here, the basic functions are derived from the signal itself.
However, the numerical implementation of the algorithm is somewhat difficult as determining the appropriate interpolation, sampling, problems of existence of local extrema, modes and its convergence. . ..
We work not only on signal processing techniques to detect and locate soft defects but also on an appropriate method for denoising the reflectogram in order to improve this detectability.
In the second section of the paper, we explain the reflectometry principle and the effect of the soft defect. In the third section, we discuss the originality of the proposed methods (SACM [11] and MEMD) combined together where their applications are showed in Section 4.
2. REFLECTOMETRY AND EMD
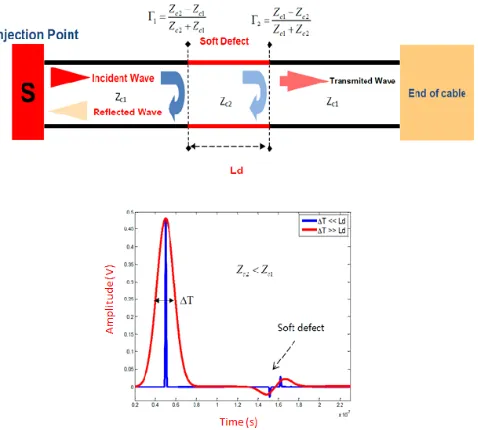
Reflectometry is a non-destructive method, based on the analysis of the reflected signal measured at the injection point (the radar principle). In fact, it consists in analyzing the wave reflected by the characteristic impedance of discontinuities.
A soft defect causes a small local variation of the characteristic impedance. Thus, when the wave injected into a cable with characteristic impedance ZC1 encounters an impedance discontinuity ZC2 during propagation, a portion of its energy will be returned to the point of injection, Figure 1.
Indeed, the impedance discontinuity ZC2 introduces two reflection coefficients defined by Γ1 in its input and Γ2 in its output.
Thus, the soft defect resulted in the presence of two reflected pulses with opposite signs. These two pulses overlap when the time width of the injected signal is greater than the size of the soft defect, decreasing the magnitude of the soft defect signature.
The basic idea of the EMD is to consider a signal (non-stationary) as locally made of the contribution of a low frequency component which is superimposed to oscillations (high-frequency components). In a first time, we have to identify the local oscillating part or to characterize the local trend of the signal.
The oscillatory components mentioned above is deduced from the difference between the signal and the local average. The size of the observation window of the local average is difficult to choose automatically. It can mean the distance between two consecutive extrema (for a regular signal in the mathematical meaning), or the distance between two points of maximum local curvature, or diameter of small local transitions of the signal.
EMD helps break a signal s down into a finite sum of oscillating modes. We can then write the signal s as follows:
s= K
k=1 dk+r
These oscillating modes (dk) also called IMF (Intrinsic Mode Function) are oscillating functions around 0, and zero local mean. The residuer is non-oscillating, it contains less than 3 extrema.
However, despite all its advantages, the implementation of the algorithm raises some difficulties related to the management of edge effects, quality of interpolation, sampling, extraction of intermittent problems. . .. But the biggest handicap of EMD is surely the lack of mathematical framework for studying its behavior, including its convergence, the existence of the modes. . ..
3. JOINT MEMD AND SACM METHOD
The characteristic signature of a soft defect is very low amplitude and probably difficult to detect especially in the presence of high amplitude noise.
The SACM has made an important gain on the amplitude of the soft defect signature. We tested its robustness by adding a white Gaussian noise to the reflectogram. We found that we realize a gain even with low SNR (Signal to Noise Ratio) when the defect signature is masked by the noise. However, SACM gain decreases with noise.
In order to denoise a reflectogram, we have used the method of MEMD.
The proposed method (MEMD) is adapted to the denoising of reflectogram. It is an iterative smoothing algorithm based on the EMD conventional principle. The smoothing algorithm used here is a sliding windows regression method.
1. Initialization: r=s,k= 1.
2. Calculate the smoothed signaleof r.
• consider a 2n+ 1 width interval [i−n;i+n] centered on the pointi.
• calculate smoothed signal eon this interval.
• define a new point e(i).
• slide the interval of a point and start again: i=i+ 1 (define e(i+ 1)). 3. Extract the modep=r−e, poser =e.
4. Go to step 2 with k=k+ 1.
This algorithm is simple, but effective enough: it reduces enormously strong variations by removing fast peaks. The choice of polynomial degree is important. For each interval we determine the polynomial minimizing the least squares error.
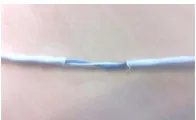
Figure 2. AWG24 twisted pair with a soft defect.
0 1 2 3 4 5 6
Distance (m)
reflectogramme initial reflectogramme traité
Injection Signal
Soft Defect
End of cable
-0.4 -0.2 0 0.2 0.4 0.6 0.8 1
Amplitude
Figure 3. SACM simulation results on the twisted pair.
0 1 2 3 4 5 6
Distance (m)
reflectogramme initial reflectogramme traité
Soft Defect
-0.4 -0.2 0 0.2 0.4 0.6 0.8 1
Amplitude
Figure 4. SACM experimental results with the twisted pair.
4. APPLICATIONS OF THE MEMD/SACM
4.1. Application of the SACM to Reflectogram
We inject a 1ns width temporal Gaussian pulse to the cable extremity. The pulse width was chosen so as to detect a small soft defect (about 2 cm).
We tested the proposed methods on a five meters shielded twisted pair cable AWG24 by simulation on the Diagno Suite 2012 software (software developed at CEA LIST) and experimentally. The soft defect consists in removing the sheath and the shielding of a small portion of the cable (about 2 cm in the middle of the cable), Figure 2. This type of cable (shielded twisted pair) is widely used in the aeronautic industry. For the simulations, the defect has been modeled by a portion of unshielded twisted cable.
Figures 3 and 4 show the application of SACM by simulation and by experience respectively. The amplitudes in the following figures are normalized (without units). The curves mentioned by “initial reflectogram” show the reflectogram of a cable with a soft defect located approximately at 2.50 meters. The electrical pattern, characteristic of a soft defect, has a very low amplitude and probably difficult to detect. The SACM processed curves show that the SACM method has amplified the signature of the soft defect without degrading the location of its position.
4.2. Application of the Joint MEMD/SACM to a Reflectogram with Noise
Figure 5 shows an example with a SNR = 10 dB. In this case the proposed algorithm can achieve a gain of about 5 (14 dB). The comparison of this figure with Figure 3 (a gain of about 14 (23 dB) in the absence of noise) shows that the addition of noise reduces the SACM algorithm gain. Hence, in order to improve the gain of the SACM denoising is required.
0 1 2 3 4 5 6 Distance (m) reflectogramme initial reflectogramme traité -0.2 0 0.2 0.4 0.6 0.8 1 1.2 Amplitude
Figure 5. Robustness of the SACM to the noise (SNR = 10 dB).
0 100 200 300 400 500 600 700 Sample Number -0.2 0 0.2 0.4 0.6 0.8 1 1.2 Amplitude
Figure 6. Reflectogram denoised by MEMD.
0 100 200 300 400 500 600 700 Sample Number -0.4 -0.2 0 0.2 0.4 0.6 0.8 1 Amplitude
Figure 7. Reflectogram denoised by MEMD and treated with SACM.
-5 0 5 10 15 20
SNRe 12 Itérations 10 Itérations 8 Itérations 5 Itérations SNRs 10 12 14 16 18 20 22 24 26 28
Figure 8. SNR (dB) at the MEMD algorithm output vs SNR (dB) at its input.
The size of the denoising window depends on the reflectogram sample rate and soft defect signature size which depends on the temporal width of the injection pulse.
Figure 5 shows the denoised reflectogram with the MEMD method. Figure 7 shows the results of the application of the self-adaptive correlation method on this denoised reflectogram.
Figure 5 shows the reflectogram treated directly by the SACM method without being de-noised by MEMD.
The comparison of Figures 5 and 7 show that the de-noising by MEMD improves the performance of the SACM method which gives a better gain in the soft defect signature amplitude and therefore a better detectability of soft defect.
The impact of the number of iterations on the denoising studied in terms of SNR is shown on Figure 8.
We note that the SNR at the output increases naturally with the input SNR and by increasing the number of iterations of the algorithm MEMD.
5. CONCLUSION
Hence, we proposed a new simple and effective alternative for denoising of reflectogram, called MEMD.
This contribution keeps the advantage of EMD and overcomes some limitations of classical EMD such as the existence of modes, convergence. . . while paving the way for a better management of the concept of interpolation and local average.
The joint MEMD/SACM method gives a better amplification of the soft defect signature amplitude, making them more easily detectable.
REFERENCES
1. Pan, T.-W., C.-W. Hsue, and J.-F. Huang, “Time-domain reflectometry using arbitrary incident waveforms,”IEEE Transactions on Microwave Theory and Techniques, Vol. 50, No. 11, 2558–2563, 2002.
2. Vanhamme, H., “High resolution frequency-domain reflectometry,” IEEE Transactions on Instrumentation and Measurement, Vol. 39, No. 2, 369–375, Apr. 1990.
3. Smith, P., C. Furse, and J. Gunther, “Analysis of spread spectrum time domain reflectometry for wire fault location,” IEEE Sensors Journal, Vol. 5, No. 6, 1469–1478, 2005.
4. Auzanneau, F., “Wire troubleshooting and diagnosis: Review and perspectives,” Progress In Electromagnetics Research B, Vol. 49, 253–279, 2013.
5. Shin, Y. J., “Theory and application of time-frequency analysis to transient phenomena in electric power and other physical systems,” Ph.D. Thesis, University of Texas, 2004.
6. Franchet, M., “Proc´ed´e de r´eflectom´etrie pour la d´etection de d´efauts non-francs dans un cˆable ´electrique et syst`eme mettant en œuvre le proc´ed´e,” EP 2769230 A1, Fran¸cais Brev., 2011.
7. Proakis, J. G. and D. G. Manolakis, Digital Signal Processing: Principles, Algorithms, and Applications,3rd Edition, Prentice-Hall, 1996.
8. Donoho, D. L., “De-noising by soft-thresholding,” IEEE Trans. Inform. Theory, Vol. 41, No. 3, 613–627, 1995.
9. Mallat, S. and Z. Zhang, “Matching pursuits with time-frequency dictionaries,” IEEE Trans. Sig. Process., Vol. 41, 3397–3415, 1993.
10. Huang, N. E., et al., “The empirical mode decomposition and the hilbert spectrum for nonlinear and non-stationary time series analysis,” Proc. R. Soc. Lond. A, Vol. 454, 903–995, The Royal Society, 1998.