Scholarship@Western
Scholarship@Western
Electronic Thesis and Dissertation Repository
8-10-2015 12:00 AM
Reducing Sedentary Behaviour In University Students Using A Text
Reducing Sedentary Behaviour In University Students Using A Text
Message-Based Intervention
Message-Based Intervention
Emma Cotten
The University of Western Ontario
Supervisor
Harry Prapavessis
The University of Western Ontario Graduate Program in Kinesiology
A thesis submitted in partial fulfillment of the requirements for the degree in Master of Arts © Emma Cotten 2015
Follow this and additional works at: https://ir.lib.uwo.ca/etd
Part of the Other Kinesiology Commons
Recommended Citation Recommended Citation
Cotten, Emma, "Reducing Sedentary Behaviour In University Students Using A Text Message-Based Intervention" (2015). Electronic Thesis and Dissertation Repository. 3022.
https://ir.lib.uwo.ca/etd/3022
This Dissertation/Thesis is brought to you for free and open access by Scholarship@Western. It has been accepted for inclusion in Electronic Thesis and Dissertation Repository by an authorized administrator of
(Thesis format: Monograph)
by
Emma Cotten
Graduate Program in Kinesiology
A thesis submitted in partial fulfillment of the requirements for the degree of
Master of Arts
The School of Graduate and Postdoctoral Studies The University of Western Ontario
London, Ontario, Canada
ii
Abstract
Sedentary behaviour (SB) has been linked to many health problems (e.g., type 2 diabetes, heart disease). Interventions aimed at office workers, overweight and obese individuals have proven successful in reducing SB; however, no studies have examined university students. Text message-based interventions have succeeded to aid in smoking cessation and increase both physical activity and healthy eating, but have not been shown to reduce SB. Eighty-two university students were randomized into intervention (SB related text messages) or control (text messages unrelated to SB) groups. Participants received daily text messages and
reported various SBs (i.e., breaks from sitting, standing, light and moderate intensity physical activity) at four time points (baseline, 2, 4 and 6 weeks). Small to moderate effects that either approached or did not reach significance were found that consistently favored the
intervention group for all SB measures. Findings suggest text messages have the potential to reduce SB in university students.
Keywords
iii
Acknowledgments
iv
Table of Contents
Abstract ... ii
Acknowledgments ... iii
Table of Contents ... iv
List of Tables ... v
List of Figures ... vi
List of Appendices ... vii
1 Introduction ... 1
1.1 Sedentary Behaviour ... 1
1.2 Health Risks ... 1
1.3 Breaking up sitting time ... 4
1.4 Interventions in the workplace ... 5
1.5 Interventions with special populations ... 7
1.6 Summary of Intervention work ... 8
1.7 Text message interventions ... 9
1.8 Message framing and the current intervention ... 12
1.9 Self-efficacy ... 13
2 The Current Study ... 17
2.1 Methods... 17
2.2 Results ... 22
3 Discussion ... 47
References ... 57
Appendices ... 70
v
List of Tables
Table 1: Demographic Variables ... 27
Table 2: Reliability of Scales ... 28
Table 3: Means, Standard Deviations, and 95% Confidence Intervals for frequency of breaks at each time point. M (minutes) ... 32
Table 4: Means, Standard Deviations, and 95% Confidence Intervals for length of break at each time point. M (minutes) ... 34
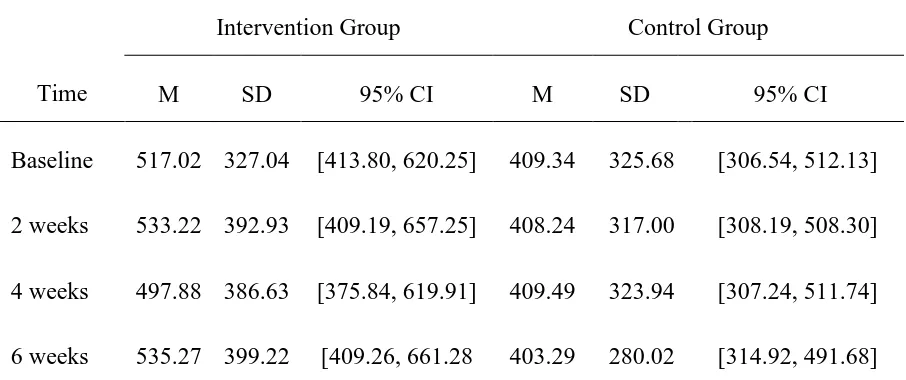
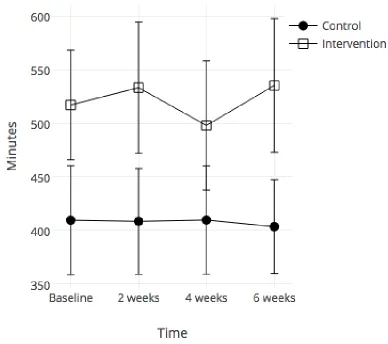
Table 5: Means, Standard Deviations, and 95% Confidence Intervals for time spent standing at each time point. ... 36
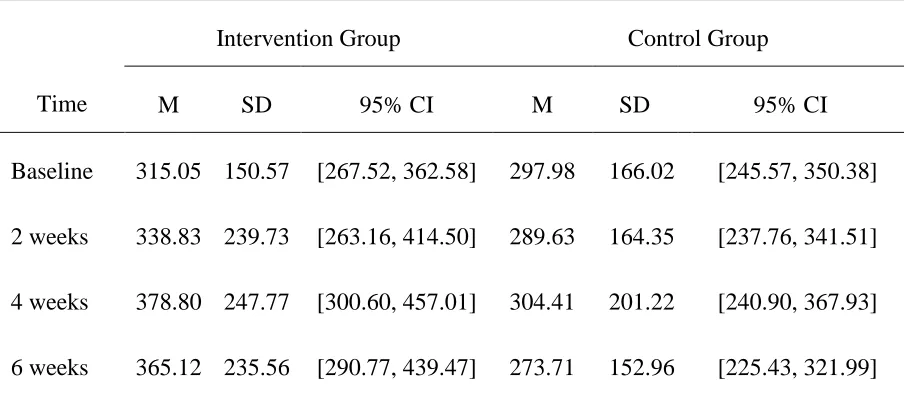
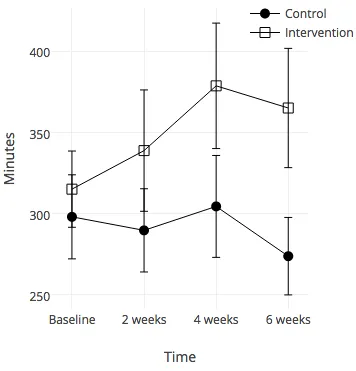
Table 6: Means, Standard Deviations, and 95% Confidence Intervals for time spent in light intensity physical activity at each time point. ... 38
Table 7: Means, Standard Deviations, and 95% Confidence Intervals for time spent in
moderate intensity physical activity at baseline and after 6 weeks. M (minutes/week) ... 40
Table 8: Means, Standard Deviations, and 95% Confidence Intervals for self-efficacy of frequency of breaks at each time point. M (%) ... 42
Table 9: Means, Standard Deviations, and 95% Confidence Intervals for self-efficacy of length of breaks at each time point. M (%) ... 44
Table 10: Means, Standard Deviations, and 95% Confidence Intervals for self-efficacy of decreasing daily sitting time at each time point. M (%) ... 46
Table 11: Correlation between self-efficacy and target behaviours at baseline ... 48
vi
List of Figures
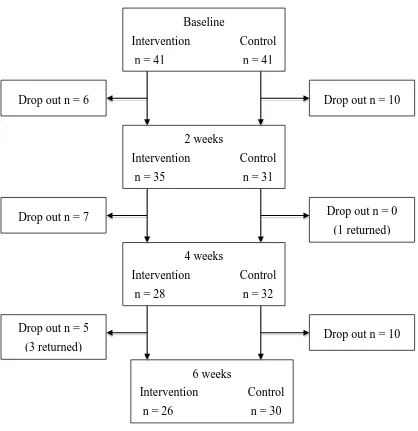
Figure 1: Flow of participants throughout the study. ... 24
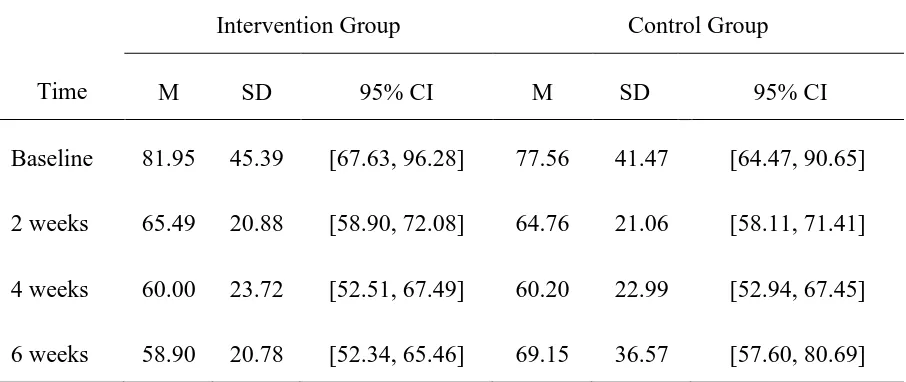
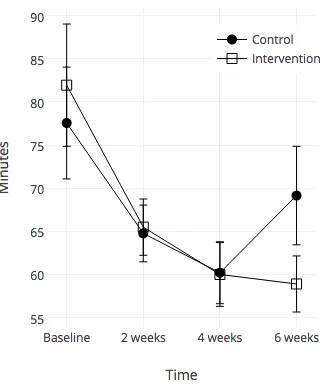
Figure 2: Frequency of breaks from sitting at each time point. Error bars represent standard error. ... 33
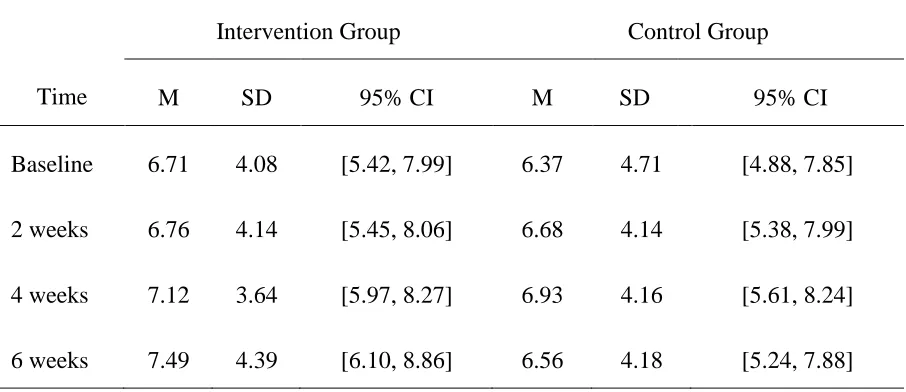
Figure 3: Length of break at each time point. Error bars represent standard error. ... 35
Figure 4: Time spent standing at each time point. Error bars represent standard error. ... 37
Figure 5: Time spent doing light intensity PA at each time point. Error bars represent
standard error. ... 39
Figure 6: Time spent MVPA at each time point. Error bars represent standard error. ... 41
Figure 7: Confidence in taking more frequent breaks from sitting at each time point. Error bars represent standard error. ... 43
Figure 8: Confidence in taking longer breaks from sitting at each time point. Error bars represent standard error... 45
Figure 9: Confidence in reducing daily sitting time at each time point. Error bars represent standard error. ... 47
vii
List of Appendices
Appendix A ... 70
Recruitment E-mail………69
Ethics Approval……….……….70
Letter of Information………..71
Appendix B ... 77
Demographics Questionnaire………76
Physical Activity Recall Questionnaire……….……....77
Self-Efficacy and Breaks Questionnaire………..……….…….78
Sedentary and Light Intensity Physical Activity Questionnaire………....……83
1
Introduction
1.1
Sedentary Behaviour
Sedentary behaviour such as screen viewing, reading, and riding in an automobile, can be defined as any waking activity at an energy expenditure of <1.5 METs (metabolic equivalents) while in a sitting or reclining posture (Canadian Society for Exercise
Physiology, 2014). A MET is a unit that represents the metabolic equivalent of an activity expressed in multiples of resting rate of oxygen consumption, with one MET
corresponding to resting metabolic rate (Tremblay, Colley, Saunders, Healy, & Owen, 2010). The World Health Organization recommends adults to get 150 minutes a week of moderate to vigorous Physical Activity (PA) in order to prevent poor health (World Health Organization, 2010). In reality, very few adults meet this recommendation, and of those that do, many are still subject to the health risks that have been attributed to sitting for long periods of time. Key findings have supported the notion that sedentary behaviour is separate from physical inactivity. Physical inactivity is a lack of being physically active (i.e., not meeting physical activity guidelines every day), whereas sedentary behaviour is the act of prolonged sitting during day-to-day life (Owen, Healy, Matthews, & Dunstan, 2010). Both physical inactivity and sedentary behaviour have overlapping health risks, but sedentary behaviour also has some distinct health risks and thus should be looked at as separate from physical inactivity (Chastin, & Granat, 2009).
1.2
Health Risks
Other cardiometabolic biomarkers have also been shown to be affected by prolonged sitting such as increased waist circumference, lower levels of HDL-cholesterol, increased levels of C-reactive protein, higher levels of triglycerides and raised 2-h plasma glucose (Henson et al., 2013; Edwardson et al., 2012; Shuval et al., 2014; Healy et al., 2007, 2008b, 2011; Carson et al., 2014; Ekelund, Griffin, & Wareham, 2007; Grontved et al., 2011; Ford, & Caspersen, 2012). All of these cardiometabolic biomarkers are risk factors for metabolic syndrome (Edwardson et al., 2012), and when increased waist
circumference is combined with any other two factors, the risk of fatal cardiovascular disease and all-cause mortality are increased significantly (Grontved et al., 2011; Edwardson et al., 2012, Wilmot et al., 2012; Ford et al., 2012). Another large study examined all-cause mortality rates and sitting time for 222,497 adults. The study found that compared to those who sat for less than 4 hours per day, those who sat for 4-8 hours had a 2% increase (95% CI [0.95-1.09]) in all-cause mortality, those who sat for 8-11 hours per day had a 15% increase (95% CI [1.06-1.25]), and those who sat for more than 11 hours per day had a 40% increase (95% CI [1.27-1.55]) (van der Ploeg, Chey, Korda, Banks, & Bauman, 2012). A possible explanation for the relationship between some of these health risks and prolonged sitting is that when a subject is engaged in sedentary behaviours, the subsequent loss in muscle contraction reduces glucose uptake, and suppresses the activity of skeletal muscle lipoprotein lipase (LPL). This LPL activity is necessary for the production of high-density cholesterol and triglyceride uptake (Bey, & Hamilton, 2003; Hamilton, Hamilton, & Zderic, 2004; Tremblay, Colley, Saunders, Healy, & Owen, 2010).
Fredriksson, Nilsson, & Sjodahl, 1993), 1.32 for endometrial cancer (Shu, Hatch, Zheng, Gao, & Brinton, 1993; Friedenreich, Cook, Magliocco, Duggan, & Courneya, 2010; Patel et al., 2008; Arem et al., 2011; Gierach et al., 2009; Friberg, Mantzoros, & Wolk, 2006), and 1.21 for lung cancer (Lam et al., 2013; Dosemeci et al., 1993; Ukawa et al., 2013). They also found that for every 2 extra hours of sedentary time per day, there was a 10% increased risk of endometrial cancer, and an 8% risk of colon cancer (Schmid, & Leitzmann, 2014).
There are also studies, which have examined the increased risk of other health issues due to prolonged sitting. Researchers looked at depressive symptoms and sitting time in 8962 women and found that those who sat for 4 or more hours per day were 1.5 times more likely to have depressive symptoms than those who sat for less than 4 hours per day (95% CI [1.05, 1.32], & 95% CI [1.29, 1.67] respectively) (van Uffelen et al., 2013). Another study looked at telomere length in blood cells, which has been linked to longevity, in relation to sitting time in older adults who were taking part in a physical activity
intervention. They discovered that the intervention group had more telomere lengthening which was associated with the reduced amount of sitting time in this group (p=0.02) (Sjögren et al., 2014).
The above health risks have been shown to relate to sedentary behaviour irrespective of whether or not individuals were reaching moderate-to-vigorous physical activity
recommendations (Grontved et al., 2011; Healy et al., 2011; Helmerhorst et al., 2009; Schmid et al., 2014; Thorp et al., 2011; van der Ploeg et al., 2012; van Uffelen et al., 2013). Affectionately labeled, “the active couch potato,” an individual can engage in prolonged television or computer screen viewing but still be considered active by meeting public health guidelines (Owen et al., 2010).
circumference, and overall weight gain, which is related to metabolic syndrome, type 2 diabetes, as well as cancer (Lynch, 2010; McCullough et al., 2011; Kushi et al., 2012; Schmid, & Leitzmann, 2013).
1.3
Breaking up sitting time
With all of the poor health outcomes associated with sedentary behaviour, it is important to learn how to reduce these risks. While there are currently no recommendations of how long adults should spend sitting, or how often to break up prolonged sitting, many researchers have examined how to prevent some of the known health risks. A study carried out by Healy and colleagues (2008) looked at the number of breaks from sitting in relation to several biological markers of metabolic risk in 168 adults. They found that those who took the most breaks from sitting had a smaller waist circumference (= -0.16, 95% CI [-0.31, -0.02]), lower body mass index (= -0.19, 95% CI [-0.35, -0.02]), lower levels of triglycerides (= -0.18, 95% CI [-0.34, -0.02]), and lower 2-h plasma glucose levels (= -0.18, 95% CI [-0.34, -0.02]) compared to those who took the least amount of breaks from sitting (Healy et al., 2008). A later study by Healy and colleagues (2011) found an association between breaks from sitting and waist circumference, C-reactive protein, and fasting plasma glucose, irrespective of total sitting time (Healy, Matthews, Dunstan, Winkler, & Owen, 2011).
Researchers have looked into what constitutes an effective break from sitting, and have found that although standing is better than sitting, light intensity physical activity is the most beneficial. A study by Bailey and Locke (2014) found that breaking up sitting with standing did not improve postprandial glucose levels, however light-intensity walking did (p<0.001). Dunstan and colleagues (2012) also found a decrease in glucose levels
2012). Howard and colleagues (2013) found that interrupting sitting with a 2-minute bout of light-intensity walking every 20 minutes decreased plasma fibrinogen by 0.17 gL-1 (95% CI [0.01, 0.32], p<0.05) compared to uninterrupted sitting. They also found that both moderate and light intensity breaks attenuated the reduced plasma volume and increased hematocrit, hemoglobin and red blood cell count found in uninterrupted sitting (Howard et al., 2013). Another study examining breaks from sitting found that
interrupting 8 hours of sitting with hourly 8-minute moderate-intensity cycling bouts reduced levels of C-peptide compared to uninterrupted sitting (p<0.017) (Altenburg, Rotteveel, Dunstan, Salmon, & Chinapaw, 2012).
Beneficial breaks from sitting in the above studies were typically 2-4 minutes in length, for every 20 minutes of sitting, which could lead to future guidelines recommending these types of breaks. As for total amount of time sitting, one study found that reducing sitting to less than 3 hours per day could result in a 2-year gain in life expectancy (Katzmarzyk, & Lee, 2012) As previously mentioned, women who sat for less than 4 hours per day had a much lower prevalence of depressive symptoms (van Uffelen, 2013), and adults who sat for less than 4 hours, regardless of gender, had a reduction in all-cause mortality (van der Ploeg et al., 2012). Although there are no official recommendations, early evidence suggest that sitting for 4 hours or less per day may prevent many of the aforementioned health risks.
1.4
Interventions in the workplace
There have been many interventions aimed at decreasing sedentary behaviour and they have been met with varying levels of success. Since a large portion of an adult’s day is spent at work, and many adults work desk jobs, numerous studies have explored reducing sedentary time in office workers. Alkhajah and colleagues (2012) gave 18 office-workers sit-stand workstations and were able to reduce sitting time by 143 minutes/workday (95% CI [-184, -102], p<0.001) compared to controls after 1 week. These findings were
and included a group that received e-mails, face-to-face coaching and phone calls from management, on top of receiving the new workstations (Neuhaus, Healy, Dunstan, Owen, & Eakin, 2014). After 3 months, the multi-component group decreased sitting by 89 minutes per workday (95% CI [130, 47]), whereas the workstations-only group only decreased their sitting by 33 minutes (95% CI [74, 7]) (Neuhaus et al., 2014). A third study using sit-stand devices was able to reduce sitting time by 66 minutes per day in 7 weeks (p=0.03) (Pronk, Katz, Lowry, & Rodmyre Payfer, 2012). They also found the devices helped with musculoskeletal pain by reducing upper back and neck pain by 54% (p=0.008) and once the sit-stand devices were removed, all of the observed effects went back to baseline levels within 2 weeks (p=0.027) (Pronk et al., 2012). Healy and
colleagues (2013) installed the same sit-stand workstations and emphasized three
messages to the intervention group; “Stand Up, Sit Less, & Move More”. After 4 weeks, the intervention group reduced their sitting time by 125 minutes (95% CI [-161, -89]) and increased standing time by 127 minutes (95% CI [92, 162]) (Healy et al., 2013). Sitting was exclusively replaced by standing, which does have some benefits; however, the “Move More” message was not adopted, which would offer the most health benefits.
A major obstacle that is encountered when attempting to encourage office workers to move more during the workday is the fact that they cannot leave their desk without losing productivity. When sit-stand workstations were installed in the workplace, several
researchers were able to reduce sitting and replace it with standing; however, none of the above studies succeeded in increasing light or moderate physical activity. Carr and colleagues (2013) used portable pedal machines in an effort to have office workers replace passive sitting with active sitting. The intervention group reduced daily sedentary time by 58.7 minutes per day (95% CI [-118, 0.99]) compared to controls whom
to 1150 minutes per day, an increase in standing from 146 to 203 minutes per day and an increase in stepping time from 52 to 90 minutes per day after 9 months (p < 0.05) (John et al., 2011). A second study also introduced treadmill desks and found a decrease from 1,020 minutes of sedentary time per day to 978 minutes after 1 year (p < 0.001). They also found an increase in walking from 70 minutes per day at baseline, to 109 minutes after 1 year (p < 0.001) (Koepp et al., 2013). These results are promising for office workers who want to replace sedentary time with light intensity physical activity, rather than just standing. Another encouraging finding with workplace interventions is that several studies looked into the effect they had on productivity and found that none of the interventions decreased productivity, and that one study actually found an increase in productivity (Davis et al., 2009; Ebara et al., 2008; Husemann et al., 2009; Nerhood and Thompson, 1994). This evidence could help to encourage companies to include various interventions in the work place to reduce sedentary behaviour in their employees without impinging on productivity.
1.5
Interventions with specific populations
with 47.2 minutes per day (95% CI [-66.3, -28.2]) and increasing LIPA by 31 minutes per day (95% CI [15.8, 46.2]) (Bond et al., 2014).
Overweight and obese individuals who have already been diagnosed with type 2 diabetes have been shown to benefit from an increase in physical activity levels through various PA programs; however, these interventions often have high drop-out rates, are expensive and time consuming, and maintaining physical activity long-term has rarely been
successful (Ecclestone, Myers, & Paterson, 1998; Dunn et al., 1999; Tudor-Locke et al., 2004). Rather than enroll patients into exercise programs, which have a high rate of failure, a shift towards lifestyle interventions has found more success (Richardson et al., 2007). Decreasing sedentary behaviour has been shown to reduce the same health risks as PA; however, changes in sedentary behaviour can be done in small increments
throughout the day and participants are able to conveniently implement healthy behaviours into their everyday life, instead of having to follow a structured program (Dunn et al., 1999). De Greef and colleagues (2010) combined a pedometer-based lifestyle intervention with telephone support to reduce sedentary behaviour and increase steps in obese patients with type 2 diabetes. Those in the intervention group increased their daily steps by 2744 after 24 weeks and maintained an increase of 1872 steps after 1 year (p < 0.001). Controls on the other hand reduced their daily steps by 1256 at 24 weeks and 1275 after 1 year (p < 0.001). The researchers also found a significant difference in the results between the two groups with regards to changes in sedentary time. The intervention group decreased their sedentary time by 12 minutes per day, and the control group increased their sedentary time by 48 minutes per day (p < 0.001) (De Greef et al., 2010).
1.6
Summary of Intervention work
The vast majority of sedentary behaviour interventions have been aimed at office workers, and overweight/obese adults; however very few, if any, target university
remained sedentary 5 or 10 years later (Sparling, & Snow, 2002; Keating, Guan, Castro Piñero, & Bridges, 2005). Aiming interventions at this population are therefore worth implementing when attempting to prevent high levels of sedentary behaviour and reduce overweight/obesity rates in adults. A study investigating the feasibility of reducing sedentary behaviour in libraries installed portable pedal machines (Maeda, Quartiroli, Vos, Carr, & Mahar, 2014). They found a mean cumulative pedal time of 95.5 minutes per day, and that 7% of students who used the library used the pedal machines at least once (Maeda et al., 2014). This is promising as a way to reduce sedentary behaviour in public spaces such as universities; however, interventions aimed at individual students may be more effective.
1.7
Text message interventions
that were analyzed differed in the types of messages that were delivered, the frequency and the timing of messages, the ability to reply to texts and by the length of the
interventions. The meta-analysis broke down various moderators of the interventions to determine if any were more effective than others. They found that there was no
significant difference between studies that combined text messages with other
components (i.e., websites, print materials or contact with counselors) and those who used text messages only. They also found no difference between studies who gave participants the ability to text back to the researcher and those who only used one-way communication. However, they did find a significant difference in the results based on the frequency of text messages, and found that the studies which decreased the frequency of messages over time, and the studies which allowed the participants to individualize the timing of messages were most effective (Head et al., 2013).
A closer examination of the smoking cessation studies demonstrated that texts that were typically sent during high stress times, at times that individuals would usually crave a cigarette, or if the individuals could text the researchers for encouragement and tips during these times the participant was able to overcome the craving. A study done by Brendryen and Kraft (2008) used e-mails, web-pages, and text messages along with nicotine-replacement therapy to help young adults quit smoking. The intervention group had greater success with a 22.3% abstinence rate, whereas the control group only had a 13.1% abstinence rate (Brendryen, & Kraft, 2008). In another study, completed after the meta-analysis, a 6-week follow-up revealed 43% of participants had made at least one 24-hour attempt to quit, and 22% had abstained for a least a week (Obermayer et al., 2014). This is encouraging for the use of text messages to aid in smoking cessation research, and the results of the studies focusing on physical activity are producing hopeful results as well.
messages to improve exercise frequency and found those in the implementation intentions group who also received text messages increased their exercise frequency significantly more than implementation intentions or text messages alone (Prestwich, Perugini, & Hurling, 2009). Some studies have focused on increasing steps and walking time rather than increasing moderate-vigorous physical activity which would be
consistent with an intervention aimed at reducing sitting time, since light intensity physical activity most often replaces sedentary time. Another study by Prestwich and colleagues (2010) used implementation intention combined with text messages that either served as plan reminders or as goal reminders to increase brisk-walking time. Both intervention groups received text messages over 4 weeks and significantly increased the number of days they spent brisk walking for 30 minutes or more compared to the control group (whom didn’t receive any text messages) (p<0.05). The study found that 42% of the goal reminder group, 45% of the plan reminder group and only 22% of the control group increased their walking by at least 2 days per week (Prestwich, Perugini, & Hurling, 2010). Fukuoka and colleagues (2010) used a text messaging intervention to increase daily steps in sedentary women. After one week of measuring their steps, participants were asked through text to increase their steps by 20% compared to their previous weeks’. At the end of 3 weeks they increased their daily steps by an average of 816, from 5394 to 6210 (95% CI [5379, 7041], p < 0.001) (Fukuoka, Vittinghoff, Jong, & Haskell, 2010).
The above studies were conducted with adult populations and have proven to be
efficacious, but studies using text messages to increase any form of health behaviour have not focused on students specifically. A large study found that 96% of American
Gates 2013). These findings show potential for cell phones being used as a way to reduce sedentary behaviour in students specifically.
1.8
Message framing and the current intervention
From the previously mentioned meta-analysis by Head and colleagues (2013), we know that text message-based health interventions can be effective, and we know several components that make these interventions most successful. An important component of an intervention using text messages is the design of the actual messages themselves. It is important to differentiate if the effectiveness of text messages is solely due to receiving attention from the researcher/study, or if it is the actual content of the message that is causing the effect. Most of the previous studies that have used text messages have not given groups equal contact; some studies have texted the intervention group daily, and texted the control groups either not at all or somewhere between 1-2 times over 2 weeks. This makes it hard to determine if receiving a text is acting as a prompt to move, or if it is the information inside the text that is being utilized. Therefore, using equal contact with different message content could provide more insight into the actual mechanism behind the interventions. The current intervention will ensure each treatment condition is receiving different text messages throughout the entire trial.
themselves and their current lifestyles and for them to feel as though the messages are being personalized to them (i.e., by using their name).
1.9
Self-efficacy
Self-efficacy, defined by Bandura (1997) as one’s belief in one’s ability to perform a behaviour successfully, is often looked at in relation to health behaviours. Bandura has stated that self-efficacy affects health behaviours through goals, outcome expectations, and socio-structural factors, as well as affecting these behaviours directly. It has been shown that perceived self-efficacy is related to adopting new health behaviours through the search and adoption of new health knowledge (Bandura, 2004; Rimal, 2000, 2001). This indicates that one’s preexisting self-efficacy has a large influence on the likelihood of adopting a behaviour. However it is also possible to increase one’s self-efficacy through an outside source, and thus increasing the likelihood of adopting change. Those with high self-efficacy for a certain behaviour will typically perform harder to achieve goals, especially in the face of barriers.
Self-efficacy as a determinant of physical activity has been studied frequently, and results show that those with higher self-efficacy for physical activity will spend more time being physically active (Sallis, & Hovell 1990; Marcus, & Simkin, 1993; Dishman, 1994; Nigg, & Courneya, 1998). Specifically in university students, it has been shown that
self-efficacy is an essential factor for physical activity behaviours and those who had a higher self-efficacy for physical activity had higher levels of exercise participation (Wallace, Buckworth, Kirby, & Sherman, 2000; Wallace, & Buckworth, 2003; Keating et al., 2005). They also found that self-efficacy was one of the highest contributing factors to exercise behaviour change among female students, which is key for getting
non-exercisers to begin exercising. Another study found a positive relationship between VO2 max (a common measure of one’s fitness level) with self-efficacy for physical activity (β=0.26, p = 0.049; Lepp 2013).
that by educating people about the benefits of sitting less, and by providing ways to break up sitting and to reduce overall sedentary behaviour, their self-efficacy would increase, and they would then be more likely to achieve these target behaviours. Presently, there is a shortage of research that examines self-efficacy for reducing sedentary behaviour. If one does not believe they can successfully break up their sitting more often, or reduce their overall sitting, they will be less likely to attempt doing so. Sitting less is a daunting task because sitting, in many situations, is an automatic behaviour. We sit at school, at work, at home, in the car, and in many public spaces. If there is a chair in the room or if others are sitting, we usually take that as a cue to sit, and sitting is seen as the norm in society.
Owen and colleagues (2011) have shown that using self-monitoring (i.e., tracking the amount of time spent sitting) and setting realistic and measurable goals (i.e., using TV commercials as times to get up and move around)—two methods to bolster
self-efficacy—can reduce sedentary behaviour (Owen et al., 2011). Having participants in the present study fill out the amount of time they spend sitting in a day may serve as means of self-monitoring. Similarly, the text messages themselves will not only give reminders to move around, but will also give small goals for participants to work towards each week. Therefore, using text messages to increase self-efficacy for reducing sedentary behaviour seems plausible.
Theoretically, the differences between types of self-efficacy are important for gaining a complete understanding of the relationship between self-efficacy andsedentary
Purpose
The primary purpose of the current study was to determine whether a text message intervention would increase break frequency and length of break from sitting, time spent standing, and time spent in light and moderate intensity physical activity in university students.
A secondary purpose was to determine whether the intervention would increase self-efficacious beliefs regarding break frequency and length of break from sitting and total sitting time.
Another secondary purpose was to determine if self-efficacious beliefs towards length and frequency of breaks and if self-efficacious beliefs towards sitting less would be related to actual break behaviour, time spent standing, and time spent in light and moderate intensity physical activity.
Hypothesis
H1. It was hypothesized that those in the intervention group (who received text messages with tips, reminders, facts and goals to sit less) would report a greater decrease in time between breaks, a greater increase in length of breaks, as well as a greater increase in time spent standing and in light and moderate intensity physical activity compared to controls (who received text messages unrelated to sitting less).
H2. It was also hypothesized that those in the intervention group would report a greater increase in self-efficacy for breaks and sitting less compared to their control counterparts.
2
The Current Study
The subsequent methods are reported in accordance with CONSORT principles (www.consort-statement.org). The conduct of this study adhered to the guidelines outlined in the Declaration of Helsinki (World Medical Association, 2013) and the Handbook for Good Clinical Research Practice (WHO, 2002). Ethical approval was granted from Western University’s Health Sciences Research Ethics Board (#105615; Appendix A). All participants were given the Letter of Information (Appendix A) and gave implied consent by filling out the first questionnaire.
2.1
Methods
Design
This research study used a 6-week parallel two-arm randomized equal contact control trial with randomization being done using a computer-generated 0 or 1 allocation.
Sample Size Calculation
Due to the novelty and exploratory nature of this study, there was a dearth of evidence available from which to base a sample size power calculation.
Participants
Inclusion criteria: (1) 18-64 years of age, (2) be able to read and write in English, (3) own and be able to operate a cell phone that has texting capabilities and a plan with unlimited incoming text messages, (4) be a student at Western University. Eighty-two participants (Mean age 21.43 years, SD 5.16, Males = 21) who satisfied all criteria completed the baseline measurements and were randomized into one of two conditions: the intervention arm (sedentary behaviour centered text messages), or the control arm (text messages unrelated to sedentary behaviour).
Frequency of breaks. The frequency of breaks taken from sitting was measured by the following question “I currently take a break to get up and move around every _ minutes I spend sitting”. The options the participants could choose from were; every 30 minutes or less, 45 minutes, 60 minutes, 75 minutes, 90 minutes, 120 minutes, 180 minutes or 240 minutes or more.
Length of breaks. Length of breaks taken from sitting was measured by the following question: “Currently, which number best represents the length of your breaks you usually take from sitting?” The answers included 30 seconds or less, 1-minute, 2 minutes, 3 minutes, 4 minutes, 5 minutes, 10 minutes or 15 minutes.
Standing and light intensity physical activity. Time spent standing and time spent doing light intensity physical activity (LIPA) were measured using items 2, 4, 9, 10, 12, 19 and items 3, 7, 8, 11, 13, 14, respectively, of the Sedentary and Light Intensity Physical Activity Questionnaire. The SLIPA measures time spent doing typical daily sedentary or light intensity physical activities. The SLIPA has been validated against ActiGraph GTX3 accelerometers and the cut off points for sedentary behaviour and light intensity physical activity, were anything under 100 counts per minute and 100-1951 counts per minute, respectively. The SLIPA is typically used as a 7-day log; however, to ease participant burden, the current study asked participants to fill out the items based on a typical weekday and a typical weekend day. Internal consistency Cronbach alphas for the scale constructs were acceptable (see Table 2). Although the SLIPA provides a measure of sedentary behaviour, the goal of this text intervention was to directly target and positively change standing and light intensity physical activity. After careful
examination of the sedentary behaviour items (items 1, 5, 6, 15, 16, 17 and 18), it became evident that some items were not relevant to the text intervention (e.g., driving a car) or overlapped with each other (e.g., studying, writing, desk work, typing vs. sitting-using a computer) casitting-using many overestimated data points. For these reasons, this sitting measure was not calculated and used in subsequent analyses.
1985).The questionnaire measures (1) moderate, (2) hard, and (3) very hard physical activity. Participants were asked to estimate the number of minutes they spent doing each during the last 7 days. Participants were also asked to determine how many days in the past week they acquired 30 minutes or more of (1) hard or very hard activity, and (2) moderate, hard or very hard activity. In order to determine if these numbers represented their typical weeks, a final question was asked that compared their physical activity levels over the last 7 days with the previous three months. Moderate intensity was being
targeted by some of the texts in the intervention (i.e. “Your challenge for tomorrow is to do 30 squats for every episode of TV you watch”), whereas hard and very hard were not specifically targeted, and thus only moderate intensity was analyzed in the results.
Secondary Outcome Measures
Self-Efficacy. To measure self-efficacy, a purpose-built questionnaire was
designed.This questionnaire was comprised of 3 questions, each with several statements. The first being “I am __% confident I can decrease the amount of time I sit every day by 20 minutes”, with possible answers ranging from 0-100 in intervals of 5%. The question was repeated with 30, 45, 60, 75 and 90 minutes. The second question was “I am __% confident I can take a break from sitting every 240 minutes” which was repeated for 180, 120, 90, 75, 60, 45 and 30 minutes or less. The third question was “I am __% confident I can increase the length of my breaks from sitting by 30 seconds”, and was also repeated for 1, 2, 3, 4, 5, 10 and 15 minutes. All questions had the same possible answers. The self-efficacy scales demonstrated acceptable internal consistency (see Table 2).
Other Measures
Demographics. The following demographic information was obtained: name, age, phone number, gender, ethnicity, level of education (undergraduate, graduate or other), number of hours in class per week, number of hours at work per week, as well as height and weight in order to calculate Body Mass Index.
Sedentary behaviour related text messages. The intervention group received text messages twice daily, one in the morning or early afternoon and one in the evening, depending on when they reported not being in class or meetings during the first
to meet and more tips and reminders to attain these goals throughout the week, they will be receiving 1-2 texts per day, whereas controls will receive 1 text per day (unrelated to sedentary behaviour) to keep near similar contact for both groups.
Text messages unrelated to sedentary behaviour. The control group received daily text messages in the evenings about random health or nutrition facts such as; “Raw pumpkin seeds contain essential fatty acids and beneficial proteins” or “Between 25% to 33% of the population sneeze when they are exposed to light.”
Procedure
The study was advertised through e-mails sent out to various faculties at Western University and students who were interested in the study e-mailed the researcher to sign up. The study was also advertised through an article in the university newspaper due to the interest of a reporter. Once participants signed up they received a link via e-mail that sent them to the first questionnaire, which was administered through a third party website called SOSCI. Upon completion of the baseline measurements, participants were
randomized into either the intervention group or the control group and entered into a contact list on the text messaging website called Oh Don’t Forget (ODF). ODF is an online application that works through Recess Mobile to send messages from a computer to mobile phone numbers that are programmed into the application. Recess mobile and ODF use a secure server to save all information that is entered into the website in order to keep this information protected. The researcher can then program all future messages that are to be sent during the study and the messages will be sent automatically at the correct date and time.
only asked at baseline and at 6 weeks in order to reduce the length of the questionnaires). Upon completion of the final questionnaire the participants were notified that they would no longer be receiving text messages and that the study was completed. All
questionnaires can be found in Appendix B.
Statistical Analyses
Primary and secondary outcome analyses
A series of 2 (intervention vs. controls) x 4 (time – baseline, 2 weeks, 4 weeks and 6 weeks) repeated measures ANOVA were used to determine if there were any significant time or time by group interaction effects. Bivariate correlations were conducted on the self-efficacy questionnaires and their matching behaviours. Linear regression was used to determine how much of the variance in the behaviour could be predicted by the matching self-efficacy questionnaire.
The level of significance was accepted at p < .05 for all tests (Tabachnick & Fidell, 1996). Effect sizes (ηρ2) accompany all reported findings. Data were analyzed using IBM SPSS Statistics (Version 23).
2.2
Results
Treatment of Data
Missing Data
Figure 1: Flow of participants throughout the study.
Baseline
Intervention Control n = 41 n = 41
2 weeks
Intervention Control n = 35 n = 31
4 weeks
Intervention Control n = 28 n = 32
6 weeks
Intervention Control n = 26 n = 30
Drop out n = 10
Drop out n = 0 (1 returned)
Drop out n = 10 Drop out n = 6
Drop out n = 7
Assumptions of statistical techniques
The following assumptions were met in the current study. 1) The dependent variables were continuous, 2) a random sample was drawn from the population, 3) each
observation was independent from all other observations, 4) significant outliers were identified and treated before data analysis, 5) the dependent variable has normal distribution according to skewness values (no values over 2) and kurtosis values (no values over 3), and 6) Levene’s test showed homogeneity of variances since no values were less than .05 and therefore not significant.
Fidelity check
All texts were sent as intended. The ‘Oh Don’t Forget’ website produces a sent receipt for each message and ensures the same amount of confidence in messages being sent as any text from a phone. Participants were also asked at each time point if they had been receiving daily texts and all responded that they had.
Group Equivalency at Baseline
Descriptive statistics for the demographic and physical activity variables are shown in Table 1. Independent t-tests showed no significant group differences for demographic measures at baseline for age, t (79) = -.605, p = 0.547, BMI, (79) = -1.709, p = 0.091, hours of class per week, t (79) = .029, p = 0.977, hours of work per week, t (79) = -.179,
p = 0.858, moderate physical activity per week, t (79) = .704, p = 0.484, hard physical activity per week, t (79) = -.405, p = 0.687, very hard physical activity per week, t (79) = .160, p = 0.873, number of days in the past week they achieved 30 minutes or more of hard or very hard physical activity, t (79) = .240, p = 0.811, or number of days in the past week they achieved 30 minutes or more of moderate, hard or very hard physical activity, t (79) = .130, p = 0.897.
Table 1: Demographic Variables
Intervention Group Control Group
Variable M SD % M SD %
Gender (Male)
21.37 3.60
24.4
21.02 4.76
26.8 Age (years)
Body Mass Index 24.57 3.56 23.22 3.54
Hours of class/week 15.63 7.42 15.67 6.73
Hours of work/week 6.33 8.99 5.94 10.35
Type of student:
Undergraduate 87.8 78
Graduate student 12.2 17
Other 0 4.8
Physical Activity: Moderate1
Hard1
Very Hard 1
Days with hard
151.25 170.10 175.00 131.57
94.12 120.63 83.24 121.42
93.23 113.23 97.61 131.70
2.80 2.34 2.93 2.40
Days with moderate 4.25 3.61 4.34 2.66
Table 2: Reliability of Scales (Interclass correlation coefficients)
Scale
Baseline 2 weeks 4 weeks 6 weeks
SLIPA
Stand .75 .80 .87 .75
LIPA .67 .75 .84 .81
Self-efficacy
Frequency of breaks .85 .85 .87 .87
Length of breaks .89 .93 .93 .92
Sit less .94 .96 .93 .94
All scales had good or excellent reliability at all time points (all ICC values over .7 or .9 respectively) except for the light intensity physical activity items of the SLIPA at
Main Analyses
Primary Outcomes – Break frequency and length, standing, light intensity
physical activity and moderate intensity physical activity
Descriptive statistics for the variable of interest are shown in Tables 3 through 7 and Figures 2 through 6. These data show the intervention group increasing the frequency of their breaks from every 81.95 minutes to every 58.90 minutes of sitting, and from every 77.56 minutes to every 69.15 minutes for the control group. These data also reveal that length of break from sitting increased from 6.71 minutes to 7.49 minutes for the intervention group and 6.37 to 6.56 for the controls. Finally these data show that the intervention group increased standing by 18.25 minutes per day, light by 50.07 mins/day, moderate by 13.03 mins/day (total increase in PA/standing of 81.35 minutes). The control group decreased standing by 6.05 mins/day, decreased light by 24.27 mins/day and increased moderate by 3.06 mins/day (total net decrease of 27.26 mins).
There were significant time effects for break frequency: F (3, 78) = 6.32, p = 0.001, Wilks’ Λ = 0.80, ηρ2 = .20, time spent in light intensity PA: F (3, 78) = 2.75 p = 0.048, Wilks’ Λ = 0.90, ηρ2 = .10, and time spent moderate intensity PA: F (3, 80) = 5.25, p = 0.025, Wilks’ Λ = 0.94, ηρ2 = .06. There were no significant time effects for break
length: F (3, 78) = 0.73 p = 0.537, Wilks’ Λ = 0.97, ηρ2 = .03 or time spent standing: F (3, 78) = 0.45, p = 0.715, Wilks’ Λ = .98, ηρ2 = .02.
There were no significant treatment group by time interaction effects for break frequency: F (3, 78) = 1.28, p = 0.287, Wilks’ Λ = 0.95, ηρ2 = .05, break length: F (3, 78) = 0.73 p = 0.629, Wilks’ Λ = 0.98, ηρ2 = .02, time spent standing: F (3, 78) = 0.72, p = 0.544, Wilks’ Λ = .97, ηρ2 = .03, or time spent in moderate: F (3, 80) = 2.01, p = 0.160, Wilks’ Λ = 0.98, ηρ2 = .03. However, there was a trend effect for time spent in light: F (3, 78) = 2.43 p = 0.071, Wilks’ Λ = 0.91, ηρ2 = .09.
Secondary Outcomes - Self-efficacy
to increase frequency of breaks increased from 81.16 to 88.90 (+7.74%) for the intervention group, and from 77.84 to 82.18 (+4.34%) for controls. Confidence to increase length of break increased from 85.63% to 86.53% in the intervention group (+0.90%), and decreased from 82.39% to 81.02% for the controls (-1.37%). Confidence to decrease sitting time increased from 67.42 to 78.86 (+11.44%) for the intervention group, and from 64.61 to 70.92 (+6.31) for the controls.
There were significant time effects for confidence to increase break frequency: F (3, 78) = 9.79 p = 0.000, Wilks’ Λ = 0.73, ηρ2 = .27, confidence to increase break length: F (3, 78) = 6.41 p = 0.001, Wilks’ Λ = 0.80, ηρ2 = .20 and confidence to sit less: F (3, 78) = 8.54 p = 0.000, Wilks’ Λ = 0.75, ηρ2 = .25.
Associations between self-efficacy and behaviours
Baseline
Correlations between the self-efficacy constructs and the actual targeted behaviours are shown in table 11. Linear regressions were performed on variables of interest to
determine how much variance of the behaviours were predicted by the cognitions. Percentages reported are the R square values.
Confidence to increase break frequency predicted 33.1% of the variance of actual break frequency, 1.7% of actual break length, 3.9% of standing time, 3% of LIPA, and 4.2% of MIPA. Confidence to increase break length predicted 10.8% of actual break length, 0% of the variance of actual break frequency, 1.7% of standing time, 6.7% of LIPA, and 0% of MIPA. Confidence to sit less predicted 0% of the variance of break frequency, 2.2% of break length, 1.6% of standing time, 1.8% of LIPA, and 1.5% of MIPA.
6 weeks
Correlations between the self-efficacy constructs and the actual targeted behaviours are shown in table 12. Linear regressions were performed on variables of interest to
determine how much variance of the behaviours were predicted by the cognitions. Percentages reported are the R square values.
Table 3: Means, Standard Deviations, and 95% Confidence Intervals for Frequency
of Breaks at Each Time Point. M (minutes)
Time
Intervention Group Control Group
M SD 95% CI M SD 95% CI
Baseline 81.95 45.39 [67.63, 96.28] 77.56 41.47 [64.47, 90.65]
2 weeks 65.49 20.88 [58.90, 72.08] 64.76 21.06 [58.11, 71.41]
4 weeks 60.00 23.72 [52.51, 67.49] 60.20 22.99 [52.94, 67.45]
Table 4: Means, Standard Deviations, and 95% Confidence Intervals for Length of Break at Each Time Point. M (minutes)
Time
Intervention Group Control Group
M SD 95% CI M SD 95% CI
Baseline 6.71 4.08 [5.42, 7.99] 6.37 4.71 [4.88, 7.85]
2 weeks 6.76 4.14 [5.45, 8.06] 6.68 4.14 [5.38, 7.99]
4 weeks 7.12 3.64 [5.97, 8.27] 6.93 4.16 [5.61, 8.24]
Table 5: Means, Standard Deviations, and 95% Confidence Intervals for Time
Spent Standing at Each Time Point. M (minutes/day)
Time
Intervention Group Control Group
M SD 95% CI M SD 95% CI
Baseline 517.02 327.04 [413.80, 620.25] 409.34 325.68 [306.54, 512.13]
2 weeks 533.22 392.93 [409.19, 657.25] 408.24 317.00 [308.19, 508.30]
4 weeks 497.88 386.63 [375.84, 619.91] 409.49 323.94 [307.24, 511.74]
Table 6: Means, Standard Deviations, and 95% Confidence Intervals for Time
Spent in Light Intensity Physical Activity per Day at Each Time Point. M
(minutes/day)
Time
Intervention Group Control Group
M SD 95% CI M SD 95% CI
Baseline 315.05 150.57 [267.52, 362.58] 297.98 166.02 [245.57, 350.38]
2 weeks 338.83 239.73 [263.16, 414.50] 289.63 164.35 [237.76, 341.51]
4 weeks 378.80 247.77 [300.60, 457.01] 304.41 201.22 [240.90, 367.93]
Table 7: Means, Standard Deviations, and 95% Confidence Intervals for Time
Spent in Moderate Intensity Physical Activity at Baseline and After 6 weeks. M
(minutes/week)
Time
Intervention Group Control Group
M SD 95% CI M SD 95% CI
Baseline 184.15 269.40 [99.11, 269.18] 203.54 183.98 [145.47, 261.61]
Table 8: Means, Standard Deviations, and 95% Confidence Intervals for
Self-Efficacy of Frequency of Breaks at Each Time Point. M (%)
Time
Intervention Group Control Group
M SD 95% CI M SD 95% CI
Baseline 81.16 14.12 [76.70, 85.62] 77.84 16.22 [72.72, 82.96]
2 weeks 86.06 14.07 [81.62, 90.50] 76.15 18.71 [70.24, 82.06]
4 weeks 89.07 12.43 [85.15, 92.99] 84.52 14.35 [79.98, 89.05]
Table 9: Means, Standard Deviations, and 95% Confidence Intervals for
Self-Efficacy of Length of Breaks at Each Time Point M (%)
Time
Intervention Group Control Group
M SD 95% CI M SD 95% CI
Baseline 85.63 14.40 [81.08, 90.17] 82.39 16.16 [77.29, 87.50]
2 weeks 81.25 17.68 [75.67, 86.83] 78.68 16.91 [73.34, 84.01]
4 weeks 81.85 18.21 [76.10, 87.60] 80.61 16.69 [75.34, 85.88]
Table 10: Means, Standard Deviations, and 95% Confidence Intervals for
Self-Efficacy of Decreasing Daily Sitting Time at Each Time Point. M (%)
Time
Intervention Group Control Group
M SD 95% CI M SD 95% CI
Baseline 67.42 21.93 [60.42, 74.26] 64.61 21.26 [57.90, 71.32]
2 weeks 67.07 23.58 [59.63, 74.52] 69.11 17.03 [63.73, 74.48]
4 weeks 73.19 21.19 [66.50, 79.88] 69.57 18.12 [63.85, 75.29]
Table 11: Correlation between self-efficacy and target behaviours at baseline SE-BFreq. SE-BLength SE-SitLess Break Freq. Break Length
Stand LIPA MIPA
SE-BFreq.
- .374** .347** -.576** .130 .198 .174 .204
SE-BLength
- .487** -.091 .329** .130 .258* .032
SE-SitLess
- -.093 .147 .125 .137 .123
Break
Freq.
- -.114 .079 .161 .064
Break
Length
- -.073 -.100 -.208
Stand - .665** .251*
LIPA - .195
MIPA -
Table 12: Correlation between self-efficacy and target behaviours at 6 weeks SE-BFreq. SE-BLength SE-SitLess Break Freq. Break Length
Stand LIPA MIPA
SE-BFreq.
- .478** .585** -.408** .310** .171 .157 .172
SE-BLength
- .637** -.367** .560** .163 .260* .251*
SE-SitLess
- -.398** .347** .219* .318** .336**
Break
Freq
- -.241* -.128 -.180 -.146
Break
Length
- -.089 .194 .323**
Stand - .693** .305**
LIPA - .396**
MIPA -
3
Discussion
The present study aimed to use text messages to increase (a) the frequency and length of breaks from sitting, (b) the amount of time spent standing, and (c) and the amount of time engaged in light and moderate intensity physical activity. The study also aimed to
increase self-efficacy for breaks and for reducing overall sitting time. The study included an intervention group and a control group. The intervention group received text messages twice a day for 6 weeks that offered tips, reminders, facts and challenges to decrease sitting and increase light and moderate physical activity. The control group received daily text messages, which consisted of random health facts. Both groups filled out
questionnaires at baseline, 2, 4, and 6 weeks. The questionnaires collected information on sitting time as well as standing, light intensity physical activity, moderate intensity physical activity, frequency and length of breaks from sitting, as well as three self-efficacy measures. Overall small to moderate effects that either approached or did not reach significance were found that consistently favored the text intervention group for all primary outcome behaviours. Irrespective of behaviour, the largest difference between treatment groups occurred at 6 weeks. Moderate to large effects that either approached or reached significance were also found consistently favoring the text intervention group for all self-efficacy constructs measured. Again, irrespective of self-efficacy measure, the largest difference between treatment conditions occurred at 6 weeks. Finally, significant relations were found when correspondence was high between the self-efficacious constructs and the primary outcome behaviours. Beyond these general observations the following specific issues warrant commentary.
Break Frequency and Length of Break from Sitting
Frequency of break from sitting increased by 23.05 minutes for the intervention group and only 8.41 minutes for the control group. This leaves a net difference of 14.64 minutes between groups, favouring the intervention group. Although this difference is not
been too difficult to track. Asking participants how long they typically sit before taking a break, represents a meaningful yet manageable estimate to make. Furthermore, measuring break frequency in this manner is in line with recommendations of getting people up and moving around every 30 to 60 minutes (Altenburg, et al., 2012; Healy et al., 2008).
Length of break from sitting increased by .78 minutes for the intervention group and by 0.19 minutes for the control group. This small non-significant increase is not surprising because the intervention was aiming at taking 3-6 minutes for every 30 minutes or 6-10 minutes every hour from sitting. The intervention group was above 6 minutes every hour, and thus behaving consistently with recommendations of previous research (Healy et al., 2008, Altenburg, et al., 2012).
Standing, Light and Moderate Physical Activity
The intervention group increased standing time by 18.25minutes per day and the controls decreased standing by 6.05 minutes per day. This resulted in a non-significant net
difference of 24.3 minutes per day favoring the intervention condition. The main focus of the text messages were replacing sitting with light to moderate physical activity rather than standing. Perhaps if more text messages had focused on increased standing per se, a larger net difference would have been shown.Time spent doing LIPA increased by 50.07 minutes/day for the intervention group and decreased by 24.27 minutes/day for the controls. This resulted in a net difference of 74.34 minutes per day that approached significance. With respect to time spent in moderate intensity physical activity, the intervention group had a larger increase with 91.22 minutes per week (13.03 minutes per day) compared to the control group who only increased by 21.44 minutes per week (3.06 minutes per day). This resulted in a net difference if 9.97 minutes per day favoring the intervention condition.
minutes/day after 6 months (De Greef, et al., 2011), and 39 minutes per day after 1 year (Koepp et al., 2013). The current study was able to increase LIPA by 50.07 minutes/day. One study that looked at standing and LIPA increase standing by 57 minutes/day and LIPA by 38 minutes/day for a total increase of 95 minutes after 9 months (John et al., 2011). The change seen in the current intervention had a combined increase in standing and PA of 81 minutes per day. Most studies focused on standing or LIPA; however, the study by Carr et al. (2013) also measured moderate intensity physical activity and found an increase of 8.8 minutes per day, a 2.2 minute increase in vigorous, along with an increase of 6.4 minutes of LIPA per day. The current study observed an increase of 13.03 minutes per day of moderate physical activity. Taken together, our findings provide evidence that text messaging as a way to increase standing, LIPA and MVPA is, for the most part, in line with other interventions. Failure for the net differences highlighted above to reach statistical significance is likely due to the variances of responses being widely dispersed around the means, and with the current sample size, left the analyses underpowered.
Taking more frequent and longer breaks from sitting means there should be an increase in non-sitting behaviours, and this is evident through the increase in time spent standing, and in light and moderate physical activity. To illustrate, during an 8-hour period of sitting, both groups would spend 39 minutes in breaks from sitting at baseline. At 6 weeks, the intervention group would spend an average of 60 minutes in breaks and the control group would spend an average of 45 minutes in breaks. The increase in frequency and length of time spent in breaks along with the increase in standing, LIPA and MIPA throughout the day may help explain what participants in this study are doing during their breaks. However the small and non-significant correlations found between breaks
(frequency and length) and behaviour (standing and LIPA) suggest that there is not a direct 1:1 displacement occurring here. A moderate size and significant correlation was only found between break length and engagement in MIPA. This discrepancy of
Self-efficacy
Confidence to sit less increased by 11.44% in the intervention group and by 6.31% in the control group. This net difference of 5.13% reached statistical significance. Confidence to take more frequent breaks increased in the intervention group by 7.74% and 4.34% in the control group. This net difference of 3.4% approached statistical significance. Confidence to increase length of breaks from sitting increased by 0.90% in the intervention group and decreased in the control group by 1.37%. This net difference 2.27% approached statistical significance. Overall, the net differences were small and favored the intervention group. The interaction effects were either significant or approaching significance and could be due to the variances of responses being tightly centered around the mean, and thus any change, regardless of how small, is being picked up as significant.
At baseline and at 6 weeks, confidence to take more frequent breaks predicted significant amounts of variance in reported breaks. Also, confidence to take longer breaks predicted significant amounts of variance in reported break length. Efficacy towards increasing frequency and length of breaks was able to explain less variance in reported standing, LIPA and MIPA. These findings underscore the importance of scale correspondence between the cognition matching the targeted behaviour. Confidence to sit less was unrelated to breaks, standing, LIPA, and MIPA at baseline. However at 6 weeks,
significant relationship emerged among these variables. This suggests that those who are more confident in being able to sit less will take longer and more frequent breaks, and spend more time standing, in LIPA and MIPA. It also could mean that those demonstrate these behaviours are more confident in sitting less. Future work should shed light on whether efficacious beliefs towards breaks and sitting less are antecedents or
consequences of sitting less behaviours. Future work might also focus on developing scales that measure efficacious beliefs towards standing as well as using existing scales that measure efficacious beliefs towards LIPA and MIPA (Dishman, 1994; Marcus, & Simkin, 1993; Nigg, & Courneya, 1998; Sallis, & Hovell 1990).
The current study had several strengths, one being the use of a randomized control trial, which allowed for any observed effects in the intervention group to be compared to a control group. Another strength was using an equal contact design where both groups received text messages daily, to determine whether it was the content of the text or if it was simply receiving a text/attention from the researcher that caused any change in behaviours. A third strength was that this study provided a novel use of text messages for targeting sedentary behaviour, as they have been used for many other health behaviours in the past but not for specifically reducing sitting time. A further strength was the use of targeted and tailored text messages for the intervention group, based on the findings of studies looking at the most effective construction of messages. Another strength was measuring breaks in terms of frequency (i.e., every 60 minutes) rather than in numbers (i.e., 20/day), which makes it possible to directly compare the results with current recommendations for breaks.
As for limitations, the main one was the use of a subjective self-report measure of sedentary behaviour. Although the Sedentary and Light Intensity Physical Activity Questionnaire has been shown to be a valid and reliable measure in the past, and received acceptable reliability in the current study, it was problematic. Many people
over-estimated how much time they spend doing various activities (which was shown when their days would add up to many more than 24 hours). This caused many data points to be extreme outliers and necessitated trimming them to a more reasonable value. The use of an objective measurement tool, such as an accelerometer, would allow for more accurate data as well as more valuable data. If the accelerometer was worn throughout the study, it would give an exact amount of time that was displaced from inactivity to other
behaviours. It would also allow for the researchers to observe if the participants were actually utilizing the prompts from the texts by checking the data at the time the texts were received. If a text was sent that told them to get up and move around for 5 minutes, the researchers could examine the accelerometer data at that time and see if the
Another limitation was the study being advertised as a way to reduce sedentary
behaviour, and thus participants in both groups self-selected into the study because they were highly motivated to change their behaviours. This may partially explain why large net differences were not found between intervention and control group participants.
A limitation for data analysis is the small sample size and therefore large variances (especially for the primary outcome variables) in the populations. Effects that may have been significant were washed out due to very high standard deviations around means, and these would be reduced with a larger sample size. In short, the study was underpowered for many of the positive effects favoring the intervention to reach statistical significance.
A further limitation is the length of the study. Text message studies for health behaviours have varied in length from 4 weeks to 1 year, with varying success for each length of study. The current study was 6 weeks in length, which may have limited the significance of the results, especially since the greatest differences between groups occurred at 6 weeks for all of the measures. If the study was longer there may have been stronger effects and findings may have become significant.
A final limitation is due to the design of the study. Each assessment time point was fairly long and likely contributed to participant loss due to the burden of filling out
questionnaires every two weeks. The feedback collected at the end of the 6 weeks included many comments on the difficulty of estimating the time spent doing various activities throughout the day, which is an issue that would also be removed with the use of an accelerometer.
Future Directions
spent working. Another use of this type of intervention could be with those who have been hospitalized for accidents or illnesses that cause them to become sedentary during their medical care. Once these patients are well enough to start being mobile again, they could possibly benefit from text reminders to help motivate them to move, and return to active habits. Any future replications of the present study may want to add a 2nd control group that receives no messages as both groups seemed to perform similarly, which may have been due to both groups receiving texts. A group that received no attention would help identify if the effect was due to receiving a text or the content of the messages.
Using messages similar to those from this intervention could be combined with existing technology to create other interventions that utilize fitness trackers, or smart-phone applications.
Conclusion
References
Adams, M.M., Davis, P.G., Gill, D.L. (2013). A hybrid online intervention for reducing sedentary behavior in obese women. Frontiers in Public Health, 1: 45.
Ainsworth, B.E., Haskell, W.L., Whitt, M.C., et al. (2000). Compendium of physical activities: an update of activity codes and MET intensities. Medicine & Science in Sports & Exercise, 32(9), S498–504.
Alkhajah, T.A., Reeves, M.M., Eakin, E.G., Winkler, E.A.H., Owen, N., Healy, G.N. (2012). Sit–stand workstations: a pilot intervention to reduce office sitting time.
American Journal of Preventive Medicine, 43, 298–303.
Altenburg, T.M., Rotteveel, J., Dunstan, D.W., Salmon, J., Chinapaw, M.J. (2013). The effect of interrupting prolonged sitting time with short, hourly, moderate intensity cycling bouts on cardiometabolic risk factors in healthy, young adults. Journal of Applied Physiology, 115, 1751–1756
Arbman, G., Axelson, O., Fredriksson, M., Nilsson, E., Sjodahl, R. (1993) Do
occupational factors influence the risk of colon and rectal cancer in different ways?
Cancer, 72(9), 2543–2459.
Arem, H., Irwin, M.L., Zhou, Y., et al. (2011). Physical activity and endometrial cancer in a population-based case-control study. Cancer Causes & Control, 22(2), 219– 226.
Bailey, D. P., & Locke, C. D. (2015). Breaking up prolonged sitting with light-intensity walking improves postprandial glycemia, but breaking up sitting with standing does not. Journal of Science and Medicine in Sport, 18(3), 294-298.
doi:http://dx.doi.org.proxy1.lib.uwo.ca/10.1016/j.jsams.2014.03.008
Bandura A (1997). Self-Efficacy: The Exercise of Control. New York, Freeman.