Application of the Random Coupling Model to Electromagnetic
Coupling Effect Analysis of Complex Double Cavity
Jie-Qing Fan, Ying Pan*, Jian-Hong Hao, and Heng-You Zhang
Abstract—For the difficulty of calculating and measuring coupling electromagnetic quantity of complex multi-cavities, a microwave chaotic double cavity model is designed, and a new method is put forward to analyze the coupling effect of the double cavities. The new method combines Random Coupling Model (RCM) and network cascade theory and can successfully predict the Probability Density Function (PDF) of the induced voltage at target point of the double cavity compared with other methods. Experiment is added to verify the effectiveness of the new method in this paper. In addition, the new method provides a new approach to analyze and predict the coupling electromagnetic quantity of the complex double cavities in practical engineering.
1. INTRODUCTION
With the improvement of the integration of electronics, function circuit modularization has become a popular trend in the design of modern electronic equipments. In practical engineering, circuit modules with relatively independent function are often placed in a small metal box and then coexist with other important circuits in a large metal shielding cavity [1]. Due to the existence of the small metal box, the large metal shielding cavity is often divided into several relatively independent spaces and exists in the form of a complex multi-cavity structure. This division will possibly affect the integral electromagnetic shielding effect of the total cavity and then cause the function failure and even destruction of the electronics inside the cavity due to the interference from external or internal electromagnetic wave. Under this real background, the research of electromagnetic coupling effect of a complex multiple shielding cavity structure should be the research hotpot at present [2–7].
The method of analyzing electromagnetic coupling effect of multi-cavity can be divided into two categories. One is certainty analysis method for a ruled cavity with a fixed internal field pattern [2, 3], and the other is statistical analysis method for complex cavities [4–6]. At present, the analysis of electromagnetic coupling effect of a ruled cavity is in the majority. The fast algorithm of shielding coefficient of double cavities is discussed by using transmission line equivalent method in [2]. The electromagnetic topology (BLT) method is used to research the electromagnetic coupling effect of ruled multi-cavity in [3]. In practical engineering, due to the interference of electromagnetic wave, the complex structure of a shielding cavity and the existence of electronic devices in the shielding cavity, the internal electromagnetic fields of the complex shielding cavity are always in wave chaotic state. Therefore, the certainty analysis method mentioned above is not suitable for the analysis and prediction of coupling electromagnetic quantity of complex cavities. In order to better solve the practical problem in engineering, [4] puts forward a new method which uses RCM to research the statistical properties of coupling electromagnetic quantity at target point of complex cavities. This literature gives out the expression describing the statistical properties of a lossy multi-port cavity. Ref. [5] chooses computer box as the research model and verifies the applicability of RCM in analyzing electromagnetic coupling
Received 12 October 2016, Accepted 30 December 2016, Scheduled 16 January 2017
* Corresponding author: Ying Pan ([email protected]).
effect of complex cavities by experimental method. Ref. [6] puts forward random topology method which combines RCM and BLT and chooses two computer boxes connected by a coaxial cable as experimental model to verify the applicability of this new method in analyzing system-level electromagnetic coupling effect. But there are still some limitations in the research of the mentioned literatures. Firstly, the shielding cavities model mentioned above include only two main categories, single cavity model or double cavity model connected by a coaxial cable. Secondly, in the process of analyzing electromagnetic coupling effect of double cavity model, the property of coaxial cable is simplified, so the solving accuracy declines. Thirdly, the internal complicated multi-spatial structure of shielding cavity has not been taken into account.
In practice, the complex shielding cavity often presents complicated multi-spatial characteristic, and this can be seen as a multi-cavity structure. The multi-cavity parameters are often difficult to measure directly, so its coupling electromagnetic quantity is difficult to analyze and predict too. In this paper, a new method combines RCM and BLT is put forward to analyze and predict the statistical distribution of induced voltage at target point of the multi-cavity. In order to verify its applicability, a double-cavity model and an experiment corresponding to it are designed. In the new method, cavity parameters can be gained by selecting a proper test plan or taking numerical simulation of the model when the parameters are not easy to measure. Then the new method can be used to calculate the coupling electromagnetic quantity at target point. The conclusion obtained in this paper can provide a new guidance for the determination and prediction of the coupling electromagnetic quantity of complex multi-cavities in engineering.
2. DOUBLE CAVITY MODEL AND THEORY ANALYSIS
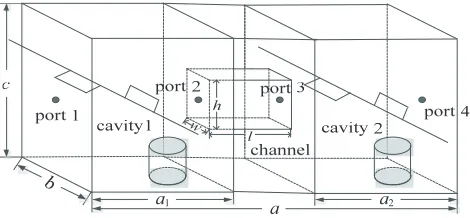
The geometry of the analytical model is shown in Figure 1. The dimension of the total cavity is
a×b×c. Due to the existence of metal boxes in the cavity, the total cavity is divided into two relatively independent cavities marked as cavity 1 and cavity 2, respectively. The two cavities are connected by a channel left by those metal boxes, which can be viewed as cavity 3. The dimensions of cavity 1 and cavity 2 are a1×b×c and a2 ×b×c, respectively. The dimension of the channel is l×w×h. Port 1, port 2, port 3 and port 4 are all equipped with SMA interfaces as the electric dipole antennas of radiating electromagnetic pulse into the cavity.
b
a
1
a a2
Figure 1. Two-cavity physical model.
Port 1 and port 4 are viewed as the entrance and the target point of the electromagnetic interference, respectively. Zcav is the cavity impedance parameters between port 1 and port 4. According to RCM, the induced voltage at the target point can be expressed as [4]
|V|=
2P(f)|Z21cav|2
Zcav 11
(1)
In Equation (1), P(f) is the power of the electromagnetic inference signal at port 1 and f the frequency of electromagnetic interference signal. Zcav can be calculated by
Zcav=Z0.5
In Equation (2), Scav is the cavity scattering parameters between port 1 and port 4. When Scav is not easy to measure, we can see the total cavity as a total network cascaded by three two-port sub-networks named cavity 1, channel and cavity 2. According to the network cascade theory, the scattering parameters S of the network cascaded by cavity 1 and the channel can be represented as
S =S11+S12(ε−S22)−1S21 (3)
In Equation (3), ε=[ 01 10 ] is called connection matrix. S11, S21, S12 and S22 are joint scattering matrices of the network cascaded by cavity 1 and the channel. Their expressions are
S11 =
Scav1
11 0
0 S11cav3
, S21 =
Scav1
21 0
0 S21cav3
,S12=
Scav1
12 0
0 Scav312
and S22 =
Scav1
22 0
0 S22cav3
,
respectively. In those expressions,Smncav1(m, n= 1,2) represent the scattering matrix elements of cavity 1, andSmncav3(m, n= 1,2) represent the scattering matrix elements of the channel. Similarly, the scattering parameters Scav of the total network can be expressed as
Scav =
S
11 0
0 Scav211
+
S
12 0
0 S12cav2 ε−
S
22 0
0 S22cav2
−1 S
21 0
0 S21cav2
(4)
In Equation (4),Scav2
mn (m, n = 1,2) are the scattering matrix elements of cavity 2. εhas the same meaning as in Equation (3).
In Figure 1, the dimensions of cavity 1 and cavity 2 are relatively large, and there are always many electronic devices in them. This will lead to the generation of a large number of field models in the cavities, hence cavity 1 and cavity 2 can be regarded as two independent wave chaotic cavities, respectively. On the contrary, the dimension of the channel is relatively small. Its internal structure is relatively ruled and single. Its function is just providing a channel for transmitting electromagnetic interference signals between cavity 1 and cavity 2. According to the above analysis, we choose RCM to calculate Smncav1(m, n = 1,2) in Equation (3) and Smncav2(m, n = 1,2) in Equation (4) and experimental method to gain the scattering parameter Smncav3(m, n = 1,2) of the channel. According to [7], cavity 1 and cavity 2 can be regarded as a two-hole lossy metal cavity model, and the scattering parameterScav1 of cavity 1 can be expressed as
Scav1=Z0.5
0 Zcav1Z00.5−I
Z0.5
0 Zcav1Z00.5+I (5)
In Equation (5), Zcav1 is the cavity impendence parameter of cavity 1. Z0 is the characteristic impedance of port 1 and port 2 which is valued as 50 Ω considering port matching. According to RCM
Zcav1=jImZrad1+ReZrad10.5ZRCM norm1
Re
Zrad10.5 (6)
In Equation (6), cavity radiation impedanceZrad1 can be expressed as
Zrad1=Z0.5 0
I+Srad1 I−Srad1
−1
Z0.5
0 (7)
In Equation (7), Srad1 is the radiation scattering parameter of cavity 1. According to RCM, the normalized impedance matrixZnorm1RCM of the two-hole lossy metal cavity model can be expressed as
ZRCM
norm1=−
j
πW
1
λ−jα1IW
T (8)
In Equation (8), W is the coupling matrix with the dimension of 2×M, and its elements obey the independent Gaussian distribution of which the mean is 0 and the variance 1. W characterizes the coupling between incentive holes and eigen modes. λis the diagonal matrix with the dimension of
M×M, and its elements obey Wigne’s Semi-Circle Law [8]. α1 is the cavity loss factor of cavity 1. I is the unit matrix with the dimension of M×M.
The cavity loss factorα1 can be expressed as [3]
α1= 1
πσ2 1
In Equation (9), σ12 is the variance of any eigenvalue of the normalized impendence Znorm1 which is calculated by the experimental test data or simulation data of cavity 1. The normalized impendence
Znorm1 of cavity 1 can be expressed as
Znorm1=
Re
Zrad1−1/2Zcav1−jImZrad1 ReZrad1−1/2 (10)
In Equation (10), Zrad1 can be gained by Equation (7) mentioned above, andZcav1 can be gained by the equation with a similar form to Equation (7) which is expressed as follows
Zcav1=Z1/2 0
I+Scav1 I −Scav1 −1Z01/2 (11) Similarly, the scattering parameter of cavity 2 can be gained by RCM too. Then we join the scattering parameters of the channel gained by experiment with the scattering parameters of cavity 1 and cavity 2 and substitute them into Formulas (4) and (5) in turn. By combination of Formulas (1) to (3), the induced voltage at target point of the shielding cavity can be obtained.
The calculation needs to be repeated many times because parameters Scav and Srad are large ensembles within a frequency band for different configurations. Then a number of induced voltages|V| at target point will be gained, and its PDF can be computed. The concrete operation can be seen in part 3 as a reference.
3. EXPERIMENTAL VERIFICATION AND ANALYSIS
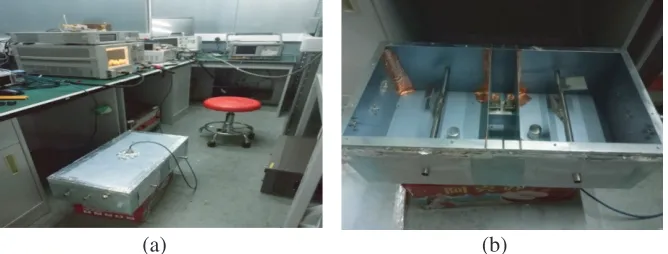
Corresponding to the model in Figure 1, a double metal shielding cavity is established. Its total dimension a × b × c is 660 mm × 300 mm × 180 mm. The dimension a1 ×b × c of cavity 1 is 300 mm×300 mm×180 mm. The dimension a2×b×c of cavity 2 is 300 mm×300 mm×180 mm. The dimension l×w×h of channel is 60 mm×45 mm×45 mm. In order to create the wave chaotic condition in cavity, we put a small cylinder and a mode stirrer (see in Figure 1) in cavity 1 and cavity 2, respectively. The diameter and height of the small cylinder are both 30 mm. The blade of the mode stirrer is 60 mm long and 50 mm wide. Port 1, port 2, port 3 and port 4 are all equipped with SMA interfaces. On each interface, a copper wire with length of 5 cm is welded, as the antenna of radiating and receiving electromagnetic wave.
An experimental test platform is established as shown in Figure 2. In the experiment, we obtain 15001 points data which distributes equally in frequency range of 1∼ 18 GHz. Under each frequency point, we rotate the mode stirrer to 72 different positions to construct different internal electromagnetic field modes and then use the Agilent N5242A vector network analyzer to measure the ensemble of the scattering matricesScav(15001×72) and the radiation scattering matrices Srad(15001×72) of cavity 1, cavity 2 and channel.
In this paper, we use RCM to gain the scattering parameters of cavity 1 and cavity 2, hence the wave chaotic property of the two cavities should be confirmed. In the case of cavity 1, we process its data within 13∼14 GHz. Figure 3 and Figure 4 are the Dyson round ensemble chart and intrinsic phase
(a) (b)
distribution chart of the eigenvalues of the normalized scattering matrix, respectively. The eigenvalues of the normalized scattering matrix are represented by λs. It can be shown in Figure 3 and Figure 4 that cavity 1 meets the Dyson round condition and has the wave chaotic property. Similarly, the same situation of cavity 2 can be determined too. Thus the scattering parameters of cavity 1 and cavity 2 can be obtained by RCM.
We view terminal port 4 of cavity 2 in Figure 1 as the target point and calculate its induced voltage
-0.05 0.00 0.05 0.00
0.02 0.04 0.06
Re(λs) -0.02
-0.04
-0.06
Im(
λ
s)
Figure 3. The distribution of the real part and the imaginary part ofλs.
-3 -2 -1 0 1 2 3
θ
0.25
0.20
0.15
0.10
0.05
0.00
P(
θ
)
Figure 4. The distribution of intrinsic phase.
0 2 4 6 8
0.0 0.5 1.0 1.5 2.0 2.5 3.0
P
(|V
|)
|V|/V
RCM and network cascade theory Electric network theory Experimental
0.0 0.5 1.0 1.5 2.0
0 1 2 3 4 5
P
(|V
|)
|V|/V
RCM and network cascade theory Electric network theory Experimental
0.0 0.2 0.4 0.6 0.8 1.0
0 1 2 3 4 5 6 7
P(|V|)
|V|/V
RCM and network cascade theory Electric network theory Experimental
(a) (b)
(c)
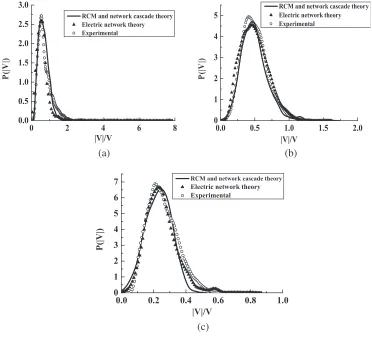
in 2∼3 GHz, 8∼9 GHz and 13∼14 GHz, respectively. PDFs of the induced voltages in those different frequency bands are as shown in Figure 5.
From Figure 5 we can see that the PDFs of induced voltages calculated by new method combining RCM and network cascade theory, electric network theory and experimentally total scattering parameter are in good agreement, which proves the effectiveness of the new method proposed in this paper.
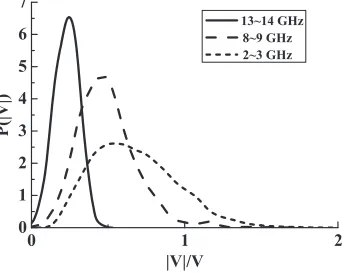
Figure 6 shows the comparison of PDFs of induced voltages at target point in different frequency bands. It can be shown that with the increase of frequency, the peak of the induced voltage rises and shifts to the left. The reason can be explained as follows: the loss factor of cavity will increase with the growth of frequency, which means that the loss of electromagnetic wave coupling into the cavities increases; therefore, the probability of the induced voltage with large amplitude decreases.
0 1 2 0
1 2 3 4 5 6 7
P(|V|)
|V|/V
13~14 GHz
8~9 GHz
2~3 GHz
Figure 6. PDF of induced voltages during different frequency ranges.
In practical engineering, the scattering parameters of multi-cavities can be gained by following methods. 1) The total scattering parameters of multi-cavity can be measured directly when they are easy to measure. 2) When the total scattering parameters of multi-cavity are difficult to measure, we can measure the scattering parameters of each part of it respectively and then use network cascade theory to calculate the total scattering parameters. 3) When the scattering parameters of both the multi-cavity and each part of it are difficult to measure, the loss factor of each independently single multi-cavity can be obtained by numerical simulation, and then RCM should be used to calculate the scattering parameters. The scattering parameters of channel can be obtained by numerical simulation. Then the total scattering parameters can be calculated by network cascade theory.
4. CONCLUSION
In this paper, a new method combining RCM and network cascade theory is proposed in order to predict the coupling electromagnetic quantity at target point of the complex multi-cavities. A double-cavity model is established, and the corresponding experiment is carried out in order to prove the effectiveness of the new method. The results show that the new method can predict the induced voltage at target point relatively accurately. It is worth noting that the new method is only applicable to the electrically large wave chaotic cavity because of the limitations of RCM. In practical engineering, the parameters of complex multi-cavities can be gained either by choosing proper test plan according to different situations or by using the new method combined with numerical simulation. Then the coupling electromagnetic quantity at target point can be gained further. The conclusions obtained in this paper can provide a new reference for the electromagnetic coupling effect evaluation of a complex multi-cavity structure.
ACKNOWLEDGMENT
REFERENCES
1. Fan, J.-Q., J.-H. Hao, Y.-F. Gong, L.-H. Jiang, W.-Q. Yang, and B.-G. Zhang, “Shielding effectiveness of apertured cavity with obstacles,” High Voltage Engineering, Vol. 41, No. 12, 4198– 4206, 2015.
2. Luo, J.-W., P.-A. Du, D. Ren, and P. Xiao, “BLT equation-based approach for calculating shielding effectiveness of double layer rectangular enclosures with apertures,”High Power Laser and Particle Beans, Vol. 27, No. 11, 113201, 2015.
3. Kan, Y., L.-P. Yan, X. Zhao, H.-J. Zhou, Q. Liu, and K.-M. Huang, “Electromagnetic topology based fast algorithm for shielding effectiveness estimation of multiple enclosures with apertures,” Acat Physica Sinica, Vol. 65, No. 3, 030702, 2016.
4. Zheng, X., T. M. Antonsen, and E. Ott, “Statistics of impedance and scattering matrices of chaotic microwave cavities with multiple ports,”Electromagnetics, Vol. 26, No. 1, 37–55, 2006.
5. Hemmady, S., J. T. M. Antonsen, E. Ott, and S. M. Anlage, “Statistical prediction and measurement of induced voltages on components within complicated enclosures: A wave-chaotic approach,”IEEE Trans. on Electromagnetic Compatibility, Vol. 54, No. 4, 758–771, 2012.
6. Li, X., C. Meng, Y.-N. Liu, and S. D. Hemmady, “Experimental verification of a stochastic topology approach for high-power microwave effects,” IEEE Transactions on Electronic Compatibility, Vol. 57, No. 3, 1–6, 2015.
7. Yan, E.-Y., F.-B. Meng, and H.-G. Ma, “Application of random coupling model to high power microwave effects,” High Power Laser and Particle Beams, Vol. 22, No. 3, 621–624, 2010.