Scholarship@Western
Scholarship@Western
Electronic Thesis and Dissertation Repository
12-9-2016 12:00 AM
An Evaluation of the Lithologies and Geochemistry of the Upper
An Evaluation of the Lithologies and Geochemistry of the Upper
Beaver Deposit of the Kirkland Lake Area
Beaver Deposit of the Kirkland Lake Area
Katherine E. Feick
The University of Western Ontario
Supervisor Dr. Robert Linnen
The University of Western Ontario Graduate Program in Geology
A thesis submitted in partial fulfillment of the requirements for the degree in Master of Science © Katherine E. Feick 2016
Follow this and additional works at: https://ir.lib.uwo.ca/etd
Part of the Geochemistry Commons, and the Geology Commons
Recommended Citation Recommended Citation
Feick, Katherine E., "An Evaluation of the Lithologies and Geochemistry of the Upper Beaver Deposit of the Kirkland Lake Area" (2016). Electronic Thesis and Dissertation Repository. 4336.
https://ir.lib.uwo.ca/etd/4336
This Dissertation/Thesis is brought to you for free and open access by Scholarship@Western. It has been accepted for inclusion in Electronic Thesis and Dissertation Repository by an authorized administrator of
The Upper Beaver Cu-Au deposit contains a unique style of mineralization in the Larder
Lake and Kirkland Lake areas in terms of mineralization, alteration style, and age. This study
aims to use company-provided data, supplemented with focused data collection, to evaluate
what information can be attained from company-provided geochemical data. The evaluation
uses a combination of hand sample, petrographic, geochemical, statistical, and microprobe
analytical methods.
Lithogeochemical analyses indicated that the altered igneous host rock is calc-alkaline in
composition and is most likely part of the diorite-monzonite suite. Further, exploratory data
analysis of Au and Cu mineralization identified that there are two distinct styles of
mineralization in the deposit, including: (1) a Cu-rich style of mineralization and (2) a
Mo-rich style. SR-XRF trace element mapping shows that the two styles of mineralization also
differ at the microscopic scale.
Keywords
ii
Acknowledgments
I would like to take this opportunity to thank my thesis supervisor Dr. Robert Linnen for his
support and expertise. I would also like to say thank you to everyone at Canadian Malartic
Corporation who took me in during two co-op terms during my Undergraduate degree and
turned me into a real geologist. I learned so much during those 8 months about core logging,
field mapping, and data entry. Your continued guidance and support during my studies has
been invaluable. It has been a privilege to have had the opportunity to work with you. A
special thank you to Mark Masson, Christal Hanuszczak, Chris Clarke, Chantel Skanes, and
Mike Fell for their extensive support and guidance as well as their friendship. Thank you as
well to all the friends that I have made over the past two years, especially Liana Stammers
and Jessica Stromberg, who I worked closely with during trips to the synchrotron,
conferences, and groups meetings.
Thank you to Marc Beauchamp who assisted with microprobe data collection at the
University of Western Ontario. I also would like to thank Robert Gordon and Zou Finfrock
from Sector 20-ID for their time, support, and expertise during data collection at Advanced
Light Source. Research described in this work was also collected at Sector 20-ID-B at
Advanced Photon Source (APS) of Argonne National Labs. Sector 20 facilities at the
Advanced Photon Source, and research at these facilities, are supported by the US
Department of Energy - Basic Energy Sciences, the Canadian Light Source and its funding
partners, the University of Washington, and the Advanced Photon Source. Use of the
Advanced Photon Source, an Office of Science User Facility operated for the U.S.
Department of Energy (DOE) Office of Science by Argonne National Laboratory, was
supported by the U.S. DOE under Contract No. DE-AC02-06CH11357. Research described
in this work was also performed at the Canadian Light Source, which is supported by the
Natural Sciences and Engineering Research Council of Canada, the National Research
Council Canada, the Canadian Institutes of Health Research, the Province of Saskatchewan,
Western Economic Diversification Canada, and the University of Saskatchewan. I would
especially like to thank Lisa Van Loon and Erika Bergen from the Canadian Light Source for
their expertise, assistance with data collection, interpretation, and helpful suggestions, and
for their friendship while performing analysis at both the Advanced Light Source and the
iii
Foundation and the National Institutes of Health/National Institute of General Medical
Sciences under NSF award DMR-1332208. Arthur Woll and Louisa Smieska were essential
in data collection and GeoPIXE analysis. Their help and support both at CHESS and in all
communications regarding data analysis after data was collected was instrumental to data
interpretation. CLS also provided a Graduate Student/ Post-Doc Travel Support grant for
iv
Table of Contents
Abstract ... i
Acknowledgments... ii
Table of Contents ... iv
List of Tables ... viii
List of Figures ... x
List of Appendices ... xviii
1 Chapter 1: Introduction and Background ... 1
1.1 Mining in Kirkland Lake ... 1
1.2 Regional Geology ... 2
1.3 Introduction to the Project ... 5
1.4 Objectives ... 7
1.5 Previous Work ... 8
1.6 Deposit Geology ... 11
1.7 Structural Geology ... 17
1.8 Mineralization ... 18
1.8.1 Au Mineralization ... 19
1.8.2 Cu Mineralization ... 21
1.9 Timing of Mineralization ... 21
1.10 Intrusions and mineralization ... 22
1.11 Alteration ... 24
2 Chapter 2 Methods ... 28
2.1 Petrography and Hand Sample Analysis ... 28
2.2 Geochemical Data Sets ... 30
v
2.2.3 Past Thesis Datasets ... 36
2.2.4 Datasets produced for this thesis... 37
2.2.5 Data Processing ... 39
2.2.6 Exploratory Data Analysis (EDA) ... 42
2.3 Spatial Modeling ... 44
2.4 Microprobe Analysis ... 45
2.5 Synchrotron Source X-ray Fluorescence Microprobe Analysis ... 45
2.5.1 Synchrotron applications in the Earth Sciences ... 46
2.5.2 What is a Synchrotron? ... 46
2.5.3 An Introduction to Hard X-Ray Synchrotron Imaging Techniques... 48
2.5.4 Data collection at Advanced Photon Source ... 48
2.5.5 Data Collection at Cornell High Energy Synchrotron Source ... 49
2.5.6 Data Collection at Canadian Light Source... 52
2.5.7 Data Processing: GeoPIXE ... 52
2.5.8 Element Identification ... 53
3 A Detailed Assessment of Host Rocks of the Upper Beaver Au-Cu Deposit ... 56
3.1 Introduction ... 56
3.1.1 Deposit Geology ... 57
3.1.2 Lithologies in the Upper Beaver Intrusive Complex ... 60
3.1.3 Link between Intrusions and Mineralization in the Upper Beaver Deposit 64 3.2 Geochemical Analysis of Intrusions ... 65
3.2.1 Available Data ... 65
3.2.2 Magma Series... 65
vi
3.2.5 Correlations between Mineralization and Host Rock Lithology ... 80
3.2.6 Less Common Intrusives... 84
3.2.7 Sedimentary Sequence ... 99
3.2.8 Breccia Pipe ... 113
4 A Detailed Assessment of Trace Element Geochemistry of the Upper Beaver Deposit and An Evaluation of Exploration Vectors for Mineralization ... 119
4.1 Hand Sample Observations ... 119
4.2 Mineralized Zones ... 120
4.2.1 Zones on the South Side of the Intrusive Complex ... 121
4.2.2 Zones on the North Side of the Intrusive Complex ... 131
4.2.3 Petrography ... 135
4.2.4 CMC-Provided Geochemical Database ... 139
4.2.5 Correlations among Upper Beaver Mineralized Zones ... 145
4.2.6 Multivariate EDA... 150
4.2.7 Link between Alteration and Mineralization ... 162
4.2.8 Surface Geochemistry Survey... 167
5 Synchrotron source X-ray Fluorescence Microprobe Analysis of Mineralized Thin Sections from the Upper Beaver Deposit ... 175
5.1 Introduction ... 175
5.2 Results ... 175
5.2.1 Ore Minerals in the Upper Beaver deposit ... 175
5.2.2 Thin Section Selection ... 176
5.2.3 Mapping at 13.1 and 30.1 keV ... 177
5.2.4 Mapping at different synchrotrons and the effect of step size ... 178
vii
and Ilmenite ... 195
5.2.7 Au:Ag Ratio ... 201
6 Discussion ... 204
6.1 Geochemical analysis of intrusions ... 204
6.1.1 Evaluation of names ... 207
6.1.2 Interpretation of Less Common Intrusives in the Upper Beaver Intrusive Complex ... 209
6.1.3 Key Characteristics of Sedimentary Sequence and Breccia Lens ... 214
6.2 Association Between Host rocks and Mineralization ... 217
6.3 Geochemistry of Mineralization ... 220
6.3.1 Revised Styles of Mineralization ... 223
6.4 Relationship to Large-Scale Geochemical Trends Among Abitibi Gold Deposits 227 7 Conclusions ... 229
viii
List of Tables
Table 1.1. Indicated and inferred mineral resources for CMC’s five NI43-101 compliant
properties... 6
Table 2.1 Lab and method detection limits for the Upper Beaver geochemical database ... 31
Table 2.2. Detection limits for mineralized dataset ... 37
Table 2.3. Detection limits for major oxide dataset ... 38
Table 2.4. Elements of interest and their corresponding energy and ROIs for trace element XRF maps acquired at APS. E1 represents the lower limit of the energy peak, while E2 represents the upper limit. ... 49
Table 2.5. Characteristic emission lines of select trace elements. Energies highlighted in red were measured during data acquisition at 13.1 KeV, while energies highlighted in blue were measured during data acquisition at higher energies. Energies from “X-ray Data Booklet” . 54 Table 3.1. REE element concentration in samples of mafic syenite, mafic syenite porphyry, crowded syenite, and feldspar porphyry using partial digestion and whole digestion data .... 73
Table 3.2. Available data on the age and lithology of local intrusions ... 75
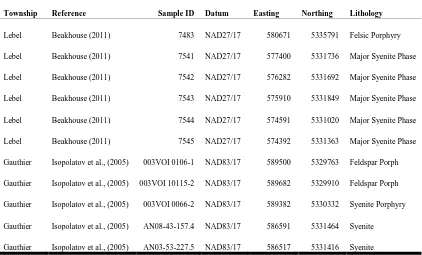
Table 3.3. Information on available published data of local intrusions including where samples are from and the lithologies analyzed ... 77
Table 3.4. Published REE concentrations for local intrusions. Sample IDs correspond to those in Table 7 ... 77
Table 3.5. Summary of the large assay database provided by Canadian Malartic Corporation showing the number of samples, the mean Au grade, and the mean Cu for each lithology after samples without a specific lithology were removed. Concentration of Au greater than 10 g/t with more than 2% of all samples analyzed >2g/t have been bolded ... 81
ix
East = “LPE”, Upper Porphyry East = “UPE”, Lower Porphyry West = “LPW”, Upper Porphyry West = “UPW”, and North Contact = “NC”), in the Upper Beaver deposit ... 146
Table 4.4. Pearson Correlations between trace elements used in Principal Component
Analysis of data from the Upper Beaver deposit ... 157
Table 4.5. Eigenvectors showing the relationship between principal components and trace
elements ... 157
Table 4.6. Eigenvalues, percent, and cumulative percent for each principal component ... 158
Table 4.7. Scaled coordinates showing the relationship between each principal component
and trace element ... 158
Table 4.8. Spearman Rank Correlation coefficients for entire CMC land package ... 168
Table 5.1. Summary of samples analyzed including zone each sample is from, lithology,
mineralization style (chalcopyrite = “Cpy”, magnetite = “Mgt”, pyrite = “Py”, visible gold = “VG”), host mineralization, and Au and Cu assays for each sample ... 176
Table 5.2. Synchrotron source x-ray fluorescence microprobe analysis showing the presence
of Bi, W, and Te phases associated with Au mineralization and trace element zoning in pyrite
and chalcopyrite grains in each zone in the deposit ... 196
Table 5.3. Synchrotron source x-ray fluorescence microprobe analysis showing the type of
Au mineralization and the average Au/Ag ratio in each zone in the deposit. Data from energy
scans run at 30.1 keV. ... 202
Table 5.4. Summary of where each of the main lithologies in the Upper Beaver Intrusive
Complex plots on various classification diagrams and proposed names for each rock based on
x
List of Figures
Figure 1.1. Location of the Upper Beaver property. ... 2
Figure 1.2. Regional geology of the Kirkland Lake and Larder-Lake areas ... 4
Figure 1.3. Simplified surface geology of the Upper Beaver Property ... 12
Figure 1.4. Geological model showing major lithological units in the Upper Beaver deposit looking West ... 13
Figure 1.5. Modified composite cross section of mineralized zones in the Upper Beaver deposit in relation to the major lithological units ... 14
Figure 1.6. Alteration and mineralization history of the Upper Beaver deposit divided into three main stages of alteration ... 25
Figure 2.1. The Olympus BX51 microscope with attached Olympus UC30 high resolution digital camera used for petrographic observation ... 30
Figure 2.2. Percentile box plot showing the distribution of Ni in the deposit among main lithologies as an example of the effects of levelling geochemical data by rock type ... 41
Figure 2.3. Setup of samples analyzed at CHESS in November, 2015 ... 51
Figure 3.1. Representative photos of the Blake River Group basalts ... 58
Figure 3.2. Representative lithologies in the Upper Beaver Deposit ... 58
Figure 3.3. Representative lithologies and contacts of the Upper Beaver Intrusive Complex 62 Figure 3.4. Representative photos of A) Feldspar porphyry; B) Spotted Feldspar Porphyry, C) Fine-grained diabase and D) Medium-grained diabase ... 63
xi
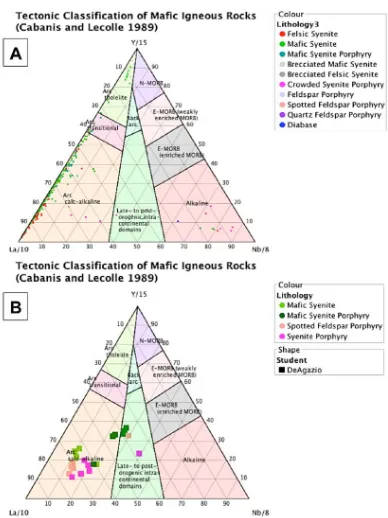
classification of select intrusive rocks from the Upper Beaver Intrusive Complex ... 69
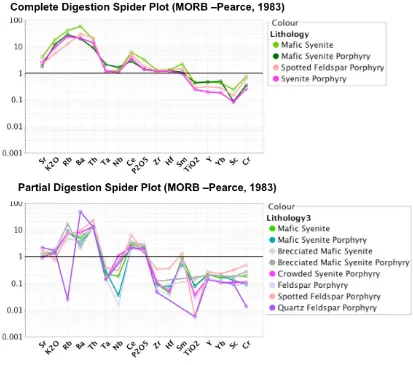
Figure 3.7. MORB-normalized spider diagram based on Pearce (1983) showing the REE signature of select intrusions from the Upper Beaver Intrusive Complex ... 71
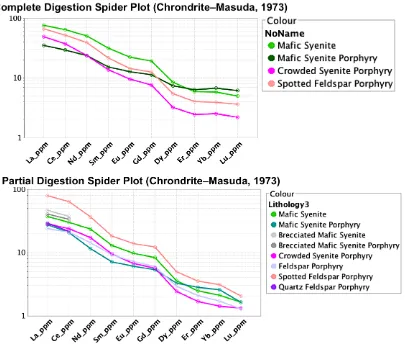
Figure 3.8. Chrondrite-normalized spider diagram based on Masuda et al. (1973) showing the REE signature of select intrusions from the Upper Beaver Intrusive Complex ... 72
Figure 3.9. MORB-normalized spider diagram based on Pearce (1983) for members of the Upper Beaver Intrusive Complex and for intrusions in Gauthier and Lebel as identified ... 79
Figure 3.10. Chrondrite-normalized spider diagram based on Masuda et al., (1973) for members of the Upper Beaver Intrusive Complex and for intrusions in Gauthier and Lebel as identified ... 80
Figure 3.11. Percentile box plots showing the distribution of Au and Cu in the deposit among the main lithologies ... 83
Figure 3.12. Unusual lithologies in the Upper Beaver deposit. ... 84
Figure 3.13. Percentile box plots showing the distribution of WDS electron microprobe ... 86
Figure 3.14. Classification of calcic amphiboles ... 87
Figure 3.15. A) Amphibole pseudomorph after amphibole in sample UWO_2015_27 showing characteristic two cleavages at 60 and 120 degrees; B) Relict dark rim surrounding completely pseudomorphed grain ... 88
Figure 3.16. Electron photograph showing of mineral phases identified in the opaque rim of a pseudomorphed amphibole ... 89
Figure 3.17. Backscatter image showing of mineral phases identified in the groundmass of UWO_2015_27. ... 90
xii
grain in UWO_2015_26. ... 93
Figure 3.20. Backscatter image showing the mineral phases in UWO_2015_26 as identified through EDS microprobe analysis ... 94
Figure 3.21. Representative photos of Amphibole-rich intrusive ... 95
Figure 3.22. A) Representative hand-sample photo of biotite-rich intrusive ... 97
Figure 3.23. Backscatter image showing the mineral phases in UWO_2015_48 ... 98
Figure 3.24. Backscatter image showing the mineral phases in UWO_2015_48 as identified through microprobe EDS analysis ... 99
Figure 3.25. Composite cross section of Au mineralization (red zones) in the Upper Beaver deposit in relation to crowded syenite porphyry dikes and the isolated sedimentary sequence (orange) in the Upper Beaver deposit. ... 100
Figure 3.26 Summary of alteration intensity in UB11_192 based on hand-sample observations ... 102
Figure 3.27. Sedimentary rocks from the isolated sedimentary sequence ... 103
Figure 3.28. Wavy deformed beds in graphitic sedimentary rocks ... 104
Figure 3.29. Photomicrographs of sample UWO_2015_30 showing abundant greenish brown pseudomorphs within a fine-grained quartz-rich matrix. ... 106
Figure 3.30. Photomicrographs of sample UWO_2015_30 showing close-up of green pseudomorph. ... 106
Figure 3.31. Backscatter image showing the mineral phases identified in the groundmass of UWO_2015_30 ... 107
xiii
overlying / underlying cherty sedimentary rocks as observed on site. ... 109
Figure 3.34. Complex intercalated boundary between conglomerate and silty arenite ... 110
Figure 3.35. Diffuse lower cherty sediment contact in UB_11_190 at 389 m. ... 111
Figure 3.36. A,B) Cross polarized light photomicrographs of plagioclase and quartz
phenocrysts within a fine-grained groundmass in volcaniclastic rocks sample
UWO_2015_25; C) Cross polarized light photomicrograph of the edge of a large clast in
volcaniclastic rocks unit in UWO_2015_29; D) Photo of typical volcaniclastic rocks unit
showing abundant clasts of cherty sedimentary rocks ... 112
Figure 3.37. Pictures of representative breccias from the Upper Beaver deposit ... 114
Figure 3.38. Two least brecciated samples collected. ... 115
Figure 3.39. Petrographic photomicrograph showing cross cutting relationships between
chalcopyrite, hematite and magnetite. ... 116
Figure 3.40. Geochemical analysis of brecciated samples from this project compared to
available data for relatively unaltered associated igneous intrusions from past projects ... 117
Figure 3.41. Alteration box plot based on the Ishikawa alteration index (AI) and
Chlorite-carbonate-pyrite index (CCPI) showing expected mineralogical changes associated with
brecciation ... 118
Figure 4.10. Reflected light photo showing the overprinting relationship between
chalcopyrite (Cpy), hematite (Hem), and magnetite (Mgt) ... 123
Figure 4.11. Representative reflected light photomicrographs of mineralization in analyzed
thin sections. ... 137
Figure 4.12. Representative reflected light photomicrographs of gold mineralization in the
xiv
looking West ... 141
Figure 4.14. Leapfrog model showing the distribution of Cu in the Upper Beaver deposit
looking West. ... 142
Figure 4.15. Percentile box plots showing the distribution of select trace elements in the
deposit arranged by increasing gold grade (10 equal ranges). ... 145
Figure 4.16. Histogram showing the variation in host rock among and within each
mineralized zone in the Upper Beaver deposit. ... 147
Figure 4.17. (Top) Bivariate Au vs. Ag plot showing the two trends (Ag-rich i.e., Ag ≥
0.001) and Ag-poor i.e., Ag ≤ 0.001) and (Bottom) percentile box plots showing the
distribution of select trace elements in each trend. ... 148
Figure 4.18. Relationship between Au, Cu, Mo, and Ag in select zones in the Upper Beaver
Deposit colored by mineralized zone. ... 149
Figure 4.19. Percentile box plots showing the distribution of select trace elements within in
each cluster group ... 152
Figure 4.20. Au vs. Cu relationship in the Upper Beaver Deposit with colours indicating the
respective cluster of each data point ... 154
Figure 4.21. Distribution of K-Means clusters in the Upper Beaver deposit looking East .. 155
Figure 4.22. PC1 vs. PC2 for the PCA completed on log leveled (by lithology) Au, Cu, S,
Ag, Bi, Mo, Ni, Sb, Se, Te, and W. ... 159
Figure 4.23. PC1 vs. PC3 for the PCA completed on log leveled (by lithology) Au, Cu, S,
Ag, Bi, Mo, Ni, Sb, Se, Te, and W ... 160
Figure 4.24. Binary plots showing the relationships between PC1, PC2, and PC3 ... 161
Figure 4.25. Alteration and mineralization history of the Upper Beaver deposit divided into
xv
carbonate-pyrite index (CCPI) showing expected mineralogical changes associated with
various mineralized samples based on geochemical analysis of samples for this project. ... 164
Figure 4.27. Mean (circle) and median (line) values for Au, Cu, Ag, and Mo based on whether samples are noted to contain different types of alteration minerals. ... 167
Figure 4.28. Map highlighting elevated amounts of Au on the Canadian Malartic Corporation property, as identified from the 2013 rock chip survey ... 170
Figure 4.29. Simplified surface geology of the Upper Beaver Property showing significant major lithological units and local faults, and other surface features of importance ... 171
Figure 4.30. Gridded maps for select trace elements identifying anomalous surface geochemical signatures for the Upper Beaver Deposit ... 172
Figure 4.31. Gridded maps for major oxides identifying anomalous surface geochemical signatures for the Upper Beaver Deposit ... 173
Figure 5.1. Maps and associated spectra for Fe Kα (top) and Ca Kα (middle) at 30.1 keV and 13.1 keV ... 178
Figure 5.2. (left) RGB image produced for UWO_2015_10 where R=Fe Kα, G=Cu Kα, and B=Au Lα. (right) reflected light photo micrograph showing pyrite (py) grain of interest ... 180
Figure 5.3. RGB image of Au-bearing pyrite grain from UWO_2015_10 where R=Fe Kα, G=Cu Kα, and B=As Kα. ... 181
Figure 5.4. Isolated pyrite grain of interest from UWO_2015_10 mapped at CHESS ... 182
Figure 5.5. Isolated pyrite grain of interest from UWO_2015_10 mapped at APS ... 183
Figure 5.6. Trace element maps of UWO_2015_10 ... 186
xvi
UWO_2015_05 ... 188
Figure 5.9. Energy map showing the distribution of Fe Kα, Cu Kα, and Au Lα in the RGB
image on the top left as well as individual energy maps for Fe Kα, Cu Kα, Au Lα, As Kα,
and Ni ... 189
Figure 5.10. RGB image produced by XRF mapping at CHESS showing the distribution of
Mo Kα, Fe Kα, and Au Lα in UWO_2015_08 ... 190
Figure 5.11. RGB image showing the distribution of Fe Kα, Co Kα, and Au Lα in
UWO_2015_02 ... 192
Figure 5.12. (upper) Photomicrograph of Ni-rich pyrite grain in sample UWO_2015_04. Au
mineralization is observable in may fine fractures in the grain. (lower) SR-XRF energy maps
of zoned pyrite grains from UWO_2015_04 ... 193
Figure 5.13. Trace element XRF maps of Au Lα, As Kα, Fe Kα, and Ni Kα in
UWO_2015_04 ... 194
Figure 5.14. (top) Trace element SR-XRF maps of various elements (Au Lα; As Kα; Co Kα;
Cu Kα; Fe Kα; and Ni Kα) (Bottom) corresponding photomicrograph of pyrite grain
analyzed by SR-XRF ... 195
Figure 5.15. A) RGB image showing the distribution of Fe Kα, Bi Lα, and Au Kα in
UWO_2015_02 ... 197
Figure 5.16. (A) Photomicrograph of mineralized pyrite grain surrounded by chalcopyrite in
KF15 ... 198
Figure 5.17. RGB image showing the distribution of Fe, W, and Cu in UWO_2015_10 .... 199
Figure 5.18. (Top) SR-XRF energy maps of KF15 ... 200
Figure 5.19 XRF trace element map showing a Au hot spot with the green box representing a
xvii
and Cox et al., (1979) as well as plutonic Rock Classification diagram by Debon and La Fort,
(1983) ... 205
Figure 6.2. QAP classification diagram showing CIPW normative values for four main
members of the Upper Beaver Intrusive Complex ... 206
Figure 6.3. Alteration box plot based on the Ishikawa alteration index (AI) and
Chlorite-carbonate-pyrite index (CCPI) showing alteration trends among select lithologies from the
Upper Beaver Intrusive Complex ... 209
Figure 6.4. QAP classification diagram showing CIPW normative values for select lithology
in the Upper Beaver Intrusive Complex ... 210
Figure 6.5. Alteration box plot based on the Ishikawa alteration index (AI) and
Chlorite-carbonate-pyrite index (CCPI) showing alteration trends among select lithologies from the
Upper Beaver Intrusive Complex ... 211
Figure 6.6. Au versus Cu plot for Precambrian intrusion-related and stockwork-disseminated
deposits superimposed on geochemical data from the Upper Beaver deposit. ... 228
xviii
List of Appendices
Appendix A: Hand Sample and Petrographic Description of Collected Samples ... 248
Appendix B: Detection Limits and Substituted Population Values for the Upper Beaver Dataset... 301
Appendix C: Summary Statistics for the Upper Beaver Dataset ... 306
Appendix D: Geochemical Analysis Results for Mineralized Samples in the Upper Beaver Deposit ... 309
Appendix E: Element Excitation Energies ... 1
Appendix F: Major Oxide Percents and Calculated CIPW Normative Values ... 1
Appendix G: APS Standard Operating Procedures ... 1
Appendix H: GeoPIXE Standard Operating Procedures ... 11
Appendix I: Microprobe Results ... 30
1
Chapter 1: Introduction and Background
1.1
Mining in Kirkland Lake
Canada is host to some of the most extensive and profitable gold deposits in the
world, making it a leader in the global gold market. Many of these deposits are
located within the Abitibi Subprovince, a division of the Superior Province, and the
largest Archean craton of the Canadian Shield extending for over 500 km E-W from
west of Timmins, Ontario to east of Chibougama, Quebec (Card, 1990; Hodgson et
al., 1991; Phillips, 2005). The Abitibi t is one of the world’s most prolific gold and
base metal producing regions (Benn & Peschler, 2005) with an estimated mineral
production of $120 billion as of 2005 (Thurston et al., 2008).
The town of Kirkland Lake is located within the prolific Southern Abitibi
Greenstone Belt, an Archean greenstone belt that also contains prolific economic
deposits of gold, zinc, copper, silver, nickel, and PGE’s (Poulsen et al., 1992). Gold
was first discovered in the Kirkland Lake region in 1906 on the shores of Larder
Lake. The region promptly became the site of the first gold rush in northeastern
Ontario (Ewert et al., 2011). Production of the first gold mines in Kirkland Lake
began in 1910 with the opening of the Gateford and Swastika Mines (Ewert et al.,
2011; Kishida and Kerrich, 1987). Gold production in Kirkland Lake was continuous
for 90 years, until the closure of the Macassa Mine in 2000 (Isopolatov et al., 2008).
The camp produced more than 760 metric tonnes of Au from 25 mines from 1910 to
2002 (Dubé and Gosselin, 2007 and references therein). In 2002, Kirkland Lake Gold
Inc. re-opened the Macassa Mine and is has been actively mined since. The Kirkland
Lake camp ranks second in Canada, after Timmins, with respect to total ounces of
gold produced (Dubé and Gosselin, 2007). The location of the Upper Beaver
property is shown in Figure 1.1, below.
Alfred Beauregar first discovered gold on the Upper Beaver property in 1912
(Alexander, 2006). Following discovery, the deposit was exploited as the historic
1965-1972 (Bernier and Cole, 2012). Following and between periods of production, the
property was a target of several surface, shaft, and drilling operations. Past
production includes a total of 140,709 oz Au and 11,955,312 pounds of Cu from
526,678 tonnes grading 8.31 g/t Au and 1.03% Cu (Alexander, 2006).
Figure 1.1. Location of the Upper Beaver property. Figure modified after
(Bernier and Cole, 2012).
1.2
Regional Geology
The vast majority of gold deposits in metamorphic terranes like the Abitibi
Greenstone Belt are related to large first-order, deep-crustal fault zones, although the
deposits themselves are not typically directly hosted in the faults. These near-vertical
fault zones have complex structural histories, with a strike length of several hundred
kilometers and a width of a few hundred to as much as a few thousand meters. They
tend to run parallel to sub-parallel to major lithological contacts, which acted as
as seismic events drove fluid migration from the deep-crust (Robert, 2001; Goldfarb
et al., 2005; Dubé and Gosselin, 2007).
In the southern Abitibi Greenstone Belt the two major first-order structures that
are related to gold deposits include the east-west trending anastomosing zones of
high strain: the Porcupine-Destor Deformation Zone (PDDZ) and the Larder-Lake
Cadillac Deformation Zone (LLCDZ). These high-strain zones are locally known as
“breaks”. Gold deposits mainly occur at jogs or changes in the strike along the
second- and third-order structures, which were probably connected to the first-order
structures during gold mineralization events (Groves et al., 2003; Goldfarb et al.,
2005). Additional less common sites that host gold deposits include fault
intersections, areas of regional uplift or anticlines, and zones of competency contrast
such as at intrusion margins (Groves et al., 2005). The precise fluid-flow paths, the
source of the fluids, and how the fluid evolved as it passed from one part of the
system to another, are still unclear and are commonly a topic of debate (Dubé et al.,
2015). Similar to other greenstone gold deposits, most of the gold deposits in the
Abitibi likely formed during the late stages of orogeny and as such are widely
classified under the relatively diverse “orogenic gold” category (Goldfarb et al.,
2005). Orogenic gold deposits include epizonal (≤6 km, 150-300°C), mesozonal
(6-12 km, 300-475°C), and hypozonal (>(6-12 km, >475°C) deposits, whose classification
is based on the pressure and temperature conditions of ore formation, as suggested by
Bohlke (1982). The term orogenic gold deposit is not universally accepted however
as it is commonly used in literature it is also used here. The Kirkland Lake deposits in
particular are dominantly classified as mesothermal orogenic lode gold deposits,
where mineralization was closely associated with hydrothermal fluid circulation and
deposition of gold along major and splay fault and deformation zones, and with gold
mineralization being largely hosted within laminated quartz-carbonate fault fill veins
(Dubé and Gosselin, 2007). Groves et al., (1998) identified that subduction-related
events likely periodically raised the geothermal gradient within hydrated accretionary
sequences, initiating and driving long-distance hydrothermal fluid migration from the
mantle, resulting in the formation of gold-bearing quartz veins that were emplaced
The Kirkland Lake Gold Camp is situated on the southern limb of the regional
Blake River synclinorium, which is truncated in the north by the Destor-Porcupine
Break and in the South by the Larder-Lake Cadillac Break and its associated
deformation zone (Ewert et al., 2011). Both breaks are east trending and steeply
inclined (Kerrich and Watson, 1984). The east-plunging synclinorium extends from
the Lake Abitibi batholith to the Round Lake batholith (Kerrich and Watson, 1984).
The Cadillac-Larder Lake Break is considered to have been a major east west
thrust fault with associated hydrothermal carbonation that later experienced
expansion, creating a basin that was filled with calc-alkaline volcanic and clastic
sedimentary rocks of the Timiskaming Group (Dimroth et al., 1983; Ayer et al.,
2005). Later compression of this area created parallel and splay faults in the
Timiskaming and Lower Tisdale group rocks, such as the Kirkland Lake Main break,
along which many of the Kirkland Lake gold deposits were formed, (Figure 1.2;
Ewert et al., 2011).
deformation zones/breaks, and simplified regional geology. Figure modified from Breede et al., (2011).
The Larder Lake-Cadillac Break is up to 600 m wide and is represented by a
steeply south-dipping zone of intense ductile deformation and carbonate-chlorite
alteration (Wilkinson et al., 1999). Seismic reflection surveys indicate that the LLCB
extends to a depth of up to 15 km (Jackson et al., 1990; Cruden and Launeau, 1993).
It follows the contact between the 2680-2670 Ma alkalic metavolcanics and clastic
metasediments of the Timiskaming Group to the north and the 2705 Ma old mafic
metavolcanics and turbidities of the Larder Lake Group to the south (Cruden and
Launeau, 1993). North of the break, the Timiskaming Group forms a steeply dipping
syncline that lies unconformably over 2701 Ma mafic to felsic metavolcanics of the
Blake River Group (Cruden and Launeau, 1993). To the South, the Larder Lake
Group rocks are faulted against a north to northeast-dipping sequence of
meta-volcanics that are approximately 2747-2701 Ma, which wrap around the Round Lake
batholith (2703-2697 Ma) (Cruden and Launeau, 1993; Jensen 1985; Jackson and
Fyon, 1991).
In a recent re-interpretation of the break, Bleeker (2015) proposes that
synorogenic extension initiated the production of the fault zones, likely in association
with upper mantle processes, alkaline magmatism, increased heat flow into the lower
crust, and synorogenic basin development. Magmatic and hydrothermal processes
produced the gold deposits as a result of this extensional regime. Following deposit
development, the deep reaching extensional faults were inverted as thick-skinned
thrusts, which effectively uplifted the mineralized hanging wall portion of the faults.
Bleeker (2015) uses this process to explain the lack of mineralization in the hanging
wall of the Abitibi gold deposits. He also proposes that a combination of extension,
mantle-related magmatism, increased heat flow, and the formation of the major faults
acted as an engine to drive gold mineralization events.
1.3
Introduction to the Project
Canadian Malartic Corp. (CMC) currently maintains the largest land holdings
covering an almost contiguous area of approximately 230 km2. The properties host 10
gold deposits, including five NI43-101 compliant properties that contain current and
historic mineral resources of 2 million ounces (measured and indicated) and 1.8
million ounces (inferred), as outlined in Table 1.1 (Ewert et al., 2010; Ewert et al.,
2011; Gamble, 2011; Puritch et al., 2011; Bernier and Cole, 2012).
Table 1.1. Indicated and inferred mineral resources for CMC’s five NI43-101 compliant properties
Property Indicated Inferred Reference
Amalgamated Kirkland
1,145,126 t @ 4.47 g/t (164,573 oz Au)
1,530,067 t @ 4.21 g/t
(206,991 oz Au) Gamble, 2011
Anoki-McBean
1,436,000 t @ 4.69 g/t (216,400 oz Au)
1,558,000 t @ 4.73 g/t (236,800 oz Au)
Ewert et al., 2010
Bidgood
1,464,000 t @ 1.69 g/t (79,000 oz Au)
318,000 t @ 2.02 g/t (21,000 oz of Au)
Puritch et al., 2011
Upper Canada
1,959,000 t @ 2.17 g/t (137,000 oz Au)
4,895,000 t @ 4.02 g/t (633,000 oz Au)
Ewert et al., 2011
Upper Beaver
6,870,000 t @ 6.62 g/t (1,461,000 oz Au)
4,570,000 t @ 4.85 g/t (712,000 oz Au)
Bernier and Cole, 2012
Total 2,057,973 oz Au 1,809,791 oz Au
CMC’s five Kirkland Lake NI43-10 compliant properties (Upper Beaver,
Anoki-McBean, Bidgood, Upper Canada, and Amalgamated Kirkland) are located along the
Larder Lake-Cadillac deformation zone and are classified as lode gold deposits,
where economic concentrations of gold developed from hydrothermal fluids in
veining systems of epithermal to mesothermal origin (Ewert et al. 2010). Mineralized
zones within these deposits tend to be associated with strongly altered zones,
especially those altered by carbonate, silica, and sericite (Ewert et al, 2010; Puritch et
al. 2011; Ewert et al. 2011).
The Upper Beaver deposit however, is atypical of the area. Unlike the lode gold
deposits in the Larder Lake and Kirkland Lake area, the Upper Beaver deposit
consists of abundant gold and copper mineralization, associated with widespread and
pervasive magnetite-feldspar-actinolite-epidote-carbonate-sericite alteration. Further,
mineralization at the Upper Beaver deposit is not associated with the Larder Lake
Cadillac Deformation Zone, which lies roughly 8 km south of the Upper Beaver
Complex (Bernier and Cole, 2012). The Upper Beaver deposit has a historic
production of 140,000 oz. Au and 11.9 million lbs of Cu from 526,678 tonnes
grading 8.3 g/t Au and 1% Cu. (Puritch et al., 2012). Further, the most recent NI
43-101 resource published in September 2012 defines an indicated resource of 6,870,000
t @ 0.37% Cu, 6.62 g/t Au and an inferred resource of 4,570,000 t @ 0.32% Cu and
4.85 g/t Au (Bernier and Cole, 2012).
The deposit was historically classified as a volcanogenic exhalative deposit due
to the abundance of hydrothermal magnetite and apparently stratabound
mineralization in a mafic volcanic-sedimentary sequence (Morris, 1974). Following
publication, further work on the deposit identified two types of ore, namely
syngenetic or exhalative gold-copper and chalcopyrite-pyrite-magnetite veins, which
contributed to deposit model more consistent with greenstone-hosted orogenic
Archean gold (Roberts and Morris, 1982), similar to mineralization in the Kirkland
Lake gold camp. However, due to the atypical features of the deposit outlined above,
the classification has always remained enigmatic. Recent reevaluation of the deposit
by Kontak et al. (2008) found that features of the deposit are consistent with a
magmatic-hydrothermal origin, but more closely resemble syenite-associated gold
deposits or iron oxide copper gold systems as opposed to a strictly lode-gold system.
Kontak et al, (2008) concluded that the deposit should be classified as a
syenite-associated copper-gold deposit, with some features being more consistent with
deposits in the Timmins camp, and with other features more closely resembling an
IOCG deposit. Presently, as outlined in the 2012 Technical report on the property, the
Upper Beaver deposit is classified as an oxidized, magmatic-hydrothermal,
syenite-associated Au-Cu, where the deposit developed syngenetically with an alkaline
intrusive body as part of a magmatic-hydrothermal system (Bernier and Cole, 2012).
1.4
Objectives
With the ever-growing massive quantities of geochemical databases, multivariate
data analysis methods are becoming increasingly necessary in geological model
generation and exploration targeting (Ding and He, 2004). The objectives of this
to evaluate what information can be attained from company-provided data. The
evaluation focuses on documenting and characterizing key lithologies and
mineralization signatures in the Upper Beaver deposit. More specific objectives of
this project of include:
1. Assess the geochemical signature of intrusions and host rocks (including the
sedimentary package and breccia lens) in the Upper Beaver deposit in order to
better define the lithologies and to draw conclusions on their genesis and their
relationship to mineralization;
2. Assess large-scale geochemical associations with gold mineralization using
available company data through exploratory data analysis to better understand
spatial variations in mineralization styles; and
3. Utilize synchrotron source x-ray fluorescence microprobe analysis (SR-XRF)
to supplement exploratory data analysis of bulk rock geochemical data in
order to evaluate the micro-scale spatial relationship between Au
mineralization and trace element exploration vectors.
1.5
Previous Work
Previous work on Canadian Malartic Corporation’s Kirkland Lake properties
includes a detailed technical report that evaluates the economic potential of all
CMC’s Kirkland Lake properties by Alexander (2006) and two detailed reports
specifically focused on assessing mineral resources at Upper Beaver. These reports
include the technical report and mineral resource estimate update prepared by
Breede, Risto, and Kociumbas, of Watts, Griffs, and McOuat in 2011, and a technical
report produced by Bernier and Cole of SRK Consulting in 2012.
Additional work on the Upper Beaver deposit includes a Special Volume CIM
publication by Roberts and Morris (1982) on the geological setting of the Upper
Beaver Mine, and an open file report by Kontak et al., (2008). Studies by Roberts and
Morris (1982) concluded that there are two main types of ore in the deposit, including
syngenetic or exhalative gold-copper and chalcopyrite-pyrite-magnetite veins, which
(2008) focused on documenting key features of the Upper Beaver deposit including
discussing main lithologies, mineralization and alteration styles, and assessed trace
element correlations with Au. It concluded that the deposit is characterized by an
Au-Ag-Hg-Te-Bi-Sb association, and the deposit shares similarities with
intrusion-related gold deposits, porphyry-type deposits, syenite-associated deposits, and IOCG
gold systems.
In addition to published papers,Talisker Exploration Services Inc produced three
unpublished external assessment reports on the property including: (1) an assessment
on the multi-element drill hole geochemistry of the Canadian Kirkland, Upper
Beaver, and Bidgood deposits (Talisker, 2014a); (2) a petrologic and chemical study
on igneous rocks from the Canadian Kirkland, Bidgood, and Upper Canada Deposits
(Talisker, 2014b); and (3) age-dating using U-Pb zircon analysis of 7 volcanic and
intrusive rock samples performed by Dr. Victor Valencia of VU Geoservices Corp
located in Tucson AZ and calculated using Isoplot (Talisker, 2014c). Talisker
(2014a) concluded that Au mineralization at Upper Beaver had a very strong positive
correlation with Ag, Mo, and S, and a moderate positive correlation with Ni, Cu, W,
Bi, and Fe. It also concluded that Upper Beaver has a moderate negative correlation
with Na. As well, the main findings by Talisker (2014c) concluded that the main
mineralizing event at Upper Beaver most likely occurred between 2674-2671 Ma and
a late mineral to post mineral intrusive event, which occurred between 2671 to 2665
Ma, followed. They also suggest that the main ore controls included pre- to syn-
magmatic faults, dikes, and lithological controls, however they noted that the strong
deformation event that produced the shear zones was late to post mineralization.
Thus, Talisker (2014c) proposed that mineralization in the Upper Beaver deposit
developed prior to mineralization in the Larder Lake and Kirkland Lake gold camps,
(Isopolatov et al., 2008).
For the past eight years, the University of Western Ontario (UWO) has also
undertaken geologic research work on the Kirkland Properties by successive
cooperation with Vault Minerals, Queenston Mining, Osisko Mining Corporation,
the years, a common objective has been maintained; namely to better characterize
near-surface and deep mineralization in the Kirkland Gold Camp using optical
petrography, stable isotope analysis, electron microscopy, trace element and rock
geochemistry methods. Student projects that focus specifically on the Upper Beaver
deposit include two projects by students from the University of Western Ontario and
one project by a student from the University of Waterloo including: (1) An
assessment of the mineralogy, textures, and major and trace element whole-rock
geochemistry of gold bearing veins in drill core as it relates to depth across the East
and West Porphyry Zones by Griffin (2011); (2) An assessment of the five main
lithologies in the deposit in terms of mineral assemblages and trace element
signatures of least-altered whole-rock drill core samples by DeAgazio (2012); and (3)
An assessment of the alteration assemblages in drill core from the South Contact
Zone to define alteration and whole rock geochemical associations with Au
mineralization by Feick (2014) from the University of Waterloo. Findings by Griffin
(2011) on major and trace element geochemical analysis indicated variable pathfinder
element correlations with gold between the East and West Porphyry Zones, possibly
related to differences in mineralizing fluid chemistry or more likely the structural
level of the deposit on either side of the diabase dyke. Griffin (2011) also concluded
that gold typically occurs as inclusions within anhedral chalcopyrite grains that
typically have a sieve texture. Inclusions of gold within magnetite and pyrite grains
also occurred within several samples. The results of the study by DeAgazio (2012)
indicated that all rocks showed some degree of alteration and that there was no
difference between oxygen isotopes between fresh and altered samples, suggesting
that the alteration system may be more extensive than previously thought. All
samples DeAgazio analyzed were enriched in LREEs and depleted in HREEs except
for the Tisdale Assemblage, which was more depleted in LREEs relative to
chrondrite normalized values proposed by Taylor and McLennan, (1985). Finally, the
research project completed by Feick (2014) concluded that there were three main
alteration assemblages in the strongly altered basalt from the South Contact Zone.
These assemblages include early clinochlore ± hematite ± goethite ± magnetite
silica. Overall, evidence from this study suggested that the South Contact Zone is
intimately related to the other mineralized zones in the Upper Beaver Deposit and
that the localized strong alteration was likely the result of a combination of
hydrothermal alteration and contact metamorphism, caused during the intrusion of
members of the Upper Beaver Intrusive Complex, specifically a crowded syenite
porphyry dike. The underlying volcaniclastic rocks unit may also have acted as an
impermeable lower boundary due to competency contrasts between the basalt and the
volcaniclastic rocks, and focused fluid circulation in the overlying basalts (Feick,
2014).
This thesis aims to further document the main lithologies in the Upper Beaver
deposit that are associated with mineralization in Chapter 3 using company provided
data and select hand samples and thin sections. It also aims to statistically assess
large amounts of company-provided bulk rock geochemical data in order to draw
conclusions on ore genesis and styles of mineralization across the entire Upper
Beaver deposit in Chapter 4. Finally, Chapter 5 will focus on assessing samples from
all mineralized zones in the deposit using synchrotron source XRF microprobe
analysis to provide the necessary mineralogical context to explain the trace element
correlations identified in Chapter 4.
1.6
Deposit Geology
The Upper Beaver deposit lies roughly 8 km north of the Larder-Lake Cadillac
Break and 30 km east of Kirkland Lake, hosted within a succession of volcanic and
volcaniclastic rocks that fill a basinal feature on the northern margin of the
Timiskaming basin (Bernier and Cole, 2012). A simplified surface map is provided in
Figure 1.3, and a geological model showing the main lithological units, and a
composite cross section that shows the distribution of mineralization in the deposit,
are provided below in Figures 1.4 and 1.5, respectively. In a recent technical report
@ 6.62 g/t, or 1,461,000 oz Au, while mineral resources were reported to be
4,570,000 tonnes @ 4.85 g/t, or 712,000 oz Au (Bernier and Cole, 2012).
Figure 1.3. Simplified surface geology of the Upper Beaver Property showing the location of the composite cross section provided in Figure 1.5, as well as
significant major lithological units and local faults. The Upper Beaver Intrusive Complex is located at the contact between the Blake River and the Upper Tisdale Assemblages, which the Victoria Creek Deformation Zone also in part follows. The Intrusive Complex dips Northwesterly at roughly 60-70 degrees. Figure modified from Alexander, (2006).
The oldest rock unit on the property is part of the 2710-2704 Ma Tisdale
Assemblage, which is composed of a variety of volcanic to volcaniclastic rocks,
including komatiitic, tholeiitic, and calc-alkaline rocks (Ayer et al., 2005; Bernier and
Cole, 2012). Formerly called the Gauthier Group, the Upper Tisdale Assemblage
consists mainly of fine-grained, finely bedded, strongly altered and sheared tuff that
range in colour from orange to reddish brown to greenish gray. Tuff breccia is also
present in this formation, which contains elongated and rounded fine to
coarse-grained fragments within a fine-coarse-grained ash-rich matrix that is foliated around the
Figure 1.5. Modified composite cross section of mineralized zones in the Upper Beaver deposit in relation to the major lithological units. A and B correspond to Figure 1.3. Original figure provided by Canadian Malartic Corporation.
The 2701-2696 Ma Blake River Assemblage (formerly called the Kinojevis
Group) overlies the Tisdale assemblage and consists of calc-alkaline basalts,
tholeiitic mafic volcanics, and rhyolite (Dimroth et al., 1983; Ayer et al., 2005).
Together, the two Assemblages record at least two cycles of volcanism, each
composed of komatiitic, tholeiitic, and calc-alkaline volcanics (Kishida and Kerrich,
1987). The units themselves are interpreted to represent individual over-lapping
shield volcanoes with local lenses of sediments intercalated with or capping volcanic
cycles (Dimroth et al., 1982; Thurston et al., 2008). Assemblage studies by Goodwin
(1980) indicate that the lava flows were likely thick, extensive, and rapid, with
large-scale magma outpourings. Goodwin (1980) further argues that the pillows indicate a
submarine extrusive environment and the sparse amounts of interflow sediments
between flow layers indicate that magmatism occurred at substantial water depths.
This is supported by studies by Pearson and Daigneault (2009) who argued that the
Blake River Group formed as a subaqueous overlapping and nested caldera complex.
Volcanism and plutonism were terminated by 2,700 Ma as a result of the
collision of a large continental mass to the south (Cruden and Laneau, 1993). An
extended period of deformation, referred to as D1 deformation, occurred at the end of
this collision between 2,687 and 2,680 Ma (Robert, 2001). D1 involved contractional
deformation, resulting in early tilting, folding, and local thrusting of supracrustal
units as well as the emplacement of diorite-tonalite intrusions (Robert, 2001). A
number of upright east-west-trending anticlines and synclines were developed at this
time, such as the Blake River synclinorium, which hosts the Kirkland Lake gold
camp (Dimroth et al., 1983; Wilkinson et al., 1999). Robert (2001) suggests that in
the Noranda district there is evidence that the major fault zones, which would later
host gold mineralization, developed and were active during D1, prior to Timiskaming
sedimentation.
The termination of D1 marks the beginning of Timiskaming sedimentation
(2677-2670 Ma), which produced the Timiskaming Assemblage (Ayer et al., 2005).
The Timiskaming Assemblage overlies the older volcanic units unconformably, and
high-level alkaline volcanic rocks and their local volcanic equivalents that cross cut
the local assemblages (Robert, 2001; Ayer et al., 2005; Isopolatov et al., 2008).
Post D1 activities included an episode of compression, D2, which consisted of
regional shortening north-south across the belt and possible sinistral transpression, as
suggested by Bleeker and Parish, (1996) and Wilkinson et al., (1999). Structural
relationships and age dating can be used to constrain the timing of syenite-associated
gold deposit development to between D1 and D2 during the Timiskaming-type
sedimentation (Robert, 2001). Local orogenic gold deposits, including the Upper
Canada, and the McBean and Anoki deposits east of Kirkland Lake formed during
D2, along the Upper Canada deformation zone splay fault and the Larder Lake
Cadillac Deformation Zone, respectively (Isopolatov et al., 2008). Ispolatov et al.,
(2008) suggests that the formation of these deposits is most likely related to a
regionally extensive hydrothermal system that was associated with the Larder
Lake-Cadillac deformation zone. The D2 transpression event later evolved into the third
deformation episode, D3, which involved dextral transverse thrust faults centered
along the major fault zones, although mineralization is not associated with this
deformation event (Bleeker and Parrish, 1996). Locally deformation was most
intense along the Destor-Porcupine Fault Zone and the Cadillac-Larder Lake Fault
zone. D4 followed D3 and consisted of northwest-southeast shortening. The Kirkland
Lake deposit, which is located off of the ’04 break, formed during D4, synchronous
with with reverse-dextral movements along the ore-controlling Kirkland Lake fault
(Isopolatov et al., 2008). The Kirkland Lake deposit is characterized by
sulphide-poor gold- and telluride-rich mineralization with a metal signature of Te-Au, Mo, Pb,
Ag, high Au/Ag, and low As) which was interpreted by Ispolatov et al., (2008) to be
likely related to a separate hydrothermal system that linked to a deep magmatic fluid
1.7
Structural Geology
The deposit sits on the north flank the Spectacle Lake anticline, an east to
east-southeast trending anticline. The anticline has been described by Alexander (2006) to
plunge south-easterly from a well-defined closure eastward on the Lac McVittie
lands, and by Jackson and Fyon (1991) as upright and doubly plunging. The Upper
Tisdale Assemblage on the property sits in the core of this anticline.
The Larder Lake Cadillac Deformation Zone, which was one of the main
controls for gold mineralization in the Archean, is located 8 km south of the Upper
Beaver deposit. The deposit is spatially associated with a subtle deformation zone
that is roughly subparallel to the Larder Lake Cadillac Break and coincides with a
wide zone of sericitic alteration that occurs on the property. This structure, which
occurs as a high strain zone at the contact between the Tisdale and Blake River
Assemblages, is called the Victoria Creek Deformation Zone, as shown on Figure
1.3. This deformation zone is thought to correlate with the Victoria Creek deposit 5.5
km to the west, where mineralization is hosted in calc-alkaline volcaniclastic rocks of
the Upper Tisdale assemblage near the contact with the Lower Blake River basalts
(Pflug et al., 1993). The Victoria Creek Deformation Zone likely represents a
component of movement related to the Larder Lake Cadillac Deformation Zone
(Alexander, 2006). Studies by Roberts and Morris (1982) identified that the
deformation zone formed during D0 deformation, which they argue was
contemporaneous with volcanism. The lithology contrast at this contact likely played
a critical role in focusing fluid migration and was likely intimately related to gold
mineralization and intrusion emplacement on the property (Roberts and Morris, 1982;
Bernier and Cole, 2012). The exact location of the Victoria Creek Deformation Zone
is poorly understood, although for the most part it strikes northwest, dips 065-070
degrees to the northeast, and is typically represented as a broad zone of ductile
shearing and strong sericitic alteration (Bernier and Cole, 2012). Dikes and plugs of
the Upper Beaver Intrusive Complex likely intruded along, and adjacent to, the
intrusive-basalt contact, which includes the Victoria Creek Deformation Zone, is a sheared
margin.
Alexander, (2006) also suggested that the intrusions on the property might be
spatially related to two splays off of the Larder Lake-Cadillac Deformation Zone,
namely the parallel northeast-trending Upper Canada Break and the Upper Canada
South Branch. The Upper Canada Break is of particular interest as it hosts the Upper
Canada deposit 7 km southwest of the Upper Beaver deposit. If the Upper Canada
break is extrapolated along its strike length it tracks roughly 900 m north of the
Upper Beaver #3 shaft and if the South Branch is tracks 400 m south of the shaft
(Isopolatov et al., 2005; Kontak et al., 2008).
Finally, a younger structure, the North-South Misema fault, consists of a very
strong broad mud-clay fault and hosts the barren diabase intrusion on the property
along its western margin (Bernier and Cole, 2012). This fault played a role in
offsetting the East and West sections of mineralization on the property (Bernier and
Cole, 2012).
1.8
Mineralization
Au and Cu mineralization at Upper Beaver is centered on the 600 m wide
polyphase intrusive complex referred to as the Upper Beaver Intrusive Complex,
consisting of a main igneous body with associated dikes, sills, and apophyses
(Bernier and Cole, 2012). Alteration, intrusive breccias, and chilled margins are
evidence that the complex intruded as pulses of magma that were replenished by a
deep magma chamber (Kontak et al., 2011). Gold and copper mineralization occurs
within, proximal to, and outbound of this intrusive complex and is commonly
associated with widespread alteration (Bernier and Cole, 2012). Primary hosts for
mineralization include the Blake River basalts and members of the polyphase
intrusive complex; especially the rocks referred to as mafic syenite and crowded
syenite porphyry phases (Bernier and Cole, 2012). The current exploration model for
associated Au-Cu, where deposit developed syngenetically with an alkaline intrusive
body as part of a magmatic-hydrothermal system (Bernier and Cole, 2012).
1.8.1
Au Mineralization
Au mineralization is complex, consisting of a wide range of different
mineralization styles, including both vein-style and replacement-style mineralization,
as outlined by Masson in a recent technical report (Bernier and Cole; 2012),
including:
1. Quartz-calcite-magnetite-chalcopyrite veins ± pyrite ± molybdenite ± visible gold
2. Quartz veins ± chalcopyrite ± pyrite ± molybdenite ± visible gold
3. Calcite veins ± chalcopyrite ± pyrite ± visible gold
4. Quartz-molybdenite-visible gold veins
5. Carbonate-anhydrite veins ± chalcopyrite ± pyrite ± visible gold
6. Disseminated and fracture controlled mineralization
7. Replacement style mineralization – magnetite-epidote-feldspar-hematite-pyrite-chalcopyrite
Au mineralization styles 1-6 occur as steeply dipping zones of multi-generational
sheeted and conjugate vein arrays and fracture fillings, while style 7 occurs within
areas of intense alteration and is restricted to the South Contact Zone in the deposit.
In addition to these styles, gold is rarely seen as coarse disseminations in silicified
porphyritic intrusives (Bernier and Cole, 2012).
In general, gold mineralization occurs in veins and altered packages in steeply
north to northwest dipping zones along the intrusive-volcanic contact and less often
dip shallowly (Bernier and Cole, 2012). Common vein gangue minerals include
quartz, calcite, ankerite, and anhydrite. Less abundant gangue minerals include
The distribution and orientation of subsidiary faults, fractures, and veins, as well
as branching and splay elements occur subparallel and perpendicular to regional
structures (Alexander, 2006). There are three dominant sets of structure orientations.
This includes: (1) east-north striking faults and fractures that dip steeply north; (2)
northeast structures that dip steeply southwest; and (3) northwest trending structures
that dip steeply northeast (Alexander, 2006).
Three prominent syenite porphyry dikes of the Upper Beaver Intrusive complex
occur within the mine workings of the Upper Beaver mine. They have historically,
and continue to be, important marker units for geological interpretation (Bernier and
Cole, 2012). The porphyry dikes range in width from a few meters to 30 meters thick.
They have a strike length of approximately 500 meters down to a depth of more than
2000 meters (Bernier and Cole, 2012).
Multiple sub parallel dikes are observed in the deposit, striking between 025 to
050 degrees and dipping steeply northwest at 60 to 85 degrees (Bernier and Cole,
2012). The dikes are geochemically similar and coalesce down dip and along strike.
With decreasing distance to the center of the Upper Beaver Intrusive Complex
identification of the individual dikes becomes increasingly more difficult (Bernier
and Cole, 2012). They are all are spatially related to mineralization and frequently
host mineralization on the property, especially in the porphyry zones. Mineralization
is concentrated along dike contacts or is concentrated in the immediate hanging and
footwall areas (Bernier and Cole, 2012). From south to north the dikes are named the
Botsford, Bregg, and Tully dikes (Bernier and Cole, 2012).
Early production from the upper levels of the mine concentrated on extracting a
series of north (000 degrees) to northeast (025 to 055) trending veins that were
continuous with depth (Alexander, 2006). East-northeast trending (055-070 degrees)
veins were encountered north of the main mine levels and at depth, becoming more
common below the 500-ft level, and dominant below the 1000-ft level (Alexander,
2006). Cunningham (1977) describes the vein systems from the mine as being
height of 30 m, and no longer than 120 m. He further states that the veins tend to
terminate abruptly, join with one another, and tend to exhibit a gently curved outline
in plan and section. Alexander (2006) attributes the multiple orientations of veins
reflect the “complex roll in the geology at the Upper Tisdale contact, combined with
potential drag-folding related to faulting, and, fracturing/ remobilization associated
with the north trending Misema cross fault in the mine workings that is filled with
diabase”.
1.8.2
Cu Mineralization
Abundant copper mineralization is atypical of the Kirkland Lake and Larder Lake
regions. The controls on the distribution of copper mineralization in the Upper
Beaver deposit remain poorly understood. It can be spatially associated with gold, but
often also occurs separately.
1.9
Timing of Mineralization
In a study by Isopolatov et al., (2008) on the geologic and structural setting of
gold mineralization in the Kirkland Lake-Larder Lake Gold Belt, they used three
generations of post-Timiskaming regional deformation fabrics to constrain the age of
mineralization in the Upper Canada, McBean, Anoki, and Kirkland Lake deposits.
Their study concluded that the Upper Canada, McBean, and Anoki deposits formed
during D2, along with the Kerr-Addison-Chesterville, Omega, and Cheminis
deposits, while the Kirkland Lake deposit formed during D4, along a separate
hydrothermal system unrelated to mineralization along the syn-D2 deformation
zones. Talisker’s (2014c) proposed age of mineralization (2661-2674 Ma), i.e.,
pre-D2-deformation, in the Upper Beaver deposit is older than that proposed for other
local deposits.
This proposed age for mineralization fits the best with the syenite-associated clan
of gold deposits, which share a crystallization age of 2680-2672 Ma (Robert, 2001).
This group includes the Young-Davidson, Matachewan Consolidated, Ross,
Holt-McDermott, Lightning, Beattie, Douay, and Malartic deposits, which share a similar
2001). They also share a similar mineralization style, which consists of disseminated
sulphide replacement zones with variably developed stockworks of quartz-carbonate
± K-feldspar veinlets centered within associated intrusions or along their margins,
along satellite dikes and sills, or along faults and lithologic contacts away from
intrusions (Robert, 2001).
The Upper Beaver deposit also shares some similarities with Alkaline Cu-Au
porphyry to epithermal and IOCG systems. However, Alkaline Cu-Au porphyry to
epithermal systems are dominantly Phanerozoic in age with only rare Archean
examples (e.g., the Hollinger-McIntyre Au-Cu deposit in the Abitibi, the Boddington
Cu-Au deposit in Australia, and the Troilus Au-Cu deposit in the Evans-Frotet
greenstone belt in Canada) (Helt et al., 2014). Similarly, although IOCG deposits are
recognized to occur in the Archean the lack of IOCG deposits in the Abitibi
Greenstone belt make it difficult to compare the deposit with this deposit model.
Significant work would need to be performed to unequivocally prove whether Upper
Beaver deposit fits this genetic model.
1.10 Intrusions and mineralization
In a recent review of the deposit, Kontak et al., (2011) provided evidence for the
overlap of magmatic and hydrothermal activity in the Upper Beaver deposit,
indicating an intimate relationship between intrusions and mineralization. This
evidence includes a) mafic dikes cross cutting intensely altered volcanic rocks, b)
sericite-albite alteration which post dates magnetite alteration, c) mafic syenite dikes
cross cutting altered syenite dikes, d) quartz feldspar porphyry cross cuts both felsic
syenite and mafic syenite, e) and intense phyllic alteration associated with the quartz
feldspar porphyry unit. Kontak et al., (2011) suggests that the relationship between
magmatism and mineralization is also supported by sulfur and oxygen isotope studies
of mineralization in the deposit. They identify that the δ34S signature suggests a
isotopes suggest a uniform reservoir for 18O and a T=400°C, but with a mixed
magmatic-metamorphic source.
Intrusion-associated deposits in the Archean Abitibi are associated with a diverse
magmatic suite of calc-alkaline to transitional alkaline rocks, including: gabbro,
diorite, granodiorite, monzodiorite, syenite, tonalite, trondhjemite, granite,
lamprophyre/ albitite, and lithium, cesium, and tantalum pegmatite dikes (Dubé et al.,
2015). The wide range in compositions, age of intrusions, and disparate gold events,
associated with gold mineralization in the Abitibi led Dubé et al., (2015) to conclude
the conditions favorable for gold mineralization were not unique.
Intrusion-associated deposits that are recognized to be associated with oxidized
magmatic fluids include alkaline porphyry to epithermal deposits (Jensen and Barton,
2000), syenite-associated deposits (Robert, 2001), and some IOCG deposits
(Williams et al., 2005). Oxidized magmatic fluids are thought to suppress sulphide
saturation in order to generate gold rich fluids (Richards, 2011 and references
therein). The association between IOCG deposits and oxidized igneous intrusions is a
current topic of debate, with some authors claiming that a spatial association with
igneous intrusions indicates a porphyry or a skarn deposit as opposed to an IOCG
deposit (Williams et al., 2005; Hitzman, 2000), and other authors claiming that there
is a genetic association (Requia et al., 2003). Alternatively, greenstone-hosted
orogenic deposits are not directly associated with intrusive phases. This is a definitive
criterion Robert (2001) proposes to separate greenstone-hosted orogenic deposits and
syenite-associated deposits into two distinct categories. However, there can be a close
spatial association between felsic and intermediate intrusions and orogenic gold
deposits in metamorphic belts, which can be problematic in terms of deposit
classification. This relationship has been long recognized in the Kirkland Lake gold
camp (MacLean, 1954), and the association between the intrusive phases and gold
mineralization in the Kirkland Lake deposit is currently being reevaluated