Non-Stationary Statistics with Amplitude Probability Density
Function for Exposure and Energy Density Reporting
near a Mobile Phone Running 4G Applications
Simona Miclaus* and Paul Bechet
Abstract—Present contribution introduces, for the first time, the description of human exposure dynamics to mobile phone radiation by implementing the use of in-air integrated energy density (IED) evolution in time. Using the amplitude probability density (APD) function capability of a real-time spectrum analyzer, we demonstrate the differences in exposure due to five different mobile applications running in Long Term Evolution (LTE) standard, based on energy deposited in air: voice call; voice over LTE (VoLTE); video call, file download and live streaming. This exposimetric method will be of great interest also for the new 5G communication standard. The superiority of the approach has three branches: a) integrated APD allows a sample rate of the order of 0.6×10⁸/s which is equivalent to an extremely agile tracing of the power level change in LTE communication standard (happening at every 6.67µs); b) momentary and mean IED accumulation rate can be computed, and minute differences between mobile applications may be observed during their running time; c) the superficial tissue temperature increase may be rapidly estimated after the period of use of one specific wireless application in the GHz frequency range. The method implemented here also provides the means for rapid usage profile expectancy assessment of a mobile phone user.
1. INTRODUCTION
The metrics of the human exposure protection against radiofrequency (RF) electromagnetic fields is continuously challenged, mostly because the wireless communication technologies advance towards emissions characterized by radiated fields with quasi-stochastic behavior, sporadic high peak powers, and variable crest factors. Safety standards in use till very recently this year 2019 [1, 2] have been under revision, and refined procedures were sought for, in order to properly advice protective limits. When moving up in the frequency spectrum towards mm-wave technologies including 5th generation (5G) wireless communication systems, high variability in time and position of an individual’s exposure is expected, for example from steerable arrays of beams. Such situations should be instrumented by extensive use of statistics.
As the user of a wireless communication technology is primarily exposed to the radiation of his/her own devices — such as cell phones, these are of the greatest interest. The data gathered till the present referring to biological or health effects are very controversial, mainly those connecting cell phones use with brain cancer. Since 2011, when the International Agency for Research on Cancer (IARC) classified the mobile phones’ emitted radiation as possibly carcinogenic to humans [3], literature has contin-ued to indicate both positive and negative results [4]. Belyaev reported in 2017 that a proper metrics
Received 7 November 2019, Accepted 17 January 2020, Scheduled 3 February 2020
* Corresponding author: Simona Miclaus ([email protected]).
for exposure to RF fields is a combination of exposure duration and power flux density of the field [5]. Evidence supporting a nonlinear dose-response relationship continued to gather, and recently in 2019 the authors of [6] demonstrated that a nonlinear J-shaped dose-response relationship exists in carcinogenesis due to mobile phone radiation.
The classical metrics in use in the frequency range of interest in this paper, that of (1–3) GHz, establishes protective limits based on the specific absorption rate (SAR) of energy deposition in tissues/body parts (W/kg) and on the incident power flux density (IPD), (W/m2). The procedures to establish if the safety limits are not exceeded generally refer to the “worst case” situations of exposure. However, realistic exposure is still very difficult to report with the methodology described in the guidelines in use.
A completion of the metrics has been proposed in the previous two years, to fill up the newly identified gaps regarding: a) time-variation of the emitted signals — which needs an improved averaging process; b) in the case of pulsed fields the fluence was proposed as a metric, and a limit of its value can be established, which depends on frequency and pulsewidth [7–9]. Fluence, a term imported from ionizing radiation dosimetry, refers to the radiant energy received by a surface per unit area (J/m2) and is similar to the integrated energy density (IED). It has also been demonstrated that the metric called transmitted power density (TPD) to the skin surface and SAR are proper indicators to estimate the skin temperature elevation for frequencies starting from (1–3) GHz upwards. The just-released (October 2019) improved IEEE C95.1 standard in USA [4] provides valuable details on short-duration exposures (less than the average time — 6 minutes), to be applied when investigating, for example, mobile phone radiation. In such a case, both the dosimetric and exposure reference levels associated with tissue heating are related to energy. Therefore, specific absorption (SA) or incident energy density should be used. A very similar approach is adopted in the draft guidelines to be used in Europe [10].
From another perspective, the usage pattern of the mobile phone is crucial. Gandhi has recently reported that most mobile terminals exceed the safety limits from guidelines when being held against the body [11]. The exceeding factors are situated between (1.6–3.7) reporting to ICNIRP guidelines [1] and even 11 when reporting to IEEE standard [2]. In the case of persons wearing spectacles, the effect of their presence near the phone can increase SAR very much [12]. The effect of three different usage patterns — voice calling, video calling, and texting were investigated by computational dosimetry in 2019 [13]. Radiated powers and gap distances between mobile phones and human heads are among the variables used to observe SAR and temperature distributions in head models. The results indicate a high impact of these variables on the deposited energy in the head. Also in 2019, the authors of [14] studied the temporal and power emission behavior of a mobile phone used in different wireless technologies 2nd–4th generations, respectively: GSM, UMTS circuit-switched, UMTS Voice over Internet Protocol (VoIP), Voice over Long Term Evolution (VoLTE), and LTE VoIP using WhatsApp and Skype mobile application, in active and idle states. They concluded that the emitted power of the terminal depended on the channel quality and the path loss between the device and base station antenna; therefore, each case needs a separate analysis. In order to report realistic exposure levels of mobile phone users, a statistical approach has been recently applied to trace the variability of the delivered input power during the uplink transmission of terminals and model it for given propagation conditions [15]. Also our research group’s latest contributions [16, 17] revealed radiated power levels near the terminal that highly depended on the time and the usage pattern.
2. MATERIALS AND METHODS
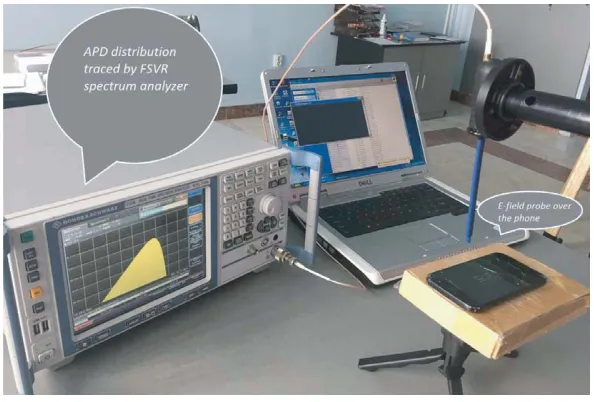
A mobile phone model Samsung Galaxy A3 (SM-A320FL) was used in the experiment. It emitted LTE signals on the center frequency of 1.93 GHz with a bandwidth of 10 MHz. The producers’ maximum SAR certified values are: SARhead = 0.349 W/kg; SARbody-attached = 1.38 W/kg. The measurement system was composed of: a) a near-fieldE-field probe model PBS E1 (Aaronia, Germany); b) real-time spectrum analyzer model Fast Support Vector Regression — FSVR (Rhode & Schwarz, Germany); c) a custom Python application which remotely interrogated and extracted the data from the analyzer. All the measurements were performed indoor, while keeping the terminal battery fully charged. The setup is shown in Fig. 1. A tinyE-field probe was positioned with its tip at 5.4 cm distance from the surface of the terminal, in air, exactly over the center of the loudspeaker. The probe was sequentially oriented on all three orthogonal directions Oxyz to finally express the total E-field strength in the point of measurement. Therefore, the field level was measured in a single point in air, in the radiative near-field of the mobile antenna, following a methodology described in our earlier paper [17].
Figure 1. The experimental set-up used for measuring the incident power density dynamics.
Five types of mobile applications were the sources of the RF exposure, namely: voice call, VoLTE, video call, file download (movie Youtube), and live streaming. The average and peak values of the E -field strengths were computed and analyzed in their time dynamics. Finally, the point fluence values in air were expressed, in terms of peak and average values, together with their evolution over a short-time duration (1 minute) of use of the specific wireless application.
investigated the statistical dynamics of the radiatedE-field component. Percentile amplitude statistics can be read directly from the APD. The peak statistic is defined by the amplitude that has exceeded 0.0001% of the time.
Practically, the probability of the measured amplitudes was provided and displayed as a histogram. While the selected measurement time for each measurement was 60 sec., the histograms of the amplitudes were provided. As thex-axis of the APD function was set in dBm, we transformed the power inE-field strength by using theE-field probe calibration curve. Since the choice of histogram bin size may affect the accuracy of the statistics, we use here a bin size of 15.1 ns, which is an excellent capability. The root mean square (rms) values of E-field strengths were finally calculated, Erms. For each displayed trace, the instrument provides the mean and the peak values.
The rate of average IED accumulation in air (fluence), in the measurement point, for different mobile applications, was then calculated. Practically, we computed the IPD based solely on E-field strength values, and then applied cumulating function (in time) over IPD to gain the fluence expressed in J/m2. The next definitions were used:
IP D= E 2
Z0
(1)
whereE is the electric field strength value, and Z0 is the characteristic impedance of free space.
IED= t2
t1
IP D(t)∗dt (2)
wheret is the time, and integration duration has the limits t1 and t2.
3. RESULTS AND DISCUSSION
Figure 2 shows the average and peakE-field strengths dynamics with 1 minute duration of running the five different wireless applications in LTE communication standard, in a point in air situated at 5.4 cm distance from the mobile phone surface, above the center of the loudspeaker. While notable differences are observed when reporting average values per wireless application, the peak field strengths are very similar during all five applications (except downloading). Video call among them presents the highest average field strength and has the most dynamic amplitude in time, generally at least 2.5 times higher than all the other four investigated. The lowest mean exposures are attributed to voice calling and to downloading files. If comparing mean field strengths with peak field strengths, the last ones are 3–10 times larger, in general. However, peak values have a more restricted variance, not depending on the application type.
(a) (b)
(a) (b)
Figure 3. Boxplots of the (a) average and (b) peakE-field levels distribution at 5.4 cm distance from the phone display (in air) during one-minute use of different applications.
(a) (b)
Figure 4. The time-evolution of (a) average and (b) peak electromagnetic fluence in air, in the measurement point, for different mobile applications.
Boxplot representations in Fig. 3 highlight the most dynamic and most stationary radiated signal levels: video call presents the most spread field strength values, both as average and as peak values. Mean and median values of average and peak strengths are also the highest for video call, while file download is at the opposite side. If we consider two applications in which the user puts the terminal in contact to the head, classical voice call and VoLTE respectively, then we observe that even if peak levels and dynamics are practically the same, the average values are different. From this perspective, it is safer for the user to choose classical voice call instead of VoLTE, which radiates 30% more intensely in terms of average E-field strength levels.
Correlation coefficients for the strings of data corresponding to average and peak values of the field levels are as follows: 0.49 — Call, 0.56 — VoLTE, 0.38 — Video call, 0.56 — Download, 0.61 — Streaming. Such coefficients clearly indicate the non-stationary nature of the 4G radiated signals.
0.6 V/m in this position. The estimation was based on theoretical decrease with the square of distance. During a video call, a phone positioned at a distance of 40 cm from the head is a realistic one. If such fields are considered to impinge the head of the user, they will penetrate the skull (with bone tissue), and inside, just beneath the limit air-skull the SAR can be calculated theoretically, following the formula:
SAR= σ∗E 2 int rms
ρ (3)
whereσ is the electric conductivity of the tissue,Eint rms2 the rms electric field strength inside the tissue, and ρ the mass density of the tissue. Eint rms2 was simply calculated considering the most defavorable case, when the incident E vector (Eair) was perpendicular to the air-tissue interface, and the interface was plane. The transmission is ruled by the relation:
Eair =r∗Eint rms (4)
whereεr is the relative permittivity (real part) of the tissue.
A median SAR value of the order of 10−7W/kg and a peak SAR of the order of 10−5W/kg were obtained. Such SAR values are indeed too low to be taken into account. For the simplified dosimetric assessment just considered, we used the next values, valuable at 1.93 GHz for bone cortical tissue:
εr= 11.7,σ = 0.29 S/m, andρ= 1908 kg/m3.
Using the ratio of the surface temperature elevation to the IPD for a one-dimensional tissue model-skin (i.e., assuming plane wave exposure that is uniform over the entire tissue boundary), based on data in [7], we could further estimate the temperature increase. From Fig. 3, for a median field strength of 6.1 V/m — obtained during video call, an IPD of 0.099 W/m2 is gained, which results in an increase of 4×10⁻⁴deg C temperature. Similarly, for a 33 V/m peak value, the IPD is of 2.89 W/m2, which results in a 0.012 deg C peak temperature increase. Using the ratio of the surface temperature elevation to the IPD for a dipole antenna situated 5.4 cm from the tissue, the temperature increase was calculated to be half in both cases. In conclusion, the rapid dosimetric estimations clearly show that such field strengths are completely inoffensive for humans, if we consider just the thermal-based effects, as in the standards in use today.
Figure 4 representation however deserves a separate discussion. It shows the accumulation of fluence in time while running various wireless applications, and we underline that it is for the first time applied as a metrics in RF exposimetry, here. It demonstrates to successfully give indication on the deposition rate of the energy transmitted from the air to the body when using a wireless terminal. The use of momentary and average slopes of the IED curves of the type represented in Fig. 4 highly increases the sensitivity of generating personal usage profile expectations. For example, Fig. 4(a) highlights information that is available only by such a representation: voice call and VoLTE may reverse the slope trend at some moment in time (second 13th) during wireless application use. Moreover, both Figs. 4(a) and 4(b) indicate the speed with which the incident RF energy accumulates per running application during time and can provide the moment when a user will become more exposed due to one or another application. Such amplitude-time information will be of even greater value with the deployment of 5G user devices.
Figure 5. The total electromagnetic energy density accumulation in air, at 5.4 cm distance from the terminal’s display, after one-minute use of different mobile applications: average values (red/bars) and peak values (blue/points).
4. CONCLUSIONS
With the increase in frequencies in the GHz range from the 4G towards 5G mobile communications generation standards, the need for tailored methods to better describe human exposure to the near-body emitted radiation exceeded the framework of standards in use until 2019. Since scarce realistic description of amplitude-time behavior of radiated field strengths from mobile phones is present in the literature, it was the main objective of present work to demonstrate the versatility of an original method. Practically, by using a near-field electric field probe and a real-time spectrum analyzer, we described the electromagnetic energy accumulation in air, in the proximity of a mobile terminal running different wireless applications in LTE standard on 1.93 GHz and in a 10 MHz bandwidth. The method is based on using the amplitude probability density function capability of a real-time spectrum analyzer and on computing the integrated energy density in air (at incidence to the body).
The method proves to have a high agility in tracing the microsecond variability of emitted power level, since 441 samples could be captured during the period of power level change of the LTE standard signal. Then, the statistics of signals with non-Gaussian behavior was applied, conducted at the end to an accurate classification of the energetic prints of the run applications. Not only are the average and peak energy densities with their distributions available, but also the momentary rate of incident energy accumulation in time and the total deposited energy density can be calculated after using a well-defined period of one application. In this way, predictions of real usage profiles can be obtained. Also, with the collected and processed data, and based on the literature, we could further estimate superficial temperature increase in tissues, for signals with small penetration depth.
From the five tested wireless applications, it is shown that video call generates the highest human exposure, mainly when reporting average incident electric field strengths (10 V/m at 5.4 cm from the terminal’s surface). Peak levels of field strength are very similar for all five applications, varying around 23 V/m. The largest variations in time were recorded during video call and VoLTE applications running. The rate of energy accumulation in air was very different per application for average values, while for peak values only small differences were revealed. Overall, the total electromagnetic energy density accumulation in air during one minute use of an application was more than 6 times higher in the case of video call than for all the others. This parameter descended in order from video call, to live streaming, VoLTE, voice call, and downloading.
REFERENCES
2. IEEE-C95.1, “IEEE standard for safety levels with respect to human exposure to radio frequency electromagnetic fields, 3 kHz to 300 GHz,” IEEE, NY, USA, 2005.
3. World Health Organization, “Electromagnetic fields and public health: Mobile phones,” Accessed: October 2014, Available from: http://www.who.int/mediacentre/factsheets/fs193/en/.
4. IEEE-C95.1, “IEEE standard for safety levels with respect to human exposure to radio frequency electromagnetic fields, 3 kHz to 300 GHz,” IEEE, NY, USA, 2019.
5. Belyaev, I., Duration of Exposure and Dose in Assessing Nonthermal Biological Effects of Microwaves, Dosimetry in Bioelectromagnetics, 171–184, CRC Press, Florida, 2017.
6. Mortazavi, S. M. J., S. A. R. Mortazavi, and M. Haghani, “Evaluation of the validity of a nonlinear J-shaped dose-response relationship in cancers induced by exposure to radiofrequency electromagnetic fields,”J. Biomed. Phys. Eng., Vol. 9, No. 4, 487–494, 2019.
7. Funahashi, D., A. Hirata, S. Kodera, et al., “Area-averaged transmitted power density at skin surface as metric to estimate surface temperature elevation,” IEEE Access, Vol. 6, 77665–77674, 2018.
8. Foster, K., M. C. Ziskin, Q. Balzano, et al., “Thermal analysis of averaging times in radio-frequency exposure limits above 1 GHz,” IEEE Access, Vol. 6, 74536–74546, 2018.
9. Foster, K. R., M. C. Ziskin, Q. Balzano, et al., “Modeling tissue heating from exposure to radiofrequency energy and relevance of tissue heating to exposure limits: Heating factor,” Health Phys., Vol. 115, 295–307, 2018.
10. “International Commission on Non-Ionizing Radiation Protection Draft — ICNIRP Guidelines, guidelines for limiting exposure to time-varying electric, magnetic and electromagnetic fields (100 kHz to 300 GHz),” July 11, 2018.
11. Gandhi, O. P., “Microwave emissions from cell phones exceed safety limits in Europe and the US when touching the body,”IEEE Access, Vol. 7, 47050–47052, 2019.
12. Mat, M. H., M. F. B. A. Malek, W. G. Whittow, S. H. Ronald, M. S. Zulkefli, N. Saudin, and L. Mohamed, “The influence of human head model wearing metal-frame spectacles to the changes of SAR and antenna gain: Simulation of frontal face exposure,” Progress In Electromagnetics Research, Vol. 137, 453–473, 2013.
13. Bhargava, D., N. Leeprechanon, P. Rattanadecho, and T. Wessapan, “Specific absorption rate and temperature elevation in the human head due to overexposure to mobile phone radiation with different usage patterns,” International Journal of Heat and Mass Transfer, Vol. 130, 1178–1188, 2019.
14. Chobineh, A., E. Conil, and J. Wiart, “A comparison between the exposure induced by circuit switched, VoIP and VoLTE calls,” BIOEM Conference, Abstract Book, Montpellier, June 23–28, 2019.
15. Krayni, A., A. Hadjem, A. Sibille, et al., “A novel methodology to evaluate uplink exposure by personal devices in wireless networks,” IEEE Trans. EMC, Vol. 58, No. 3, 896–906, 2016.
16. Paljanos, A., S. Miclaus, P. Bechet, and C. Munteanu, “Assessment of mobile phone user exposure to UMTS and LTE signals: Comparative near field radiated power levels for various data and voice application services,” Journal of Electromagnetic Waves and Applications, Vol. 30, No. 9, 1101–1115, 2016
17. Sarbu, A., A. Bechet, T. Balan, D. Robu, P. Bechet, and S. Miclaus, “Using CCDF statistics for characterizing the radiated power dynamics in the near field of a mobile phone operating in 3G+ and 4G+ communication standards,”Measurement, Vol. 134, 874–887, 2019
18. Chrissan, D. A. and A. C. Fraser-Smith, “A comparison of low-frequency radio noise amplitude probability distribution models,” Radio Sci., Vol. 35, No. 1, 195–208, 2000.
19. Matsumoto, Y., K. Gotoh, and T. Shinozuka, “A method for converting amplitude probability distribution of disturbance from one measurement frequency to another,” IEICE Trans. Comm., Vol. 91-B, No. 6, 2010–2019, 2008.