Scholarship@Western
Scholarship@Western
Electronic Thesis and Dissertation Repository
9-15-2016 12:00 AM
Microstructural Geochronology of Zircon Across the Central Uplift
Microstructural Geochronology of Zircon Across the Central Uplift
of the Vredefort Impact Structure, South Africa
of the Vredefort Impact Structure, South Africa
Connor Lawrence Davis The University of Western Ontario Supervisor
Dr. Desmond Moser
The University of Western Ontario Graduate Program in Geology
A thesis submitted in partial fulfillment of the requirements for the degree in Master of Science © Connor Lawrence Davis 2016
Follow this and additional works at: https://ir.lib.uwo.ca/etd Part of the Geology Commons
Recommended Citation Recommended Citation
Davis, Connor Lawrence, "Microstructural Geochronology of Zircon Across the Central Uplift of the Vredefort Impact Structure, South Africa" (2016). Electronic Thesis and Dissertation Repository. 4185. https://ir.lib.uwo.ca/etd/4185
This Dissertation/Thesis is brought to you for free and open access by Scholarship@Western. It has been accepted for inclusion in Electronic Thesis and Dissertation Repository by an authorized administrator of
The Vredefort central uplift, or ‘dome,’ represents the erosional remnant of one of the largest
(~300 km diameter) and oldest (~2.020 Ga) terrestrial impact structures. This investigation
was performed to help elucidate the complexity of the shock process on zircon, incorporating
various electron beam methods, including BSE and SE imaging, EBSD, CL, and EDS
(mapping and semi-quantitative compositional analysis). A new shock microstructural
progression in terrestrial zircon is suggested, as well as a complete structure-wide analysis of
impact melt inclusions in zircon. Regional trends in the effects of shock on zircon are
included. Impact melt glass inclusion compositions vary widely, from felsic to mafic
inclusions, and are related to the partial melting of local minerals. This study is significant
for the future study of similar impact structures on other rocky planets, and the quantification
and qualification of shock conditions as recorded in zircon.
Keywords
Vredefort impact structure, zircon, impact melting, shock microstructures, shock
metamorphism, impact melt glass inclusions.
ii
Acknowledgments
First and foremost, I would like to acknowledge Desmond Moser for his incredible support
and guidance over the past two years. His passion and insight into the geology of Vredefort
has been invaluable to the success of my thesis. I sincerely thank Des for providing me the
opportunity to do field work in South Africa, and for all the other opportunities to attend
conferences, field camps, and extracurricular courses. Thank you also for the help in editing
and tying this thesis together.
I would also like to thank Ivan Barker, who’s technical assistance in the ZAPLab was
instrumental to my success. Thank you for putting up with my questions, and always being
there to help me figure out the numerous issues we encountered.
I appreciate the help of the ASTRO-CSA group for funding some of my conference travel,
such as the ASTRO short course in Edmonton, AB. I am also thankful for all the other field
trips I was a part of, including Oman, southwest U.S., and across Canada. It was the
opportunities like this that truly made my graduate experience.
I thank the members of my thesis defense committee, Sean Shieh, Robert Klassen, and Kim
Tait, for their efforts in critiquing my thesis. Thank you also to the defense chair, Bill
Church.
I could not have gotten through the last two years without the support of my friends and
family. Thank you to my family, Rita, Jim, and Corrin, whose support has been so important
to me. Thank you to all my fellow graduated (and soon to be) Western friends, specifically
Marcus, Taylor, and Diego, as well as many others. The practical jokes will never be
forgotten. And finally, thanks, Obama, for providing the inspiration to rise above and prove
iii
Table of Contents
Abstract ... i
Acknowledgments... ii
Table of Contents ... iii
List of Tables ... vii
List of Figures ... ix
List of Appendices ... xvi
1 Introduction ... 1
1.1 Introduction ... 1
1.2 The importance of impact cratering ... 3
1.3 The impact cratering process ... 4
1.3.1 The shock wave... 4
1.3.2 Stage 1: Contact and Compression ... 5
1.3.3 Stage 2: Excavation... 6
1.3.4 Stage 3: Modification and collapse ... 7
1.3.5 Types of impact craters ... 7
1.3.6 Impact Melting ... 10
1.4 The Vredefort impact structure, South Africa ... 11
1.4.1 Geology of the Vredefort central uplift or ‘dome’... 13
1.4.2 Evidence of an impact origin for Vredefort ... 16
1.4.3 Shock microstructures in quartz and other minerals ... 18
1.5 Zircon ... 20
iv
1.5.2 Melt inclusions in zircon ... 25
1.5.3 Alkali mobility in glasses under an electron beam ... 26
1.5.4 Geochronology of zircon ... 27
1.6 Sample Suites ... 28
1.7 Overview of thesis ... 29
1.8 References ... 31
2 Microstructural evolution of in-situ zircon across the central uplift of highly shocked Archean crust at the Vredefort impact structure, South Africa ... 41
2.1 Introduction ... 41
2.1.1 Shock metamorphic studies of quartz and other rock-forming minerals .. 42
2.1.2 Zircon shock microstructures ... 44
2.1.3 Purpose of this study ... 46
2.2 Geological Setting ... 47
2.3 Methods & Sample Locations ... 48
2.3.1 Methods... 48
2.3.2 Sample Locations ... 49
2.4 Results ... 50
2.4.1 Shock microstructures across the core-collar transect ... 50
2.4.2 Proportions of pre-impact and shock-related features in zircon populations ... 67
2.4.3 Types of shock-related features in zircon populations ... 70
2.5 Discussion ... 73
2.5.1 Proportion of pre-impact and shocked zircon features in impacted crust . 73 2.5.2 Microstructural evolution... 75
2.6 Conclusion & Scientific Implications ... 86
v
3 Impact melt glass inclusions in zircon from the central uplift of the Vredefort impact
structure, South Africa ... 94
3.1 Introduction ... 94
3.2 Geological Setting & Background ... 95
3.3 Zircon and melt inclusions ... 96
3.4 Samples & Standards ... 98
3.5 Methods... 100
3.6 Results ... 101
3.6.1 Methodology development ... 101
3.6.2 Results of FEG-SEM analysis ... 106
3.7 Discussion ... 124
3.7.1 Nature of IMG inclusions across the Vredefort central uplift ... 124
3.7.2 Source of IMG inclusions ... 125
3.7.3 IMG inclusion formation and preservation mechanisms ... 130
3.8 Conclusions ... 135
3.9 References ... 137
Chapter 4 ... 143
4 Discussion & Conclusions ... 143
4.1 Introduction ... 143
4.2 Shock microstructural progression in zircon ... 143
4.2.1 Applications to deciphering the stages of the impact process ... 144
4.3 Zircon as a quantitative scale of the shock process ... 145
4.4 Impact melt glass inclusions in zircon ... 146
4.5 Zircon as a dominant shock indicator mineral ... 148
4.5.1 Zircon as an archive of shock microstructures ... 148
vi
4.5.3 Usefulness of zircon as a U-Pb geochronometer for the dating of impact
events ... 150
4.6 Implications of this study on the search for and study of ancient impacts ... 151
4.7 Recommendations for future work ... 152
4.8 References ... 153
Appendices ... 155
Sampling ... 155
Sample Preparation ... 155
Standard Preparation ... 157
Optical Petrography ... 157
vii
List of Tables
Table 2-1: Analysis conditions for the shock survey and backscatter electron & secondary
electron (BSE/SE) imaging, cathodoluminescence (CL), electron backscatter diffraction
(EBSD), and energy dispersive spectroscopy (EDS). Advanced EBSD parameters are found
in Appendix A. ... 49
Table 2-2: Sample list indicating lithology type, sample type, distance from the currently
accepted centre of impact (~4km N of Inlandsee Pan), and coordinates in UTM. ... 50
Table 3-1: Samples included for impact melt glass inclusion analysis. Included in this table
are the sample number, sample type, distance from the center of impact, and UTM
coordinates. ILG=Inlandsee Leucogranofels, OGG=Outer Granite Gneiss. *=samples
included in compositional and in-depth microstructural analysis. ... 98
Table 3-2: Table displaying the elements standardized in this study, and their corresponding
glass standard reference. Glass standard sources are SPI supplies, C. M. Taylor Company,
and Jarosewich (2002). Mineral standards were built-in standards within the SEM... 100
Table 3-3: Hitachi SU6600 FEG-SEM analysis conditions. Advanced EBSD parameters are
provided in Chapter 1... 101
Table 3-4: Advanced settings used for EDS mapping and semi-quantitative EDS analysis.
Variable magnification was used. ... 105
Table 3-5: V2-1 semi-quantitative EDS results of four representative inclusions. Inclusions 1
and 2 are the dominant Mg (+Fe) aluminosilicate inclusion. Incl. 3 is the less common K
aluminosilicate inclusion. Incl. 4 is the composition found along very tiny ovoid inclusions
(Na-Ca) aluminosilicate. Standard deviation (2σ) provided. ... 118
Table 3-6: V09-237 semi-quantitative EDS results of three representative inclusions. Incl. 1
is the Na-rich inclusion, incl. 2 is the K-rich inclusion, and incl. 3 is a mixed component with
both Na and K, likely due to beam impingement on multiple inclusion compositions.
Inclusions are denoted in Figure 3-13c. Estimated inclusion composition abundances are
viii
Table 3-7: V2-1 comparisons of impact melt glass inclusions vs. ideal source mineral.
Mineral wt. %’s are taken from standard minerals (SPI supplies, Smithsonian Microbeam
Standards). Hypersthene differences are likely due to Al-Si and Fe-Mg substitution. Slight
plagioclase differences are due to solid solution between Na-Ca. Analyses errors given at 2 σ.
... 127
Table 3-8: V09-237 comparison of impact melt glass inclusions vs. ideal source mineral.
ix
List of Figures
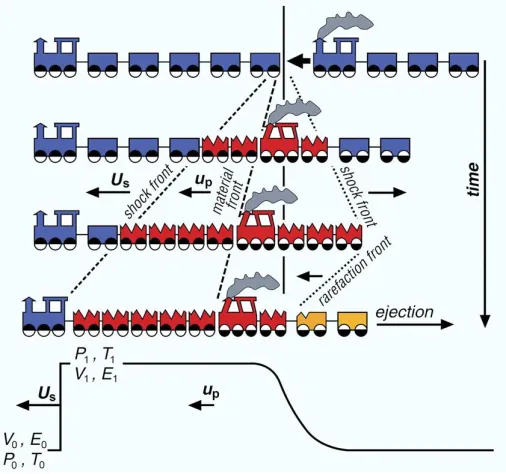
Figure 1-1: A visual aid used to describe the progression of a shock wave. The two blue
trains are used to show the target and impactor, which, upon collision, releases a roughly
hemispherical shock wave, known as the shock front. This shock front travels through the
target, subsequently moving the material front forwards. The shock front also moves
backward into the impactor, until it reaches the other side of the impactor, where it
transforms into a rebounding rarefaction front that acts to decompress the impactor and target
material, leading to the vaporization, melting, and ejection of that material (Langenhorst,
2002). ... 5
Figure 1-2: Example of a simple crater at Meteor Crater, Arizona. Note the absence of a
prominent central uplift and the relatively small diameter of the crater. Photo taken in
October, 2014 (C. Davis). ... 8
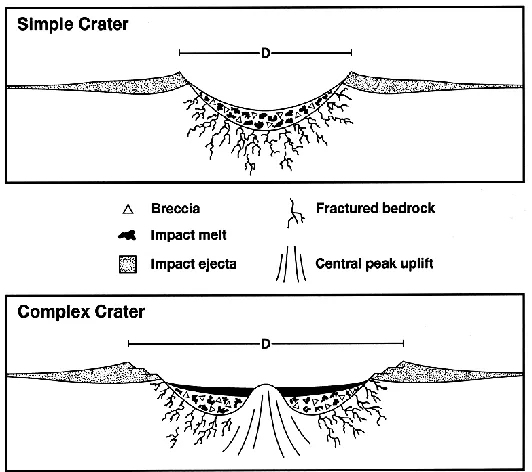
Figure 1-3: Simple crater vs. complex crater morphology (NASA, 2004). ... 10
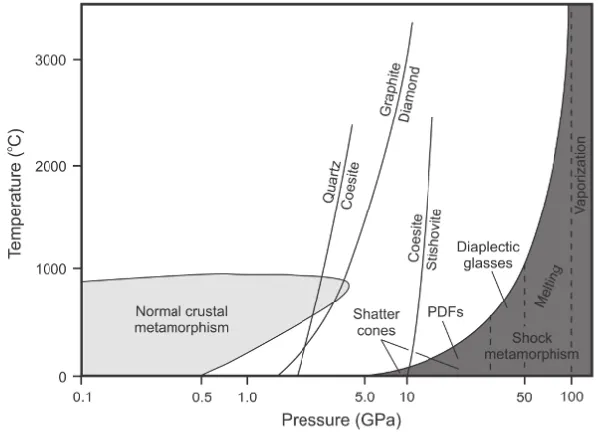
Figure 1-4: P-T plot displaying the shock pressure and temperatures necessary for shock
melting, in comparison with 'normal crustal metamorphism.' (Osinski & Pierazzo, 2013). .. 11
Figure 1-5: Map indicating the location of the Vredefort dome within the greater
Witwatersrand Basin (Fagereng et al., 2008)... 12
Figure 1-6: A visual depiction of local geology at the site of the Vredefort impact A)
pre-impact (pre-2.020 Ga), B) immediately after modification (~2.020 Ga), and C) at the present
level of erosion. Stratigraphic units are not to scale, and these images are only to be used as a
rough guide. Images modified from Oggmus (2014). ... 13
Figure 1-7: Shock evidence at Vredefort, including: a) petrographic image of quartz PDF’s
(Grieve et al., 1990), b) granophyre (Davis, 2014), c) pseudotachylite (Davis, 2014), d) BSE
image of impact ejecta spherules (Huber et al., 2014), e) shattercones (Hargraves, 1961), and
x
Figure 1-8: Geologic bedrock map of Vredefort impact structure, South Africa, showing the
locations of samples used in this study. Map adapted from Moser et al. (2011) and Grieve et
al. (1977). ... 29
Figure 2-1: Bedrock geology map of Vredefort central uplift, South Africa, showing
locations of samples, and centre of impact. Map adapted from Moser et al. (2011), geology
modified from Nel (1921) and stages of quartz recrystallization (1-4) from Grieve et al.
(1990). ... 43
Figure 2-2: Shocked zircon F397 from V15-55, showing two orientations of planar fractures
(white arrows) and some more typical irregular cracking due to differential expansion due to
metamictization. ... 51
Figure 2-3: V-62 F3313 a) CL image showing zonation and shock microstructures, b) inset
BSE image showing planar features, twins, and IMG inclusions (dark), c) EBSD
misorientation map with microtwins outlined in red. ... 53
Figure 2-4: V15-56 F3037 A) SE image, B) BSE image showing curviplanar features and
annealed planar fractures delineated by impact melt glass inclusions (with pod of melt in the
middle of the grain), and a displaced curviplanar feature. Note the absence of microtwins.
This grain is not typical of the main population. ... 54
Figure 2-5: a) BSE image of V15-46 F725 showing multiple compositions of IMG
inclusions, b) CL image showing relatively undisturbed zonation, c) EBSD misorientation
map showing amorphous (metamict) zones and planar features. ... 55
Figure 2-6: V15-46 F24565 a) SE image and b) BSE image showing pervasive melt along
planar and curviplanar features. ... 55
Figure 2-7: V2-1 F3655 a) BSE image displaying impact melt inclusions tracing twins and
curviplanar features, b) CL image showing undisturbed zonation, c) EBSD misorientation
map with microtwins outlined in red, white arrow indicates PDB kinks, d) inset EBSD IPF
xi
Figure 2-8: V49-1 F3481 a) SE image, b) BSE image, c) CL image, and F3890 d) SE image,
e) BSE image, and f) CL image. White arrows indicate displacement zones. ... 59
Figure 2-9: V15-16 F36 a) BSE image where planar deformation band ‘twists’ are slightly
detectable, b) CL image showing relatively undisturbed zonation, c) EBSD misorientation
map showing up to ~14° misorientation with associated pole figures (left), and d) IPF map
with associated pole figures (right). Figure displays interesting shock-induced ‘planar
deformation twist bands’ emanating from exteriors of grains, as well as a conjugate set of
microtwins (Fig. c, outlined in red). ... 60
Figure 2-10: V15-16 F279 a) CL image showing bright areas around curviplanar
feature-hosted impact melt glass inclusions, b) EBSD misorientation map showing up to 12° of
misorientation mostly accommodated in zircon ‘planar deformation twist bands’ emanating
from exterior of grain. These twist bands are inferred across the zircon grain. c) EBSD
misorientation map of zoom-in from b), showing twist-band morphology. ... 61
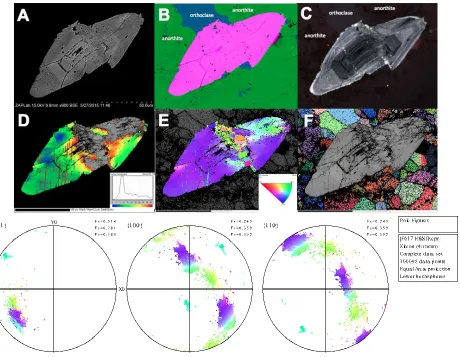
Figure 2-11: V15-16 F617 a) BSE image showing IMG inclusions, b) EDS map image
(pink=Zircon, blue=orthoclase, green=anorthite) showing intersection of different phases at
approximate location of displaced zircon boundary, c) CL image indicating brighter CL
response along displaced, recrystallized boundary, d) EBSD misorientation map showing
microtwins (red line) and up to 20° misorientation, e) EBSD inverse pole figure map
showing microtwins (light blue lines), a heavily recrystallized displacement zone, and a zone
of planar microstructures (upper right), including associated pole figures, below, f) euler
angle map of anorthite and orthoclase, outlining triple junctions that are comparable to triple
junctions in recrystallized displacement zone in zircon. ... 62
Figure 2-12: V15-39 F6348 a) BSE image, b) CL image, c) EBSD misorientation image, d)
F5913 BSE image, e) F5627 BSE image showing sinistral (left-lateral) displacement. The left
half of the grain appears to be missing, f) baddeleyite BSE image, g) EDS map of baddeleyite
BSE image, g) EDS map of baddeleyite with zircon and quartz surrounding. ... 64
Figure 2-13: a) V15-45-1 hand sample, b) Recrystallized quartz grains, typical of ILG rocks
xii
circles), and baddeleyite (blue circles) within quartz glomerogranules (orange). Blue is
orthoclase and red is plagioclase... 66
Figure 2-14: BSE images of three V15-45-1 zircon grains showing the variance in levels of
recrystallization, from a) minor recrystallization, primary zonation remaining largely intact,
b) displacement and the beginning of relatively undeveloped granularization, and c) complete
granularization into a coarsely polycrystalline zircon. ... 66
Figure 2-15: V15-45-1 F445 a) SE image, b) BSE image with inset zoom image showing
compositional dichotomy between core and rims of zircon granules, c) EDS map showing
plagioclase (green), orthoclase (blue), quartz (red), and zircon (pink), d) CL image that
displays the newly formed zonation patterns in individual granules. ... 67
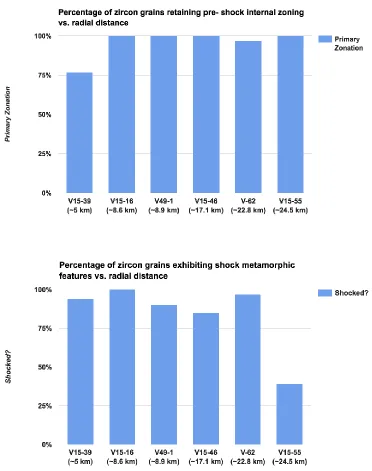
Figure 2-16: Bar graphs showing the percentage of zircons retaining at least partial domains
of primary zonation patterns and those that are ‘shocked’ from samples across the Vredefort
central uplift. ... 69
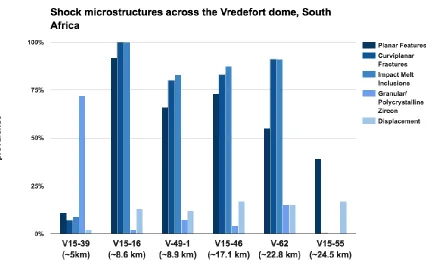
Figure 2-17: Bar graph displaying the percentage of each microstructure from the largest
40-50 grains of each sample. The line represents the trend of decreasing planar feature
prevalence with increasing distance from the centre. The dotted line represents a rough
estimate of planar feature prevalence in V15-39 if it did not undergo post-shock
recrystallization. ... 70
Figure 2-18: Regional cross-section map indicating location of samples as a function of
radial distance and estimated pre-erosion depth. Estimated shock temperature (°C) and
pressure (GPa) at ~400s post-impact are also shown on the diagram. Modified from Ivanov
(2005), Gibson & Reimold (2008), Moser et al. (2011). ... 83
Figure 2-19: Pressure-time diagram showing shock pathways of a) a standard zircon from the
“hot-shock” zircons (i.e. V15-45-1, V15-39, V2-1, V15-16), and b) a standard zircon from the “cold-shock” zircons (i.e. V15-46, V15-56, V-62). Modified from Timms et al. (2012). 84
Figure 2-20: Microstructural progression in zircon from the Vredefort impact structure. a)
Representative zircon from the core (i.e. V15-45-1), b) representative zircon from
xiii
listed, and colors identify the various mechanism for the formation of each microstructure:
yellow=microstructures formed by initial shock compression, green= microstructures formed
by rarefaction wave and decompression, blue= microstructures formed by crater
modification, red=microstructures formed by high post-shock temperatures. ... 85
Figure 3-1: Geologic bedrock map of Vredefort impact structure, South Africa, showing the
locations of samples used in this study. Map adapted from Moser et al. (2011) and Grieve et
al. (1977). ... 99
Figure 3-2: Schematic showing the difference in interaction volume (red) between 10 kV and
7 kV accelerating voltages. With 10 kV, a significant component of surrounding zircon
would be included in impact melt glass inclusion (IMG) analysis. 7 kV acts to eliminate this
zircon component. ... 104
Figure 3-3: Na-loss in five different spots on the K-373 standard. Three repeat analyses (5
seconds each) were performed to mimic the impact melt glass inclusions analysis. Na shows
a distinct decline in weight % over time, however the values are essentially negligible for the
purposes of this study... 106
Figure 3-4: a) BSE image of V15-55 zircon grain displaying some planar fracturing but no
IMG inclusions, b) and c) BSE images of zircons F24565 and F725, respectively, from
pseudotachylite rich showing chains of elongate and ovoid IMG inclusions, and some filling
fractures, d) BSE (zoom) image of V15-45-1 F445 showing coarse granular texture zircon
without IMG inclusions. ... 107
Figure 3-5: Bar graph displaying the percentage of each microstructure from ~50 grains of
each sample. ... 108
Figure 3-6: Electron beam data for V-62 F3440 a) SE image showing network of fractures
and planar features in-filled with a secondary phase, b) BSE image indicating a low density
(average Z) for the phase infilling fractures c) CL image showing primary igneous trace
element zoning cross-cut by microtwins (linear zones of lower intensity), d) EBSD
misorientation map image showing crystal plastic deformation, “bent” microtwins (red
lines), local planar subgrain boundaries off-setting twins, and amorphous (black) inclusions ,
xiv
and f) EBSD band contrast map showing high quality diffraction for zircon and aegerine
except in zones of planar features. ... 111
Figure 3-7: V-62 F3340 EDS map showing zircon (purple), aegerine (NaFeSi2O6) (red), and
a Na-Al-Si-O phase (green) around the margins of the zircon and infilling fractures in zircon
and aegerine. Orange is also Na-Al-Si-O, but appears to be the mineral constituent
contributing to the melted phase (likely plagioclase). There does appear to be a slight
difference in the amount of Al between the melt and surrounding mineral. ... 112
Figure 3-8: Electron beam data for V-62 F123 a) SE image showing similar inclusions and
shock features in zircon and surrounding aegerine, b) BSE image showing polygonal melt
inclusion domains, c) EDS map with purple=Zr representing zircon, red=Na representing
aegerine, and black/dark green=Na+Al, representing plagioclase melt within aegerine and
zircon, d) colour CL image. Note planar and curviplanar bright features perhaps relict
annealed fractures. They coincide with chains of impact melt glass inclusions. ... 113
Figure 3-9: Electron beam data for V2-1 F3655 a) SE image, b) BSE image showing low
density, c) CL image, showing pre-impact igneous core and metamorphic rim cross-cut by
lighter CL traces along features containing inclusions,, d) EBSD misorientation map showing
microtwins (red lines), melt inclusions (black), and misorientation across the zircon. Note
that some black (non-indexed) domains are high-U metamict domains (also black in CL) . 115
Figure 3-10: Electron beam data for V2-1 F3655 a) BSE image indicating the morphological
differences between impact melt pods, abundant submicron-μm sized ovoid IMG inclusions,
and primary inclusion variably replaced by impact melt, b) zoom-in EBSD inverse pole
figure image showing different crosscutting microtwins (pink and yellow), as well as
amorphous inclusions (black), c) EBSD misorientation map showing twins with different
sizes, and inclusions (black). EBSP’s of high-quality zircon and amorphous inclusions are
inset. ... 116
Figure 3-11: EDS mapping of V2-1 zircon F3655 a) EDS map of zircon (white) and matrix
minerals, red=Na, green=K, purple=Mg(+Fe) showing melt inclusions compositions are
xv
are shown below. b) inset image showing melt inclusions. Inclusions 1-4, as they relate to
Table 3-5, are denoted... 117
Figure 3-12: Electron beam data for V09-237 grain 4 a) BSE image, b) CL image, c) EBSD
misorientation image, d) EBSD inverse pole figure image. Pole figures are shown on the
stereonets on the right. Figure from Moser et al. (2011). ... 120
Figure 3-13: Electron beam data for V09-237 grain 4 a) SE image of IMG inclusions tracing
annealed curviplanar features within zircon, b) EBSP indicating high-quality zircon pattern,
and c) EBSP of an amorphous IMG inclusion. ... 120
Figure 3-14: EDS map of V09-237 Grain 4 a) full-scale map of zircon, showing melt
inclusions of various compositions, b) inset image showing melt inclusions in the lower right
portion of the grain, c) zoomed-in inset image showing how melt inclusions change
composition along strike. Inclusions, as they relate to Table 3-6, are denoted. Pink=Zr,
green=K, purple=Na. ... 122
Figure 3-15: a) ternary diagram of V2-1 melt inclusion compositions, and b) ternary diagram
of V09-237 melt inclusion compositions. Ternary diagrams created with Trinity software. 129
Figure 3-16: Total alkali vs. silica (TAS) diagram adapted from Cox et al. (1979);
Pompa-Mera et al. (2013). This diagram plots the various inclusion compositions found in V2-1
(green) and V09-237 (red) on plutonic classification diagram. Na-rich inclusions fall on
diagram, but K-rich inclusions in both V2-1 and V09-237 fall on the “alkaline” chart. Mafic
inclusions from V2-1 are found at the bottom of the chart due to lack of alkalis. Estimated
xvi
List of Appendices
Appendix A: Detailed Methodology ………154
Appendix B: Sample
Locations……….165
Appendix C: Sample
Descriptions………....167
Appendix D: Shock Survey
Results………...179
Appendix E: Quantitative Energy Dispersive Spectroscopy
Results………...185
Appendix F: Energy Dispersive Spectroscopy Glass
Chapter 1
1
Introduction
1.1
Introduction
A fundamental principle of geology is that Earth was formed from gradual, endogenic
processes occurring over an appreciable amount of geological time. This concept, aptly
named uniformitarianism, was proposed by James Hutton in 1785, and later popularized
by Charles Lyell. Starkly distinguishable from catastrophism, the popularity of
uniformitarianism pushed the scientific community away from the study of catastrophic
processes such as impact cratering. It may come as some surprise, then, that Alfred
Wegener (the architect of the plate tectonic theory, a distinctly gradual process) was one
of the first to publish his belief that the familiar craters on the lunar surface were of an
exogenic, impact origin (Wegener, 1921). Still, it was not until relatively recently that
impact cratering, and catastrophism as a whole, became recognized by the geological
community as a significant contributing process to the formation of the inner solar
system. This relatively newfound interest has been encouraged by the notion that large
impacts have also played an important role in Earth’s biological evolution, as
demonstrated by the temporal relation between Mexico’s Chicxulub impact structure and
the Cretaceous-Paleogene (K-Pg), formerly known as the Cretaceous-Tertiary (K-T)
boundary extinction (Alvarez et al. 1980; Hildebrand et al. 1991; Vellekoop et al. 2014).
The key linkage between the boundary layer and the location of the impact crater was
established with dating of shocked zircon (Krogh et al., 1993).
Impact craters are roughly circular depressions in the surface of a solid planetary body,
solid target (French, 1998). Often confused with volcanic craters, impact craters are
differentiated by their raised outer rims, and a crater floor that is lower than the nearby
unaltered terrain. While impact craters may be easily recognizable on extraterrestrial
bodies such as the Moon, Mars and Mercury, significant tectonic and erosional activity
on Earth has masked many of the visual macro-scale indicators of an impact crater.
Predominantly due to extensive ocean cover (over 70% of the Earth is covered by water),
and the adverse effects of tectonics and erosion, there are only 188 confirmed impact
craters on Earth, situated primarily on the stable cratons of the Americas, Australia, and
Europe. Additionally, many of these craters are very young, such as the ~49 kyr Meteor
Crater, near Flagstaff, Arizona. The recent development of satellite imagery has
contributed greatly to the discovery of many new impact craters on Earth, however
diagnostic microstructural features are often the best way to confirm the presence of an
impact crater.
The precise chronology of impact events on planetary surfaces has implications for the
understanding of crustal and bio-evolution on Earth and other planetary bodies. U-Pb
isotopic dating of minerals such as zircon has proved valuable in the pursuit of an
improved impact chronology, as sufficient shock damage and heating can cause up to
100% Pb-loss while preserving microstructures diagnostic of specific shock
environments (Moser et al., 2011). Fitting such minerals into their corresponding crater
setting (in-situ) is also important to the success of crater studies. Unfortunately,
exploration projects to study craters on planetary bodies other than Earth are not currently
feasible. With the exception of rare meteorite finds and sample returns, it is very difficult
Terrestrial analogues are therefore quite useful to establish a calibration set for the effects
of cratering processes on minerals that can be applied in the rest of the inner solar system.
The Vredefort impact structure, South Africa, is a unique terrestrial analogue site. Its size
and morphology provide the best insight into the types of large, complex impact events
that played a role in the crustal evolution of planetary bodies in the state of the inner solar
system.
1.2
The importance of impact cratering
The evolution of the inner solar system has been immensely affected by impact cratering,
largely relating to a period of heavy bombardment early in Earth’s history (Late Heavy
Bombardment (LHB) ca. 3.9 Ga) (Ryder et al., 2000). It has been suggested that the Earth
would have experienced many more impacts than the lunar surface (Koeberl et al., 2006),
possibly as many as 1.3-1.5 times the impacts per unit area (Frey, 1980). Impact-driven
crustal evolution is responsible for the terrestrial surface we observe today, including the
origin of the dichotomy between the lower density continental and higher density oceanic
crust that is now maintained by modern plate tectonics (Frey, 1980). Biologically, this
intense period of impact cratering would have had significant effects as well. Despite the
obvious negative aspects of bombardment (i.e. impact-driven mass extinction), it is
believed that impacts also produced thermophilic niches that eventually gave rise to the
beginning of life on Earth (Pace, 1997). The early atmosphere was presumably affected
by a high impact flux during the LHB (Ahrens, 1993). Of course, making assumptions
about processes that would have shaped the crustal and biological profile of Early Earth
is relatively difficult without a rock record. This is why we look to other rocky surfaces,
to erosion or tectonism. Two prime examples are the lunar and Martian surfaces, where
the increased impact record provides an exceptional insight into the processes that would
have shaped the Early Earth. In fact, the very existence of the Moon is believed to be the
product of a collision between a Mars-sized impactor and Earth (Canup and Asphaug,
2001). Understanding the timing and magnitude of impacts on Earth is vital to piece
together the development of our inner solar system.
1.3
The impact cratering process
Impact cratering is a very complex process which is regionally and locally
heterogeneous.
This complexity is an important factor to consider when analyzing any data related to
impact cratering. Outlined in this section is a description of the major stages in the
progression of the impact cratering process.
1.3.1
The shock wave
The impactor generally does not penetrate very deeply in the target, perhaps penetrating
~1-2 times its diameter, dependent primarily upon on the impacting velocity and target
rock composition (Kieffer and Simonds, 1980; O’Keefe and Ahrens, 1982; Melosh,
1989). After the projectile has ceased its downward movement, the energy from the
initial impact is released as intense shock waves, which propagate radially throughout the
target rock at high velocities. The kinetics of the shock wave are illustrated in Figure 1-1,
below. The stages listed in the sections below are the product of the propagation of the
Figure 1-1: A visual aid used to describe the progression of a shock wave. The two blue trains are used to show the target and impactor, which, upon collision, releases a roughly hemispherical shock wave, known as the shock front. This shock front travels through the target, subsequently moving the material front forwards. The
shock front also moves backward into the impactor, until it reaches the other side of the impactor, where it transforms into a rebounding rarefaction front that acts to
decompress the impactor and target material, leading to the vaporization, melting, and ejection of that material (Langenhorst, 2002).
1.3.2
Stage 1: Contact and Compression
Stage 1 commences immediately at the moment of contact between the impacting
projectile and its target. As mentioned above, the projectile is unable to penetrate more
than 1-2x its diameter, and instead generates shock waves (Kieffer and Simonds, 1980;
O’Keefe and Ahrens, 1982, 1993; Melosh, 1989). Once the shock waves reach the top of
the projectile, they rebound or reflect off the surface and return as a rarefaction wave.
These rarefaction waves act to rapidly decompress the projectile, explaining why the
(French, 1998). The primary shock front, which may have original shock pressures of up
to or exceeding 100 GPa, attenuates quickly with distance; a result of both the decrease in
shock density with increasing hemispherical area upon expansion as well as the energy
lost to the target rocks through deformation and heating (French, 1998). A record of the
energy lost from the shock waves is often preserved as shock features.
At a distance defined primarily by the target rock composition and original shock wave
velocity, the shock waves will transform into elastic or seismic waves, travelling
approximately at the speed of sound (~5-8 km/s) and with pressures of ~1-2 GPa, which
are low enough to not cause significant shock transformation (Kieffer & Simonds, 1980).
The contact and compression stage ends when the release or rarefaction wave has passed
through the projectile and is at the contact between the projectile and the impacted
surface. This entire process typically takes a fraction of a second, even for large, complex
impact events (Melosh, 1989).
1.3.3
Stage 2: Excavation
The excavation stage commences directly after the completion of the contact and
compression stage. The excavation stage can be described as the stage where the crater is
actually formed, developing due to a number of complicated interactions between the
propagating shock and rarefaction waves and the original target surface (Melosh, 1989;
Grieve, 1991). For example, the reflected wave from the contact and compression stage is
converted into kinetic energy, which causes the affected rock to accelerate outwards as an
excavation flow. As long as the energy is high enough, the crater will expand to sizes of
up to 20-30x the size of the original projectile (French, 1998). Once the energy is low
excavation stage ends, and the near surface rocks are uplifted to form the crater rim. For
large craters (~200 km, in the realm of the size of Vredefort), this stage takes about 90
seconds to complete (Melosh 1989; French 1998).
1.3.4
Stage 3: Modification and collapse
As soon as the transient crater has reached its maximum diameter, the modification stage
commences. The beginning of the modification stage occurs when the expanding shock
waves transform into lower pressure elastic waves, forming the transient crater rim
(French, 1998). The degree of modifications to the transient crater is primarily a function
of the planet’s gravity and size of the transient crater itself. The most significant parts of
the modification stage, where the major structural transformations occur, typically take
less than one minute for small structures and as little as a few minutes for larger
structures (Melosh, 1989). Major post-impact modifications in a small, simple impact
crater are relatively absent, leaving the transient crater structure well preserved. In larger
complex craters, however, post-impact modifications are quite dramatic. Driven by
gravity, two primary modifications occur: the in folding and collapse of crater wall rocks,
mostly by down-faulting to infill the transient crater; and the uplift of rocks in the center
of the structure, called the central uplift. The end of the modification stage is difficult to
determine, as post-impact modifications can continue for millions of years, however this
stage is typically considered to be the time when the majority of the bulk of the structural
changes have completed in the seconds to minutes after impact.
1.3.5
Types of impact craters
When a meteorite impacts a solid surface, it first creates a bowl-shaped depression.
bowl-shaped depression has the ability to transform into a much larger structure, or remain
relatively unmodified.
A. Simple Craters
The formation of a simple crater involves only minor transformations from the original
transient crater. Typically, these transformations will involve collapse of the steep upper
walls of the crater, and by re-deposition of ejected crater debris (French, 1998). This
collapse may increase the measured diameter of the crater by up to 20%, however, the
depth of the transient crater remains essentially unchanged (Melosh, 1989). Dependent
primarily upon the target material and gravity, simple craters are typically small in
diameter, often less than between 2 km (for sedimentary target rocks) and 4 km (for
crystalline targets) on Earth (Grieve, 1987). An example of a simple crater on Earth is
Meteor Crater, shown in Figure 1-2.
B. Complex Craters
Above the transition diameter (Grieve, 1987), a transient crater will collapse in a much
more dramatic and extensive fashion than that of a simple crater. This transformation is
characterized by the upheaval and exhumation of the deep, central target and the collapse
of the outer rim, creating unique features such as a prominent central uplift, extensive and
shallow crater floors, and terraced walls, as seen in Figure 1-3. Another distinguishable
feature of a complex impact crater is the presence of a cohesive impact melt sheet, as
seen in many large impact craters on Earth. This melt sheet, however, is often missing in
ancient impacts due to preferential erosion.
At the intermediate sizes, the central uplift of a complex crater reaches its maximum
stable height, thus collapsing and forming what is known as a ring basin. A
peak-ring basin is the transitional stage between typical complex craters and multi-peak-ring basins
(Baker et al., 2011). For the largest complex craters, these “peak rings basins” fade from
Figure 1-3: Simple crater vs. complex crater morphology (NASA, 2004).
1.3.6
Impact Melting
A common characteristic of most simple and complex impact craters is the presence of a
cohesive melt sheet, melt glass spherules (tektites, etc.), or melt injection dykes (Osinski
et al., 2013). Impact melt sheets have been documented at ~60% of terrestrial impact
craters (Grieve et al., 1977), and are presumed to have been present at more craters if not
for the adverse effects of erosion. Impact-related melting is invariably related to
unloading (decompression) of intense shock pressures and temperatures related to the
shockwave (Grieve et al., 1977). This decompression occurs upon passage of the
rarefaction wave mentioned previously. Figure 1-4 displays the P-T conditions necessary
for complete shock melting in comparison to normal crustal metamorphism conditions
and common polymorphs and shock features. A standard impact melt rock should bear no
shock deformation features, and is often quite homogeneous. For example, the Vredefort
partial melting has been related to the impact process as well, and can occur at lower P-T
conditions than those shown in this figure. Macro-scale evidence of impact-related partial
melting at Vredefort is seen at the Central Anatectic Granite, which represents partial
melt of the surrounding ILG host rock (Gibson et al., 1997; Cupelli et al., 2014).
.
Figure 1-4: P-T plot displaying the shock pressure and temperatures necessary for shock melting, in comparison with 'normal crustal metamorphism.' (Osinski & Pierazzo, 2013).
1.4
The Vredefort impact structure, South Africa
The Vredefort impact structure (S27°0’, E27°30’) is located approximately 120 km
southwest of Johannesburg, South Africa (Fig. 1-5). Estimates place the original crater at
approximately 250-300 km wide (Therriault et al, 1997), and 2.020 Ga (Spray et al.,
1995; Kamo et al. 1996). The original crater would have been the largest, and second
oldest (only to the ~2.400 Ga Suavjärvi Crater in Russia) on Earth. What remains, aptly
named the Vredefort dome, is the ~90 km wide remnant of the central uplift of that
crater, and it has been suggested that Vredefort represents one of the few multi-ring
basins remaining on Earth (Grieve et al., 1981). Estimates suggest that the rocks of the
central uplift have been exhumed from a depth of up to 36 km, based on exposure of both
Precambrian and Archean rocks (Moser et al., 2001; Hart et al., 2004). Further study by
Tredoux et al. (1999) discovered the presence of ~3.5 Ga mantle ultramafic at the center
of the impact, thus promoting the ~36 km “crust on edge” model. The “crust on edge”
model proposes that a radial traverse from the collar to the core of the dome represents a
journey through progressively deeper sections of the Archean crust. The estimated degree
of erosion based on geobarometric studies of between 7-10 km (Stevens et al., 1997;
Gibson et al., 1998), also allows for a unique view into the roots of a giant impact
structure. Figure 1-6 provides a visual depiction of the Vredefort area pre-impact, directly
post-modification, and at the currently accepted estimates of erosion.
Figure 1-6: A visual depiction of local geology at the site of the Vredefort impact A) pre-impact (pre-2.020 Ga), B) immediately after modification (~2.020 Ga), and C) at the present level of erosion. Stratigraphic units are not to scale, and these images are onlyto be used as a rough guide. Images modified from Oggmus (2014).
1.4.1
Geology of the Vredefort central uplift or ‘dome’
The Vredefort dome is the ~90 km wide central uplift left behind from the post-impact
rebound of Archean crystalline basement rocks from the original transient crater floor.
The dome itself is comprised of an ~40 km wide core of Mesoarchean gneisses (from the
Archean Basement Complex), as well as an ~20-25 km outer collar of topographically
high metasediments and metavolcanics (Henkel & Reimold, 1998). The southeastern
portion of the dome is completely covered by ~300-180 Ma Karoo sediments and dolerite
dome (Henkel & Reimold, 1998). The gneisses in the center of the dome have been
metamorphosed to amphibolite to granulite facies, and can be further divided on the basis
of geochemical studies (Hart, 1978; Stepto, 1990) and metamorphic grade, into the Outer
Granite Gneiss (OGG) and Inlandsee Leucogranofels (ILG).
Single-zircon U-Pb dating (Kamo et al., 1996) and 40Ar - 39Ar dating of an OGG
amphibolite (Reimold et al., 1992) from the core of the dome indicated that the Archean
core is between 3.2 and 3.1 Ga, and underwent a stage of metamorphism at ~3.08 Ga.
There is a component of granitoid that is approximately 3.3-3.4 Ga, as indicated by U-Pb
zircon dating by Armstrong et al. (2006). The OGG region is typified by amphibolite
grade migmatitic gneisses, typically of granodioritic, adamellitic, and tonalitic
composition (Hart, 1978; Stepto, 1990). The OGG is thought to represent the middle to
upper crust. The ILG region is defined by granulite grade metamorphism, comprising the
inner annulus of the crystalline core. The gneisses of the ILG are typically strongly
banded and often folded, felsic, tonalitic gneisses (Hart, 1978; Stepto, 1990). An early
theory that the ILG represented portions of an impact melt that was subsequently
crystallized was disproved based on the lack of a considerable Ni values in the
leucogranofels that would have provided evidence of a meteoritic component (Palme,
1980; Schreyer, 1983). The ILG rocks are often found to have an overprinting
granophyric texture, displaying an intergrowth of feldspar and quartz formed as a direct
result of a cotectic or eutectic crystallization from a melt (Schreyer, 1983). At the same
time, the ILG is well-known for its intensely recrystallized grains and glomerogranular
quartz texture that nevertheless decorates rather than erases the dm-scale compositional
interesting spatial relationship between granophyric textures and fabric unit textures in
the ILG rocks suggests that they contained a component of granitic melt formed by
anatectic melting within the ILG host rocks (Schreyer, 1983). A large-scale surface
expression of this partial melting, called the Central Anatectic Granite, can be found near
the Inlandsee Pan (Hart et al., 1991). Near the center of impact, within the ILG zone,
borehole drilling exposed serpentinized amphibole-bearing harzburgite of 3.3-3.5 Ga
(Tredoux et al., 1999). When combined, the evidence indicates a “crust-on-edge” model,
with the OGG representing middle-upper crust, the ILG representing lower crust, and
harzburgites in the core representing possible Archaean upper mantle material (Hart et
al., 1990; Tredoux et al., 1999; Hart et al., 2004). This evidence signifies that the exposed
central uplift of the dome uplifted rocks from the lower crust, comparable to some of the
large impacts on other planetary bodies.
The transition zone between the OGG and ILG has been the subject of numerous
formation propositions. Fletcher & Reimold (1989) proposed that the transition zone
represented a mega-shear zone, while Hart et al. (1990) calls the transition zone the
Vredefort discontinuity, asserting that the abutment of the OGG and ILG terranes
represents the upper and lower crust, respectively. More recently, it was suggested that
this transition likely resembles that of a more gradual change in lithologies rather than a
structural discontinuity, demonstrated by the melt-rich amphibolites and melt-depleted
granulites created during the high-grade metamorphic event at ~3.09-3.08 Ga (Gibson &
Reimold, 1996; Hart et al., 1999; Lana et al., 2003, 2004). This is what would be
Exposed along the northwestern, western, northeastern, and northern arcs of the
Vredefort dome are the subvertical to overturned collar rocks. These metasedimentary
and metavolcanic rocks have the same general geology as the rest of the Witwatersrand
Basin, shown in Figure 1.5. The strata of the collar can be divided into the basaltic
andesites, felsic lavas, and rift-related clastic sediments of the Dominion Group (~3074 ±
6 Ma, Armstrong et al., 1991), overlain by the clastic sediments of the Witwatersrand
(~2.97-2.71 Ga, Robb et al., 1997; Robb and Robb, 1998; McCarthy et al., 2006), the
tholeiitic flood basalts of the Ventersdorp (~2.714 Ga, Armstrong et al., 1991), and the
shales, dolomites, and volcanics of the Transvaal Supergroup (~2.5-2.25 Ga, Walraven et
al., 1990). Subsidiary intrusions, possibly related to the Bushveld event at ~2.06 Ga, also
intrude the collar rocks (i.e. Schurwedraai) (Gibson & Reimold, 2008). At the contact of
the core and collar, the collar strata are upturned 80 degrees (and overturned in places),
and at 50 degrees at areas higher in the Witwatersrand sequence (Lilly, 1980).
The entire region was overprinted by a later metamorphic event induced by the Kibaran
orogeny ca. 1.110-1.021 Ga. This event is the cause of U-Pb resetting in some zircons
yielding a younger, secondary ~1.0 Ga age (Moser et al., 2011).
1.4.2
Evidence of an impact origin for Vredefort
The origin of the Vredefort impact structure was a hotly debated topic for quite some
time, outlining the difficulties in early studies of impact craters. Early work by the likes
of Shand (1916), Hall & Molengraaff (1925), Nel (1927), and Boon & Albritton (1936)
proposed a possible impact origin for Vredefort, and their work gained some traction
when Daly (1947) reiterated their findings, placing an estimate of minimum structure
for quite some time. Many suggested that the crater was endogenic, forming from one of
or a series of mantle explosions (Nicolaysen et al., 1963). Many of the early studies
focused on the macro-evidence of impact cratering. Fortunately, as science and
technology have evolved, so too has the ability to identify key indicators of shock on the
micro-scale. Evidence which is often invisible to the naked eye is now being used in the
forefront of identifying impact craters and ejecta layers across the world, and was used to
verifiably attribute the formation of the Vredefort dome to a hypervelocity impact.
In order for a transient crater the size of Vredefort to form, there must be an immense
amount of energy released upon impact from a hypervelocity bolide. The impact
instantaneously transforms the consolidated target rock into the rheology of a Bingham
fluid (Morgan et al., 2000). This incredible energy release also creates many macroscopic
and microscopic shock features that are indicators of a shock event. Some of these impact
features at Vredefort are shown in Figure 1.7 and include but are not limited to: planar
features in quartz that turned out to be distinctive planar deformation features (Carter,
1965, 1968; French, 1972; Grieve et al., 1990; Leroux et al., 1994) (Fig. 1-7a);
granophyre with a meteoritic component demonstrated by increased siderophile-element
abundances (Koeberl et al., 1996) (Fig. 1-7b); pseudotachylite (Shand, 1916; Killick &
Reimold, 1990; Schwarzman et al., 1983; Reimold & Colliston, 1992) (Fig. 1-7c);
foliated norite impact melt rocks (Moser, 1997); possible impact ejecta in the form of
spherules found in Russia (Huber et al., 2014)(Fig. 1-7d); shatter cones (Hargraves, 1961;
Dietz, 1961)(Fig. 1-7e); zircon crystallized from impact norite (Moser, 1997) (Fig. 1-7f)
and high-pressure quartz phases such as coesite and stishovite (Martini, 1978; Martini,
with irrefutable evidence that is not solely based on the circular shape of the structure or
overturned strata observations in the collar (Boon & Albritton, 1936).
Figure 1-7: Shock evidence at Vredefort, including: a) petrographic image of quartz PDF’s (Grieve et al., 1990), b) granophyre (Davis, 2014), c) pseudotachylite
(Davis, 2014), d) BSE image of impact ejecta spherules (Huber et al., 2014), e) shattercones (Hargraves, 1961), and f) newly crystallized zircon from impact-related norite (Moser, 1997).
1.4.3
Shock microstructures in quartz and other minerals
Often the most useful indicator of a shock event are the shock microstructures contained
in rock-forming and accessory minerals. Microstructures have been documented
extensively in minerals throughout impact structures, including Vredefort, Chicxulub,
rock-forming shock-indicator minerals such as quartz and feldspars. Planar features (later
named planar deformation features (PDF’s)) in quartz were shown to be extensively
present across the Vredefort dome by Carter (1965, 1968). Lilly (1981) noted that there
was a correlation between estimated shock pressures and the average sets of planar
deformation features per grain, based on the shock pressure calibration system of
Robertson (1975) and Grieve & Robertson (1976). He also noted that there was an
increase in the degree of recrystallization in quartz moving from the collar to the core,
typical of increased shock temperature gradients. The confusion imposed by the
troublesome quartz planar features led Lilly (1981) to propose multiple shock events
associated with some form of a cryptoexplosion event. Grieve et al. (1990) reconciled the
controversy suggesting that the relative lack of planar deformation features (Grieve et al.,
1990a-shocked minerals and K/T controversy) in quartz from the core was due to
post-impact recrystallization due to high post-shock temperatures. This recrystallization was
present extensively in the core of the impact, leading to the skewed and confusing shock
pressure calculations. His conclusion, however, led to another problem; quartz, although
fairly refractory, was often overprinted by metamorphism and/or alteration, making it
unreliable as a shock indicator. Leroux et al. (1994) subsequently confirmed the presence
of impact-induced planar features in quartz that are locally overprinted by the post-shock
annealing effects of high temperatures. In some cases, remnants of planar elements in the
quartz hosted trails of fluid inclusions, thought to be annealed planar deformation
features. Because of the moderate susceptibility of quartz and feldspars to erosion,
1.5
Zircon
Zircon (ZrSiO4) is a highly refractory and chemically inert nesosilicate mineral, making it
extremely resilient to weathering, transport, and intense metamorphism. Zircon is also
quite common in the Earth’s crust, as it forms ubiquitously in silicate melts which are the
foundation of igneous rocks. These characteristics have allowed zircon to become an
important tool in determining geological history, including various igneous and
metamorphic episodes that the mineral has recorded. These episodes include primary
crystallization, secondary igneous crystallization, and metamorphic recrystallization,
allowing for a single zircon to contain individual parts of a crystal with entirely different
origins (Hinton & Upton, 1991). This is especially true for shocked zircons, which are
known to recrystallize under high post-shock temperatures (Bohor et al., 1993; Kamo et
al., 1996).
Zircon has two different cation substitution sites, including a tetragonal and a triangular
dodecahedral site, hosting Si and Zr, respectively (Speer, 1980). Chemically, zircons are
quite elementary, with ZrO2, HfO2, and SiO2 making up the majority of the oxide
component. Hafnium is always present in some respect, acting as a substitute for Zr. A
typical zircon does not have a significant amount of Hf, with HfO2/ZrO2ratios on the
order of 0.01, and metamict varieties having slightly more (Rankama & Sahama, 1950).
Much of the effectiveness of zircon in piecing together geological history is related to the
mineral’s ability to act as an incredibly accurate and superior geochronometer. Although
many minerals have been used as reliable shock indicators, including quartz and
feldspars, they are far less refractory than zircon, and are at a significant disadvantage for
primary and secondary U-Pb ages, effectively dating the event that generated the shock
microstructures.
1.5.1
Shock microstructures in zircon
Shock microstructures in zircon were first described by Krogh et al. (1984). Many of
these microstructures have been found to survive billions of years of erosion (Cavosie et
al., 2010), tectonism and metamorphism, even up to granulite facies. A number of zircon
microstructures have been used as diagnostic indicators of shock metamorphism,
including planar and curviplanar features/fractures (Moser et al., 2011), granular zircon
(Bohor et al., 1993), decomposition of zircon to its oxide constituents baddeleyite and
silica (El Goresy, 1965; Kleinmann, 1968; Glass et al., 1990), the presence of
high-pressure zircon polymorph reidite (Cavosie et al., 2015), and microtwinning (Moser et
al., 2011; Erickson et al., 2013). It has, conversely, also been suggested that the presence
of planar and curviplanar fractures are, in fact, not diagnostic of a shock environment,
and that these microstructures may also be indicative of a highly seismically active area
(Kovaleva et al., 2015). The question of whether these planar and curviplanar fractures
are similar to the previously accepted diagnostic planar and curviplanar fractures is still
to be determined. A comprehensive overview of the progression of shock microstructures
in zircon from the Vredefort dome (Moser et al., 2011) revealed the following 5 phases:
1) planar fracturing in {1K0} and {1K2} due to initial shock compression; 2) curviplanar
fractures in {1K1} that have been annealed and now host melt glass inclusions; 3)
microtwins oriented 65° about [110] due to rarefaction of the shockwave; 4) impact age
crystallites recrystallized due to high post-shock heating by intruding impact melt; and 5)
al. (2013) were successful in correlating planar microstructures from exterior scanning
electron images to submicron-scale transmission electron and electron backscatter
diffraction images. Similar to Moser et al. (2011), they proposed the following
chronology of shock microstructures: 1) c-axis parallel PF’s (010) and (100), 2) four
{112} PF’s, some including microtwins, 3) curviplanar fractures and impact melt
inclusions, 4) (011) PF’s from compression, and 5) crystal plastic deformation. Krogh et
al. (1984) established a link between shock microstructures in zircon and U-Pb
systematics, where they attributed an ~1850 Ma isotopic disturbance to impact-induced
planar microstructures at the Sudbury impact structure, Canada. This interpretation was
reinforced with studies by Bohor et al. (1993), Moser et al. (2011) and Cavosie et al.
(2015). Completely recrystallized zircon (granular/polycrystalline zircon), and zircon
crystallized from impact melt have been identified as the best targets for complete U-Pb
impact resetting (Moser et al., 2011; Cavosie et al., 2015). Zircons which are not
recrystallized, but host microtwins, planar fractures, or low angle boundaries are
commonly partially reset (Moser et al., 2011; Cavosie et al., 2015).
A significant setback in the progress of shock microstructural studies in zircon is the
confusion over terminology. An attempt is made in this thesis to elucidate this confusion
and provide a suggestion for a set of guidelines for the classification of terrestrial shock
microstructures. For the purposes of this study, we recommend the following
terminology:
A) Planar features: Defined as any crystallographically-controlled planar element in
a. Microtwins: Planar ‘features,’ which appear as a doublet of lamellae
composed of zircon in twinned orientation relative to the surrounding
crystal. Microtwins, oriented {112} have angle-axis pair values of 65°
about [110] (Moser et al., 2011).
b. Planar fractures (PF’s)- Crystallographically-controlled planar elements
that originally appear as open cracks or fractures in the zircon lattice.
Planar fractures can be either:
i. Open: Completely open fractures that are not filled.
ii. Closed: Infilled by melt, and commonly at least partially annealed.
Very similar to curviplanar ‘features’ defined below.Referred to as
annealed or filled-fractures.
c. “Microcleavage”- Planar elements representing low angle boundaries
(<10°) that remain closed, but are not filled by melt. ‘Microcleavage’ is
similar to those described by Leroux et al. (1999).
d. Planar deformation bands (PDB’s): can be divided into two types:
i. Kinks: PDB ‘kinks’ have been previously documented in zircon,
however they have not been called ‘PDB kinks.’ They are
displayed as small bars of colour change in EBSD misorientation
maps, often associated with other planar features.
ii. Twists: PDB ‘twists’ are a newly documented zircon
microstructure that is described fully in Chapter 2. Tapered planar
bands are referred to as ‘twists’ because of the twisted appearance
B) Curviplanar features-Through-going fractures that are not planar. In previous
publications, these were referred to as ‘fractures,’ however because of the
common infilling by impact melt and subsequent annealing, we recommend that
they be called ‘features’. They should also be differentiated from NPF’s (Timms
et al., 2012), which are not impact-related. Curviplanar features can be divided
into two types for the purposes of this study:
a. Closed(annealed) and in-filled by melt (IMG inclusions).
b. Closed, but offsetting grain boundaries due to increased strain exerted on
the zone of weakness.
C) Granular-textured zircon: Recrystallized zircon can be divided into three types for
the purposes of this study:
a. Fine-granular zircon: Identified as a decomposition feature of zircon
(French, 1998). Often associated with decomposition to baddeleyite.
b. Fine (ejecta-type) granular zircon- Similar to that identified by (Bohor et
al., 1993; Timms et al., 2012), finer-scale granular zircon is induced by
incredibly high instantaneous shock P/T conditions, rather than long-term
exposure to high post-shock temperatures (as in coarse-granular zircon).
c. Coarse-granular zircon- Identified in this study, coarsely granular zircon
appears as polycrystalline zircon. This zircon recrystallizes into coarse
granules under high post-shock temperatures common in the core of the
1.5.2
Melt inclusions in zircon
Melt inclusions in zircon are well-documented, and typically take the form of primary
inclusions of silicate melt separated from the bulk melt during zircon crystallization
(Thomas et al., 2003). These melt inclusions (MI’s) have been found in zircon from
various rock-types, such as gneisses, granitoids, basalts, and sandstones (Li, 1994;
Chupin et al., 1998; Chesner, 1998). MI’s are typically trapped at magmatic conditions,
therefore capturing a glimpse of the original melt composition. A unique quality of zircon
is that it has the ability to preserve these melt inclusions unlike any other mineral,
meaning that zircon can often provide insight into original melt composition and
evolution. The presence of melt inclusions in detrital zircons found in sandstones
(Thomas et al., 2003) is especially remarkable because it displays the preservation
potential of melt inclusions in zircon. Chupin et al. (1998) was even able to use MI’s in
zircon to correlate zircons to their host terranes, by studying melt compositions. Melt
inclusions (MI’s) in zircon have been described by Li (1994), Chesner (1998), Chupin et
al. (1998), Hoskin and Black (2000) and Frezzotti (2001). These melt inclusions have
been observed as both glass and crystalline inclusions, which is primarily a function of
cooling rate and composition of the melt (Roedder, 1979). Crystalline melt inclusions in
zircon tend to form in slow-cooling environments such as in plutonic rocks, whereas
glassy primary inclusions are often found in volcanic rocks, where the melt is rapidly
cooled. The study of MI’s in accessory minerals such as zircon provide the opportunity to
constrain igneous processes that are difficult to understand via conventional methods
(Thomas et al., 2003).
Impact-related melt inclusions have been documented in zircons from the Vredefort
be glass, based on their amorphous electron backscatter patterns (EBSP’s). The
connection of these melt inclusions to impact-induced melting was their preservation
along curviplanar and planar fractures which are diagnostically generated by the
shockwave. Similar melt inclusions have been recently reported in Apollo zircon grains
by Crow (2015), who found both glass and crystalline impact melt inclusions.
1.5.3
Alkali mobility in glasses under an electron beam
When put under the stress of an electron beam, alkali elements (specifically Na and K) in
glasses often become mobile. This is a direct result of beam heating and charging effects
within the sample (Spray & Rae, 1995). The mobility phenomenon is observed even
under low-energy beams (Gedeon et al., 2008), and therefore must be considered in
compositional analysis (EPMA, EDS, etc.). The decay line of alkali elements begins as a
linear trend during the incubation time, but progresses to an exponential trend as time
continues (Gideon et al., 2008). In an effort to diminish the effects of alkali mobility in
glasses, various authors have attempted to adjust settings and parameters. For example,
Morgan & London (2005) suggest using a wider or defocused beam or lower current
densities for the compositional analysis of melt glass inclusions. Reducing the beam
current will reduce heating within the irradiated volume (Spray & Rae, 1995).
Defocusing or widening the beam itself will also reduce heating and charging effects.
The settings used in this study are listed in Tables C-5 & C-6, and discussed in the