Integrated Method for Rice Cultivation Monitoring
1
Using Sentinel-2 Data and Leaf Area Index
2
*Abdelraouf M. Ali1,2, Igor Savin1, Anton Poddubsky1 , Mohamed Abouelghar2 and Nasser
3
Saleh2
4
1 Agrarian-Technological Institute of the Peoples’ Friendship University of Russia, ul. Miklukho-Maklaya 6,
5
Moscow, 117198 Russia
6
2 National Authority for Remote Sensing and Space Sciences, 23 Joseph Tito, El-Nozha Elgedidah, Cairo,
7
Egypt.
8
* Correspondence:orresponding Author: [email protected] , Tel.+79015257326
9
Abstract Rice is an essential crop for national food security in Egypt. Increasing the population
10
calls for regular increases in rice production. At the same time, cultivated rice crop areas should be
11
decreased because of the gradual scarcity of irrigation water. This means more rice production
12
should be gained from less rice area. This situation calls for the annual accurate system for rice
13
monitoring and yield estimation. Therefore, it is necessary to apply a remotely sensed based system
14
for rice cultivation assessment using satellite imagery parallel with field measurements of some
15
biophysical parameters. Multi-temporal normalized difference vegetation index (NDVI) extracted
16
from twelve sentinel-2 imagery cover the whole summer season with variance and maximum value
17
assessed by ground control points (GCPs), were used to isolate uncultivated areas, then to isolate
18
rice areas and other vegetation covers. object-based classification methods with kappa co-efficient
19
0.9261 and overall accuracy 94.92% was generated to discriminate rice crop area and other summer
20
crops on the study area. Leaf area index (LAI) for the experiment the l site was calculated using
21
the surface energy balance algorithm for Land (SEBAL) model and then tested versus measured
22
(LAI). NDVI and LAI were used to generate empirical ran rice yield prediction model. Then, this
23
model was used to produce rice to yield a map. The study was carried out in an experimental site in
24
Kafr Elsheikh governorate with a total area of 5040 Hectare. Produced cultivated land use map
25
showed 95% overall accuracy. High similarity was observed between measured and calculated
26
(LAI) with high accuracy R2 = 0.94. of Rice, yield map showed expected yield more to than a month
27
before harvest. The generated yield map was tested using a correlation coefficient between actual
28
yield and estimated yield with high accuracy R2 = 0.9. This method is applicable to estimate
29
acreage and productivity of rice in the north Nile delta in adequate time before harvest.
30
Keywords: Sentinal-2; NDVI; LAI; rice; yield
31
1. Introduction
32
Rice is the main staple food crop for a huge percentage of global population beside its role in
33
global biogeochemical processes[1]. Rice agriculture may face major challenges in the coming
34
decades due to increasing resource pressures, severe weather and climate change, population
35
growth and economic development[2]. More than one billion people depend on rice to support diets
36
and livelihoods. At the same time, the total accumulated area of rice has tapered off as available
37
arable land is becoming scarce and competition for land uses evolve. This has resulted in intensified
38
practices for additional crop cycles and production amplifying water utilization and management to
39
enhance rice productivity.
40
In Egypt, rice is the dominant summer crop in Nile delta because of its low cultivation costs
41
comparing with other summer field crops such as maize and cotton. It is the main food for about
42
50% of Egyptians, especially in the Nile Delta and northern Egypt [3]. The total rice area in Egypt is
43
510,648.6 hectare in 2015 produced 326,429 ton as reported by Ministry of Agriculture. Rice is
44
cultivated mainly in northern Nile delta where the soil is characterized by high salinity. This
45
situation forces large areas of northern Nile delta to cultivate rice in summer season as the huge
46
amount of irrigation water that is consumed by rice enables periodical soil leaching and sustains
47
high level of soil productivity. Kafrelsheikh governorate that is in the northern of Nile delta is one of
48
the top rice producers in Egypt with a total production of 13,749 ton produced from 104,577.5
49
hectare as reported in 2015. Starting from 2018[4], Egyptian government launched new legislation to
50
reduce rice area to face the problem of expected scarcity of irrigation water. This may affect summer
51
crop composition in large areas of Egyptian delta beside its effect on soil characteristics[5][6]. The
52
current concern of agricultural research community is how to keep an adequate demand of rice
53
production from less rice acreage and at the same time how to stop any degradation in soil
54
characteristics as a result of decreasing rice areas. This relatively complex situation calls for an
55
integrated system for rice crop monitoring. This is in which satellite imagery and ground
56
measurements could be employed powerfully[7],[8][9][10].
57
One of the main components of rice crop monitoring is yield estimation. Basically, yield of the
58
main cereal crops is a global issue related directly to food security and human life [11][12]. Crop
59
yield estimation in an adequate time before harvest ensures more effective agricultural management
60
policies. Ground-based method for crop yield estimation is commonly used worldwide; however, it
61
is costly and time consuming. Therefore, applying an accurate, low costly effective and rapid,
62
method for crop yield prediction at local and regional scales is one of the main objectives of remote
63
sensing agricultural (RS) applications[7], [13]–[16].
64
The second component of rice crop monitoring system is crop biophysical parameters that are
65
closely related to crop vigor and crop vegetative health and could be linked with crop productivity
66
and crop spectroscopic parameters. Remote sensing is a powerful mean to study crop biophysical,
67
biochemical and phonological parameters such as biomass [17], leaf area index (LAI)[18];[19][20];
68
[21], [22], and chlorophyll content [19] These parameters could be linked with remotely sensed data
69
represented as vegetation indices (VIs). Many studies analyzed the relationship between one
70
vegetation index and one or more of these parameters. Other studies analyzed the correlation
71
between remotely sensed and measured parameters with crop yield. Linear correlation was found
72
between normalized difference vegetation index (NDVI) and grain wheat yield [23], linear
73
relationship addressed the correlation between wheat yield and band ratios (NIR/ Green) and (NIR/
74
Red) [11]. Absorbed photosynthetically active radiation (PAR) was used as an estimator for crop
75
yield. In homogeneous large cultivated areas, Landsat and SPOT5 imagery with adequate spatial
76
resolution of 30 m and 10 m were used for crop yield prediction [25],[7] [26]The objective of the
77
current study is to propose a remote sensing-based system for rice crop monitoring using satellite
78
data and ground measurements. The proposed models are applicable more than a month before
79
harvest in any rice production area of Nile delta region of Egypt.
80
2. Material and Methods
81
2.1. Study area
82
The study was carried out in Kafr El-Sheikh governorate. Kafr El-Sheikh is located in the
83
northern part of Nile Delta between Rosetta and Damietta Nile branches. The location of the
84
governorate is between 31° 30` 7.59`` and 31° 9` 58.09`` North and between 30° 20` 36.83`` and 31° 17`
85
15.16`` East. It is bordered by Mediterranean Sea and Burulus Lake from the North, Behira
86
governorate from the west, Dakhlia governorate from the east and Gharbia governorate from the
87
south as shown in figure (1).
89
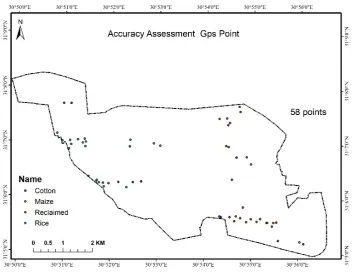
Figure 1.
Study area (Sakha Agriculture research station - Kafr El-Sheikh
90
governorate)
91
As a part of KafrElsheikh governorate, field measurements for rice biophysical parameters and
92
generation of rice yield prediction models and generation of the modeling to retrieve biophysical
93
parameters from vegetation indices were carried out in Sakha experimental station in KafrElsheikh
94
governorate with a total area of 5040 hectare as shown in figure (2). Rice cultivation in Egypt is
95
vital for national food security. At the same time, rice cultivation consumes huge amount of
96
irrigation water when the national resources of irrigation water are relatively getting lower. The
97
study area is located in Kafr ElSheikh governorate. Basically, nine governorates in Egypt cultivate
98
rice every season with varying areas, however, Kafr ElSheikh governorate, where the study area of
99
the current study is located, is a special case. This governorate is one of the top rice producers in
100
Egypt. It occupies the second level over the country in terms of the area planted with the rice, while
101
it the first in terms of productivity of the rice. It is coastal governorate and the soil of large areas is
102
characterized as highly saline soil. Therefore, cultivating rice with large amount of water is
103
necessary for salt leaching process, otherwise, large areas of the governorate will face severe
104
degradation. In addition, cultivating rice increases underground water table which is a method to
105
face coastal land erosion. This situation makes rice cultivation in Kafr ElSheikh governorate is one of
106
the key factors in irrigation water management in Egypt.
107
The central government of Egypt launched legislations and regulations in order to decrease the
108
total area of rice cultivation without any bad effect on soil characteristics. At the same time, intensive
109
work is carried out to produce new rives varieties that are more tolerant to dry conditions. The
110
final national objective is to keep the national amount of rice production with less consumption of
111
irrigation water
113
Figure 2:
Distribution of ground control point for Accuracy assessment
114
2.2. Satellite data processing
115
Cultivated areas in Nile delta is are very dense, therefore, high spatial resolution satellite
116
imagery (<= 20 meters) are necessary to accurately isolate any vegetation cover under investigation
117
in Nile delta. Also, isolation of a specific crop type in the intensive cultivated areas in Nile delta
118
requires multi-temporal satellite images [9] that cover the whole growing season of the crop.
119
Therefore, nine sentinel-2 satellite images with ten meters spatial resolution that were expected to
120
cover the whole rice growing stages of rice (preparation, emergency, tillering, flowering, repining
121
and harvesting) during the season of 2018 were used in the current study figure (3).
122
123
125
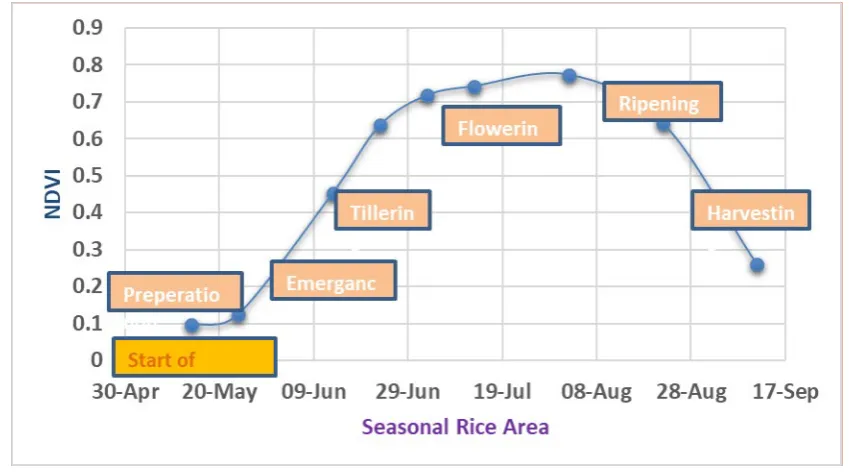
Figure 3
. Phenology stages of a typical rice crop and their NDVI values
126
Sentinal-2 of multispectral product at 10-meter spatial resolution was downloaded from the
127
ESA’s Earth Observing System Data and Information System website. Image files were stored in the
128
format SAFE with different spatial resolution as raster tiles/scenes. All preprocessing sages were
129
performed including: re-projection, atmospheric correction, mosaic, sub setting, and layer stacking.
130
The Atmospheric correction was carried out using (FLAASH - ENVI) module for senstinel-2 images.
131
This module relies upon standard condition for unearthly brilliance at a sensor pixel, L. The
132
condition of this module is as per the following in condition No (1) as indicated by [27]
133
Equation -1
134
where
:
135
ρ
is the pixel surface reflectance
136
ρ
e is a normal surface reflectance for the pixel and an encompassing
137
locale S is the spherical albedo of the atmosphere
138
La is the radiance back scattered by the atmosphere
139
A and B are coefficients that rely upon barometrical and geometric conditions yet not at first
140
glance. Stacking is a process of combining multi layers into a single output file. A stacked image file
141
was created through stacking 9 images using ENVI.3.1 (Version 2016).
142
2.3. Distribution of rice Area
143
Basically, methodology depends on major components, (i) determining the maximum and
144
stander deviation of NDVI time series (ii) identifying the threshold value for NDVI to mask non
145
cultivated areas (iii) multi resolution segmentation techniques and post classification methods to
identify rice signatures in temporal dimension (iv) classification calibration and validation; spatial
147
distribution of rice area. These are described in the following subsections.
148
2.3.1. determining the maximum and stander deviation of NDVI time series
149
This resulted in a continuous sequence of NDVI temporal values for each pixel during the
150
growing season. Normalized difference vegetation index (NDVI) Equation (2) was calculated for
151
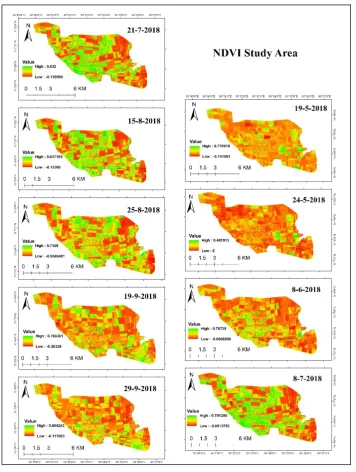
each individual image and assessment of (NDVI) values was carried out as shown in figure (4). The
152
acquisition dates of the used satellite are: May 14, May 24, June 13, June 23, July 3, July 13, August 2,
153
August 22 and September 1. Normalized difference vegetation index (NDVI) time series was
154
calculated to be used
155
156
Figure (4) Data acquisition for sentinel-2 and NDVI images for the study area
157
for masking the non-Vegetated areas and isolate only vegetated areas. Normalized difference
158
vegetation index (NDVI) was calculated for each single date. This index is calculated according to
159
the following equation [2]:
161
162
(Equation 2)
163
Image segmentation was applied object-based segmentation with scale 10 the NDVI time-series
164
through rice growth stage for the multitemporal dimension of rice season started from May to
165
September 2018 in order to determine rice-specific signatures.
166
2.3.2. Identifying the threshold value for NDVI to mask non cultivated areas
167
For this technique, we considered having 5 classes by setting the convergence threshold of
168
0.85 as also reported by ([29] ; (Mosleh, 2015),(Ali et al. 2018) with the infinite number of iterations
169
(the iteration would depend upon reaching to the desired convergence threshold). The
170
explanation behind the adoption of this explicit agglomeration was its ability to: 1) assign each
171
picture element to a category supported spectral and temporal similarities, 2) determine many
172
classes based on inherent characteristics of the time-series and 3) discriminate a large area covered
173
by different crop types.
174
The temporal signature was defined as a maximum NDVI values over the entire crop growth
175
stages for each of the classes. Identification of this sig. nature including the creation of land use map
176
as the first step in order to make sure the class of interest fell under agricultural land category
177
2.3.3. Multi resolution segmentation techniques and post classification methods to identify rice
178
signatures in temporal dimension
179
high spatial resolution imagery of sentinel-2 were used to visually identify unique features
180
related to rice plantation such as small field crops, irrigation structures (that include canals,
181
irrigation channels, roads, etc.) ([32], (Ali et al., 2018). Assessment of NDVI trend as resulted from
182
rice phenological information. The maximum and standard deviation for NDVI values of rice
183
cultivation were used as additional input factors to maximize the accuracy of crop classification and
184
isolation of rice cultivations.
185
The classification of the satellite imagery was used using object-based classification utilizing 4
186
bands of the Sentinal-2 images (B2,B3,B4 and b8) and the corresponding four bands. Before setting
187
up the segmentation parameters, spectral bands of images were weighted proportional to the mean
188
of pixel values at image band, which can be considered as a parameter of separability. After
189
segmentation, a standard nearest-neighbor algorithm (with manual sample selection) was used to
190
classify objects into 3-layers basic classes: Rice, Maize, cotton, and the other classes describe the bare
191
soil (prepared land for agriculture) and Urban Area.
192
2.3.4. classification calibration and validation
193
the accuracy assessment and validation of classification was
194
conducted using Kappa coefficient and over all accuracy.
This analysis is a195
distinct multivariate procedure used to determine classification accuracy from an error matrix. It
196
generates a Kappa coefficient that has a probable range from 0 to 1 equation 3 according to [33].
199
(3)
200
There is one probable clarification of Kappa Coefficient: poor agreement = less than
201
(0.20), fair agreement = (0.20) to (0.40), moderate agreement = (0.40) to (0.60), good
202
agreement = (0.60) to (0.80), very good agreement = (0.80) to (1.00) figure (2)
203
showed the distribution of ground control point.
204
205
2.4. Rice yield map
206
207
After we determine the spatial distribution map of rice as describe in the above, we performed
208
the following three steps in evolving a rice yield map. Firstly, we started determine average
209
NDVI-values (i.e., NDVI peak−greenness) depending upon our study on Sentinel- 2 to describes the
210
spectral profile for rice crop and determine the rice phenology in the study area. The temporal
211
profiles of NDVI of rice crop extracted from sentinel- 2 imagery were clearly unique in the study
212
area to determine the peak greenness of rice during the peak greenness period (July 24th depending
213
on NDVI time series). Secondly, we applied equation from SEBAL 2002 to calculate LAI depending
214
on satellite imagery, thirdly, validated LAI index map using ground observation point and the pixel
215
value of LAI using regression analysis between pixel value and measured LAI. Fourth mapping rice
216
yield map depending on generated model by (Noureldin et al., 2013) finally, tested yield map using
217
correlation coefficient between yield map and actual yield.
218
Rice yield map was estimated according to reported and tested empirical statistical model as
219
describe on equation (4). The model was applied one month before harvesting. This model was
220
generated and validated on the same study area.
221
222
Equation 4
223
Where y: defined as the estimation yield, while (LAI): is the leaf area index. It was calculated from
224
Equation 4. and NDVI: is the Normalize Difference vegetation index and its calculated from the peak
225
greenness of rice crop growth stages
226
227
2.4.1. NDVI peak greenness
228
Assessment of NDVI profile throughout the season showed that in the beginning, associated
229
with low biomass, the average NDVI values were significantly small. NDVI values increased
230
gradually associated with the development of canopy to reach the peak value in August.
231
2.4.2. LAI measurements
232
LAI is the ratio of the total area of all leaves on a plant to the ground area represented by the
234
plant. It is an indicator of biomass and canopy resistance. LAI was measured and computed using
235
two approaches. One of them is using surface energy balance algorithm of land equation 5:
236
237
Equation 5
238
where; SAVIID is the soil adjusted vegetation index calculated from Equation (6) using a value of 0.5
239
for L.
240
241
E
quation
6
242
And the second methods of measuring LAI were also using ceptometer lP-80. This device
243
measures the LAI of small plots, gapped, and non-uniform canopies simply and easily by restricting
244
the view in terms of both azimuth (with view restricting caps) and zenith angles (by excluding one
245
or more of the view rings). It is not possible to restrict either the azimuth or the zenith view angles
246
using this device the methods was described by [35]
247
2.5. ArcGIs Model Builder for thrice spatial distribution.
248
Using the model-builder in Arc Map 10.4.0, a model was created for the respective test area.
249
Once the LAI and NDVI variables of model were determined by the statistic models for Rice, the
250
shape files with the source data were modified to reflect the attributes that contains the data of Rice
251
area was used to extract raster value of different NDVI and LAI for Rice area from other crops area.
252
Modeling process was applied for the peak-greenness growing stage (at August). Then, the model
253
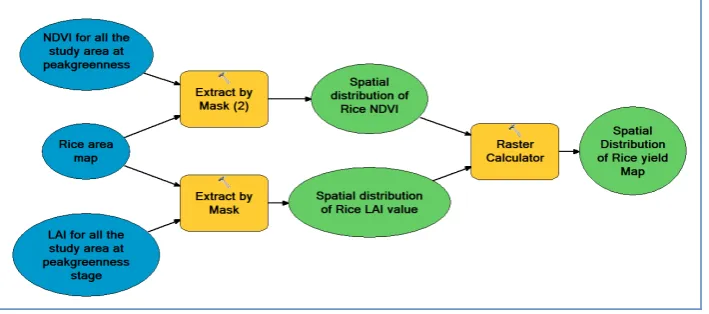
with the highest accuracy was applied to produce rice yield map. Based on the optimal generated
254
statistical model was describe on figure (5)
255
2.6. Statically analysis for Validation maps.
256
The correlation coefficient between actual and predicted methods that was used to validate LAI
257
and Yield maps. The statistical analysis was done using origin pro8 software
258
259
Figure 5
Model builder using Arcmap 10.4
260
262
3. Result:
263
3.1. Spatial distribution of rice area
264
The spatial distribution of rice area for the study area through year 2018 was estimation using
265
object-based classification and mapped the spatial extent of cultivated crops on the study area in
266
Figure 8(a and b). Depending on applying the thresholds determined we started to delineate the
267
agriculture area (vegetated area) and non-agriculture Area as showed on figure (8c ). object-based
268
classification method for determination of crop areas under the study area to discriminate spatial
269
distribution of rice area, we applied them over NDVI time series during rice season. It is achieved
270
high accuracy method to discriminate between different types of crops and distinguishes the spatial
271
distribution of rice crop in the study area. depending on NDVI threshold cross matched the
272
phenology responses of cotton, rice, and Maize to filter out the rice area precisely. It revealed strong
273
high accuracy with over all accuracy 94.92% and kappa co-officiant 0.921 as described on table (1)
274
and figure 7. Our results were also similar to other studies: [36] used Landsat-derived vegetation
275
indices, such as NDVI, EVI, and Mosleh et al., 2016 used MODIS vegetation indices time series, and
276
(Ali et al. 2018) used sentinel- 2 to estimate winter crops in Egypt. We found that the study site
277
remained under rice cultivation extensively was 1699.8 (Ha) and the weight of cotton around
278
vegetation was 129. from the total area while maize represented around 327.35 (Ha). The spatial
279
distribution of the area under rice cultivation is mapped in figure Figure 7.
280
281
282
283
284
285
286
287
288
289
290
291
(6a)
293
(6b)
294
295
296
297
298
299
300
301
302
303
304
305
306
307
(6C)
308
309
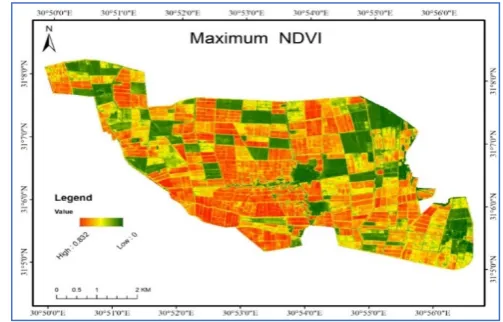
Figure (6): (6a)
Standard division of NDVI values sakha area (6b) maximum NDVI
310
values for sakha area derived from multitemporal Sensinal -2 derived from
311
multitemporal Sensinal -2 and (6C) Agriculture and non-Agriculture area derived by using
312
maximum and standard division NDVI
313
314
315
Table (1)
Kappa co-efficient and over all accuracy for crop area maps o the study
316
area
NDVI time series
Kappa Coefficient
0.9261
Overall Accuracy
94.92%
318
319
Figure (7)
Total area for the discriminated crops on the study Area
320
321
323
Figure (8-a)
in the left derived rice cultivation area (indicated using green shades)
324
mapping during 2018 and.
Figure (8-b)
on the right the boundary of rice cultivated on
325
the study area
326
327
328
3.2. SEBAL LAI estimation as a factor to estimate rice yield.
329
Two variables were calculated to estimate rice yield map according to (noureldein et al., 2013) .
330
one of the two variables is LAI. Its calculated as describe of section (5.2) to produce LAI map for
331
rice cultivation. According LAI Map produced to show the gradual increasing then decreasing of
332
LAI according to the growing circle of summer crops through (8 August) on the study area as
333
shown on figures (9). LAI maps were validated by using actual LAI that measured by comptometer
334
lp-80 using through peak greenness. The correlation between actual LAI and predicted LAI on the
335
peek greenness period of Rice crop growth stage was used to calibrate LAI Map., as showed on
336
Figure (10) The accuracy of the result achieved very high accuracy with R2 0.939 as, the second
337
variable of NDVI was calculated from Sentinel 2 with the same time of measuring LAI.
338
339
340
Figure (9). Estimated LAI depending on SEIBAL model Through August 2018 for different
341
crops including maize and rice….
342
343
345
346
347
348
349
Figure (10) ( LAI Map validation ) the correlation coefficient between LAI values at the
350
peak greenness period (August) and ground-based rice LAI Measured by Ceptometer
351
LP-80. It demonstrated strong relationships (i.e.,
r2
.0.93).
352
353
3.4. Spatial distribution of Rice crop.
354
355
The model builder output consists of grid cells with values for estimated yield prediction in
356
ton/Ha. The grid cell size used in the calculation was 10 square meters. The grid cell output was
357
converted into polygon format so that calculations could be made to multiply each yield prediction
358
rate by its area to determine the yield prediction for each Pixel. Figure (10) shows the yield
359
prediction map for wheat crop in test area. This map shows that the vegetative Crop growth stage
360
was the best models for different NDVI models for peak greenness stage which has the best
361
correlation coefficient for yield prediction models.
362
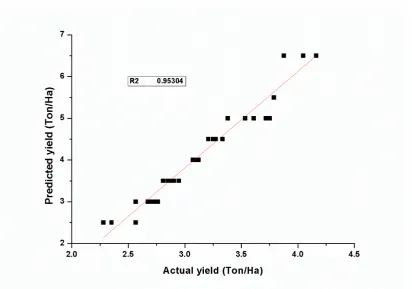
predicted results were validated using 54 validation sites in the Sakha station area of kafr
363
Elsheikh governorate Figures 2. The results presented in figure 11 indicate that the estimated rice
364
yield map was spatially variable among the sampling sites, the correlation coefficient observed in
365
Figure 12 was implemented in forecasting rice yield during 2018; It showed that strong correlation
366
coefficient (i.e., r2, =0.95) between ground-based (Actual yield) and forecasted yields at Sakha
367
station. Rice yield map was carried out using the analysis of NDVI multi-temporal. This approach
368
has been used in many studies using NDVI from NOAA/AVHRR and MODIS images [37] et al.,
369
2003, [30]
371
Figure (11)
Spatial distribution of rice yield map for Sakha station
372
373
Figure (12) shows the relationship between yield values that we can predict it at the peak
374
greenness period (August) and ground-based Measured (actual yield. It demonstrated
375
strong relationships (i.e.,
r2
.0.95).
4. Conclusion:
378
in this study new technology was implemented a new methodology to estimate the spatial
379
distribution of rice area and rice yield pattern. This methodology was applied and tested under
380
Sakha station. Multi temporal NDVI derived from sinteinal-2 satellite imagery was conducted to
381
study the spatial distribution of rice area. It’s used also to determine the peak greenness of
382
vegetative growth stage to estimate and mapping rice area. The threshold values of maximum and
383
standard deviation of NDVI was calculated to discriminate agriculture and non-Agriculture area.
384
The object-based segmentation techniques using e-cognation developer software with spatial scale
385
10 m was used to determine the boundary and shape of different crops. five classes were determined
386
on the study area. The kappa coefficient and overall accuracy were 0.9261 and 94.9 respectively. The
387
spatial distribution of rice yield map was calculated according two variables as described on section
388
(3.4), LAI was calculated according SEBAL model. The produced maps were validated using
389
correlation co-efficient between measured and predicted LAI With high accuracy R2 = 0.93. the ARC
390
GIs model builder was used to determine the spatial distribution of yield map for each pixel.
391
fifty-four ground yield were used to validate yield map with high accuracy 0.9. Finally, we are
392
recommended to use this methodology with high accuracy to estimate rice area and yield on delta
393
Egypt because of fragmentation of agriculture field crops.
394
References
395
1. C. Change and F. Security, THE STATE OF FOOD AND AGRICULTURE. 2016.
396
2. The future of food and agriculture Trends and challenges. .
397
3. W. Ghidan and M. Yacout, “Genetic Variability among Egyptian Rice Genotypes ( Oryza sativa L .) for
398
Their Tolerance to Cadmium Genetic Variability among Egyptian Rice Genotypes ( Oryza sativa L .) for
399
Their Tolerance to Cadmium,” no. January, 2016.
400
4. H. Sayed, A. Abdelaal, and D. Thilmany, “Grains Production Prospects and Long Run Food Security in
401
Egypt,” pp. 1–17, 2019.
402
5. M. B. K. Le, “Proposal Application Form.”
403
6. Water Saving In Irrigated Agriculture in Egypt. .
404
7. I. Ahmad, A. Ghafoor, M. I. Bhatti, I. H. Akhtar, and M. Ibrahim, “Satellite Remote Sensing and GIS based
405
Crops Forecasting & Estimation System in Pakistan.”
406
8. M. Boschetti et al., “PhenoRice: A method for automatic extraction of spatio-temporal information on rice
407
crops using satellite data time series,” Remote Sens. Environ., 2017.
408
9. A. M. Ali, M. A. Aboelghar, M. A. El-shirbeny, and N. H. Salem, “Comparative analysis of some winter
409
crops area estimation using landsat-8 and sentinal-2 satellite imagery,” Futur. Food J. Food, Agric. Soc., vol. 6,
410
no. 2, 2018.
411
10. Y. A. Detection, “Using Low Resolution Satellite Imagery for Yield Prediction,” pp. 1704–1733, 2013.
412
11. G. Zhang et al., “Mapping paddy rice planting areas through time series analysis of MODIS land surface
413
temperature and vegetation index data,” ISPRS J. Photogramm. Remote Sens., 2015.
414
12. T. Liu, X. Liu, M. Liu, and L. Wu, “Evaluating heavy metal stress levels in rice based on remote sensing
415
phenology,” Sensors (Switzerland), vol. 18, no. 3, 2018.
416
13. T. Paper, “REMOTE SENSING AND ITS APPLICATION IN AGRICULTURAL PEST,” no. June, pp. 43–61,
417
2015.
418
14. M. K. Mosleh, Q. K. Hassan, and E. H. Chowdhury, “Application of remote sensors in mapping rice area
419
and forecasting its production: A review,” Sensors (Switzerland), vol. 15, no. 1, pp. 769–791, 2015.
420
15. N. A. Noureldin, M. A. Aboelghar, H. S. Saudy, and A. M. Ali, “Rice yield forecasting models using
421
satellite imagery in Egypt,” Egypt. J. Remote Sens. Sp. Sci., vol. 16, no. 1, pp. 125–131, 2013.
422
16. J. Dong et al., “Mapping paddy rice planting area in northeastern Asia with Landsat 8 images,
423
phenology-based algorithm and Google Earth Engine,” Remote Sens. Environ., 2016.
424
17. A. Gitelson, “Remote Sensing Estimation of Crop Biophysical Characteristics at Various Scales,” no. May,
425
2016.
426
18. M. Aboelghar et al., “Using SPOT data and leaf area index for rice yield estimation in Egyptian Nile delta,”
427
Egypt. J. Remote Sens. Sp. Sci., vol. 14, no. 2, pp. 81–89, 2011.
19. D. Haboudane, J. R. Miller, N. Tremblay, P. J. Zarco-tejada, and L. Dextraze, “Integrated narrow-band
429
vegetation indices for prediction of crop chlorophyll content for application to precision agriculture,” vol.
430
81, pp. 416–426, 2002.
431
20. A. Verger, N. Vigneau, C. Chéron, J. Gilliot, A. Comar, and F. Baret, “Remote Sensing of Environment
432
Green area index from an unmanned aerial system over wheat and rapeseed crops,” Remote Sens. Environ.,
433
vol. 152, pp. 654–664, 2014.
434
21. S. Liang, M. E. Schaepman, and M. Kneubuehler, “Remote Sensing Signatures : measurements , modeling
435
and applications CHAPTER 10 Remote sensing signatures : Measurements , modelling and applications,”
436
no. May 2014, 2008.
437
22. A. M. Ali and M. Aboelghar, “Comparative Analysis of Different Methods of Leaf Area Index Estimation
438
of Strawberry under Egyptian Condition,” vol. 8, no. 1, pp. 2963–2970, 2019.
439
23. C. J. Tucker and B. N. Holben, “Remote Sensing of Total Dry-Matter Accumulation in Winter Wheat,” vol.
440
189, 1981.
441
24. S. Pradhan, K. Bandyopadhyay, R. N. Sahoo, and V. K. Sehgal, “Predicting Wheat Grain and Biomass
442
Yield Using Canopy Reflectance of Booting Stage,” no. May, 2014.
443
25. M. M. Awad, “Toward Precision in Crop Yield Estimation Using Remote Sensing and Optimization
444
Techniques,” 2019.
445
26. P. Yang, G. X. Tan, Y. Zha, R. Shibasaki, R. Planning, and V. Indices, “INTEGRATING REMOTELY
446
SENSED DATA WITH AN ECOSYSTEM MODEL TO ESTIMATE CROP YIELD IN NORTH CHINA,” no.
447
1988, 2003.
448
27. R. Frouins et al., “Passive remote sensing of tropospheric correction for the aerosol effect aerosol and
449
atmospheric,” vol. 102, no. 97, pp. 815–830, 1997.
450
28. E. Version, “ENVI Tutorials,” 2000.
451
29. M. Kalácska, “Calibration and assessment of seasonal changes in leaf area index of a tropical dry forest in
452
different stages of succession,” no. August, pp. 733–744, 2018.
453
30. M. K. K. Mosleh, “Use of GIS and Remote Sensing in Mapping Rice Areas and Forecasting Its Production
454
at Large Geographical Extent,” p. 169, 2015.
455
31. A. M. Ali, S. Sciences, M. A. El-shirbeny, S. Sciences, N. H. S. Saleh, and S. Sciences, “Comparative analysis
456
of some winter crops area estimation using landsat-8 and sentinal-2 satellite imagery,” no. July, 2018.
457
32. J. Dong et al., “Tracking the dynamics of paddy rice planting area in 1986-2010 through time series Landsat
458
images and phenology-based algorithms,” Remote Sens. Environ., 2015.
459
33. Y. J. Kaufman, A. E. Wald, L. A. Remer, B. Gao, R. Li, and L. Flynn, “The MODIS 2 . 1- m Channel —
460
Correlation with Visible Reflectance for Use in Remote Sensing of Aerosol,” vol. 35, no. 5, pp. 1286–1298,
461
1997.
462
34. N. A. Noureldin, M. A. Aboelghar, H. S. Saudy, and A. M. Ali, “Rice yield forecasting models using
463
satellite imagery in Egypt,” Egypt. J. Remote Sens. Sp. Sci., vol. 16, no. 1, 2013.
464
35. F. Ecology, E. Unit, P. Team, and F.- Champenoux, “Ground-based measurements of leaf area index : a
465
review of methods , instruments and current controversies,” vol. 54, no. 392, pp. 2403–2417, 2003.
466
36. J. Huang, “Rice yield estimation using remote sensing and simulation model,” no. 2012, 2015.
467
37. Y. Qian et al., “Crop Growth Condition Assessment at County Scale Based on Heat-Aligned Growth
468
Stages.”