Technical Note
1
Mapping Quantitative Trait Loci onto
Chromosome-2
scale Pseudomolecules in Flax
3
Frank M. You* and Sylvie Cloutier
4
Ottawa Research and Development Centre, Agriculture and Agri-Food Canada, Ottawa, ON K1A 0C6,
5
Canada; [email protected]; [email protected]
6
*Correspondence: [email protected] (F.M.Y.); Tel.: +1-613-759-1539 (F.M.Y.)
7
8
9
Abstract: Quantitative trait loci (QTL) are genomic regions associated with phenotype variation of
10
quantitative traits in a population. To date, a total of 267 QTL for 29 quantitative traits have been
11
reported in 13 studies on flax. Of these, 200 QTL from 12 studies were identified based on genetic
12
maps, scaffold sequences, or pre-released chromosome-scale pseudomolecules. Molecular markers
13
for QTL identification differed across studies but were mainly based on simple sequence repeat
14
(SSR) or single nucleotide polymorphism (SNP) markers. This article provides methods with
15
software tools and database files to uniquely map SSR and SNP markers from different references
16
onto the recently released chromosome-scale pseudomolecules. Using these methods, 195 QTL were
17
successfully sorted onto the 15 flax chromosomes and grouped into 133 co-located QTL clusters.
18
Mapping of QTL from different studies to the same reference enables comparisons and facilitates
19
genome-wide QTL analysis, candidate gene scanning, and breeding applications.
20
Keywords: flax; association mapping; genome-wide association study (GWAS); simple sequence
21
repeat (SSR); single nucleotide polymorphism (SNP); quantitative trait loci (QTL);
chromosome-22
scale pseudomolecules
23
24
1. Introduction
25
Most traits of importance in plant breeding are quantitative and controlled by polygenes with
26
minor effects on phenotypes. Traditional quantitative genetics can estimate overall genetic effects or
27
variances of polygenes for quantitative traits through dedicated genetic designs [1], providing a
28
theoretical guide for plant breeding. With the development of molecular markers and
high-29
throughput genotyping techniques, individual polygenic loci on chromosomes and their effects can
30
be detected and estimated using statistical genomics approaches. Such polygenic loci on
31
chromosomes are called quantitative trait loci (QTL). They are associated with phenotype variation
32
of quantitative traits and are usually mapped in various populations using molecular markers such
33
as simple sequence repeat (SSR) or single nucleotide polymorphism (SNP) markers. Generally, QTL
34
can be identified by two main approaches: linkage mapping (LM) of bi-parental populations and
35
diverse genetic population-based association mapping (AM) or genome-wide association study
36
(GWAS) [2]. LM uses bi-parental populations, such as F2, recombinant inbred line (RIL), doubled
37
haploid (DH), and backcross (BC) populations, to identify loci responsible for trait variation between
38
parents based on recombination-based genetic linkage maps [3]. AM relies on linkage disequilibrium
39
(LD) between markers and QTL, using a more diverse genetic panel to overcome the phenotypic
40
diversity limitation of bi-parental populations, such as natural germplasm collections, or, more often,
41
panels including germplasm accessions and breeding lines or, multi-parent populations such as
42
nested association mapping (NAM) [4-6] and multi-parent advanced generation intercross (MAGIC)
43
populations [7-10]. QTL can be exploited for gene cloning, marker-assisted breeding, and genomic
44
selection or prediction.
45
Cultivated flax (Linum usitatissimum L.) is a self-pollinating annual crop valued for its seed oil
46
or stem fiber. Phenotypic selection remains a major conventional breeding approach to improve traits
47
of agronomic importance in flax. To accelerate the application of molecular breeding, a large number
48
of molecular markers [11-14] and genetic populations [15-18] have been developed to assist QTL
49
identification in the last decade. Using these genetic resources, a total of 267 QTL for 29 traits (11 seed
50
yield and agronomic traits, 11 seed quality traits, four fibre traits, and three disease resistance traits)
51
were reported in 13 studies (Tables 1 and 2). These QTL were identified mainly using SSR or SNP
52
markers (Table 2). Most (200) of the QTL were mapped based on genetic maps [15,18-24], scaffold
53
sequences [17,25,26], or an early (hereafter pre-released) version of chromosome-scale
54
pseudomolecules (PCPs) [27,28]; however, only 67 QTL for pasmo severity (PAS) were mapped on
55
the most recent release of the chromosome-scale pseudomolecules (RCPs) (Table 2) [14,29]. For
56
comparison purposes, coordinates of the QTL based on the PCPs must be converted to the RCPs [29]
57
because the two versions are slightly different. The objective of this technical note is to provide
58
methods and their associated software tools and database files to uniquely map QTL identified in
59
different studies onto the RCPs [29]. Using these methods, 195 out of 200 QTL were successfully
60
mapped onto 15 chromosomes and grouped into 133 co-located QTL clusters. The methods for
61
mapping QTL/markers to the same reference render the QTL identified from different studies
62
comparable, facilitate genome-wide QTL analysis, candidate gene prediction, and breeding
63
applications, present an integrated global view of all QTL identified in flax to date and, provide
64
means to integrate additional QTL in the future.
65
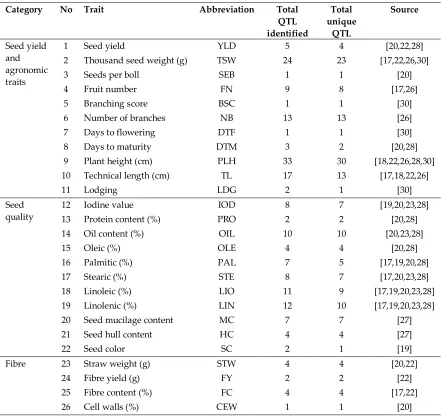
Table 1. Number of QTL associated with 29 traits in flax.
66
Category No Trait Abbreviation Total
QTL identified
Total unique
QTL
Source
Seed yield and agronomic traits
1 Seed yield YLD 5 4 [20,22,28]
2 Thousand seed weight (g) TSW 24 23 [17,22,26,30]
3 Seeds per boll SEB 1 1 [20]
4 Fruit number FN 9 8 [17,26]
5 Branching score BSC 1 1 [30]
6 Number of branches NB 13 13 [26]
7 Days to flowering DTF 1 1 [30]
8 Days to maturity DTM 3 2 [20,28]
9 Plant height (cm) PLH 33 30 [18,22,26,28,30]
10 Technical length (cm) TL 17 13 [17,18,22,26]
11 Lodging LDG 2 1 [30]
Seed quality
12 Iodine value IOD 8 7 [19,20,23,28]
13 Protein content (%) PRO 2 2 [20,28]
14 Oil content (%) OIL 10 10 [20,23,28]
15 Oleic (%) OLE 4 4 [20,28]
16 Palmitic (%) PAL 7 5 [17,19,20,28]
17 Stearic (%) STE 8 7 [17,20,23,28]
18 Linoleic (%) LIO 11 9 [17,19,20,23,28]
19 Linolenic (%) LIN 12 10 [17,19,20,23,28]
20 Seed mucilage content MC 7 7 [27]
21 Seed hull content HC 4 4 [27]
22 Seed color SC 2 1 [19]
Fibre 23 Straw weight (g) STW 4 4 [20,22]
24 Fibre yield (g) FY 2 2 [22]
25 Fibre content (%) FC 4 4 [17,22]
Category No Trait Abbreviation Total QTL identified
Total unique
QTL
Source
Disease 27 Fusarium wilt rating FW 2 2 [24]
28 Powdery mildew rating PM 3 3 [15]
29 Pasmo rating PAS 67 67 [14]
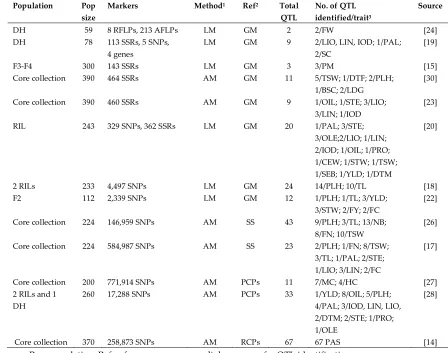
Table 2. QTL identification studies in flax.
67
Population Pop size
Markers Method1 Ref2 Total
QTL
No. of QTL identified/trait3
Source
DH 59 8 RFLPs, 213 AFLPs LM GM 2 2/FW [24]
DH 78 113 SSRs, 5 SNPs, 4 genes
LM GM 9 2/LIO, LIN, IOD; 1/PAL; 2/SC
[19]
F3-F4 300 143 SSRs LM GM 3 3/PM [15]
Core collection 390 464 SSRs AM GM 11 5/TSW; 1/DTF; 2/PLH; 1/BSC; 2/LDG
[30]
Core collection 390 460 SSRs AM GM 9 1/OIL; 1/STE; 3/LIO; 3/LIN; 1/IOD
[23]
RIL 243 329 SNPs, 362 SSRs LM GM 20 1/PAL; 3/STE; 3/OLE;2/LIO; 1/LIN; 2/IOD; 1/OIL; 1/PRO; 1/CEW; 1/STW; 1/TSW; 1/SEB; 1/YLD; 1/DTM
[20]
2 RILs 233 4,497 SNPs LM GM 24 14/PLH; 10/TL [18]
F2 112 2,339 SNPs LM GM 12 1/PLH; 1/TL; 3/YLD;
3/STW; 2/FY; 2/FC
[22]
Core collection 224 146,959 SNPs AM SS 43 9/PLH; 3/TL; 13/NB; 8/FN; 10/TSW
[26]
Core collection 224 584,987 SNPs AM SS 23 2/PLH; 1/FN; 8/TSW; 3/TL; 1/PAL; 2/STE; 1/LIO; 3/LIN; 2/FC
[17]
Core collection 200 771,914 SNPs AM PCPs 11 7/MC; 4/HC [27] 2 RILs and 1
DH
260 17,288 SNPs AM PCPs 33 1/YLD; 8/OIL; 5/PLH; 4/PAL; 3/IOD, LIN, LIO, 2/DTM; 2/STE; 1/PRO; 1/OLE
[28]
Core collection 370 258,873 SNPs AM RCPs 67 67 PAS [14]
Pop: population. Ref: reference sequences or linkage maps for QTL identification.
68
1 LM: bi-parental population-based QTL mapping; AM: association mapping or genome-wide
69
association study.
70
2 GM: genetic map; SS: scaffold based reference sequences [25]; RCPs: recent release of the
71
chromosome-scale pseudomolecules [29]; PCPs: pre-released version of the chromosome-scale
72
pseudomolecules.
73
3 See Table 1 for trait name abbreviations.
74
2. Materials and Methods
75
2.1. The most Recent Release of the Chromosome-scale Pseudomolecules
76
Chromosome-scale pseudomolecules for flax were recently released [29]. A total of 622 scaffolds
77
from the flax reference genome [25] were sorted onto 15 chromosomes totaling 316.2 Mb. Thus, SNPs
78
identified based on scaffold reference sequences can be accurately mapped to the pseudomolecules.
79
The 15 pseudomolecule sequences corresponding to 15 chromosomes were downloaded from the
80
National Center for Biotechnology Information (NCBI) database. The accession numbers of the
81
pseudomolecules for the 15 chromosomes are CP027619 (Lu1), CP027626 (Lu2), CP027627 (Lu3),
82
CP027620 (Lu10), CP027621 (Lu11), CP027622 (Lu12), CP027623 (Lu13), CP027624 (Lu14), and
84
CP027625 (Lu15). Chromosome sizes are listed in Table S1.
85
2.2. Marker Infomation of QTL in Flax
86
All 267 flax QTL identified in different studies are based on three types of markers: amplified
87
fragment length polymorphsims (ALFPs), SSRs, and SNPs. PCR primer sequences of AFLPs and SSRs
88
were retrieved from the literature [15,19-21,23,24]. For SNPs based on the scaffold sequences, scaffold
89
names and coordinates of SNPs on scaffolds were collected directly from the publications [17,26]. For
90
SNPs identified without a reference [18], flanking sequences of the SNP markers were downloaded
91
from the publication [18]. All available primer sequences of SSR markers and flanking sequences of
92
SNP markers for the identified QTL are listed in Tables S2 and S3, respectively.
93
2.3. Mapping PCR-based Markers to the Most Recent Release of the Chromosome-scale Pseudomolecules
94
PCR primer sequences of markers were mapped onto the RCPs using the electronic PCR (E-PCR)
95
tool [31]. A pipeline using E-PCR was developed. This pipeline includes two Perl scripts:
96
ProgramS1_prepare_rePCR.pl (Program S1) and ProgramS2_rePCR_pipeline.pl (Program S2).
97
Program S1 is a script that creates a search database of the RCPs, outputting two files for the
98
downstream analysis: *.famap and *.hash. Program 2 is a script that performs electronic PCR to map
99
paired primers onto the RCPs, generating result files with coordinates of the primers on
100
chromosomes and the amplicon sizes. No nucleotide mismatches or gaps are usually allowed. The
101
operations of these programs are described in User guide S1.
102
PCR primers designed from sequences of different genotypes were not always accurately
103
mapped to the RCPs using the E-PCR approach. In such cases, BLASTN searches were performed to
104
ascertain their map positions.
105
2.4. Mapping SNPs to the Most Recent Release of the Chromosome-scale Pseudomolecules
106
If SNPs were identified using the flax scaffold reference sequences [25], then their coordinates
107
were accurately converted to the RCPs’ coordinates. The Perl script
108
ProgramS3_convert_scaffold_coordinates_to_pseudochr.pl (Program S3) executes this conversion. A
109
database file for the accurate relationship between scaffolds and the RCPs (Table S4) is required to
110
run this program. This program’s implementation is described in User guide S1.
111
For SNPs identified without a reference sequence [18], SNPs’ flanking sequences were searched
112
against the RCPs using BLASTN at an E-value of 10-30. The alignment regions of top hits were used
113
and manually verified.
114
The coordinates of SNPs based on the PCPs in two publications [27,28] were first retrieved for
115
their scaffold names and corresponding coordinates on the scaffolds because these SNPs were
116
initially identified from scaffold sequences. These SNPs were then converted to the RCPs using
117
Program S3.
118
2.5. Grouping QTL to Clusters
119
QTL mapping software tools can detect multiple significant quantitative trait nucleotides
120
(QTNs) that may be grouped into the same QTL or QTN/QTL clusters based on the LD between
121
markers [14]. QTL detected in different populations cannot be grouped based on population-
122
dependent marker LD. To provide a simple solution, we opted to group in a single QTL cluster all
123
QTL located within a 200 kb window covering 100 kb upsteam and downstream of the QTL position.
124
2.6. Candidate Gene Analysis Based on the Most Recent Release of the Chromosome-scale Pseudomolecules
125
The RCPs contain 42,277 protein coding genes and 1,327 resistance gene analogs (RGAs) [29].
126
BLASTP of flax protein sequences against A. thaliana protein sequences at an E-value of 10-10. A total
128
of 15,323 unique A. thaliana genes were mapped. Then the flax genes were searched against the NCBI
129
non-redundant protein database (nr) at an E-value of 10−5 and, functional annotations were generated
130
using a custom script that integrates protein annotation information of top hits and the orthologous
131
A. thaliana genes. The annotation results were added to the gene lists. The coordinates of all protein
132
coding genes and RGAs with their gene annotations on the released pseudomolecule are listed in
133
Tables S5 and S6, respectively. A genome-wide gene scan along chromosomes for QTL was
134
performed to characterize the underlying genomic regions and identify candidate genes. The genes
135
within a 200 kb window covering upsteam and downstream of the QTL position were scanned. A
136
Perl script ProgramS4_flax_QTL_candidate_gene_scanning.pl was developed (Program S4) to scan
137
potential candidate genes for given QTL based on the gene annotation database files in Table S3 (for
138
all protein coding genes) and Table S4 (for RGAs only). The methods for this program is described in
139
User guide S1.
140
3. Results and Discussion
141
3.1. Mapping QTL onto the Most Recent Release of the Chromosome-scale Pseudomolecules
142
In all 13 publications reporting flax QTL identification, only 67 newly reported pasmo QTL have
143
been mapped on the RCPs [14]. Therefore, mapping of the remaining 200 QTL onto the RCPs was
144
performed. A total of 195 QTL uniquely mapped to the RCPs of 15 chromosomes, including 40 SSRs
145
and 36 SNPs from genetic maps, 75 SNPs from scaffolds, and 44 SNPs from the PCPs (Figure 1 and
146
Table 3). Markers afB13 and afXR6 for two powdery mildew QTL were not mapped because their
147
AFLP primer sequences were not available [24]. One QTL for branching score failed to map because
148
its SSR marker Lu2067a could not map to any region on the RCPs; this was likely because the marker
149
was designed from a genotype different from the reference genome (cv CDC Bethune). Finally,
150
marker Lu8_185009 for QTL uq.C8–2 associated with plant height (PLH) and technical length (TL)
151
[18] mapped to two different chromosomes (Chr 4 and Chr 7).
152
It is notable that SSR/SNP markers from genetic maps mapped to a genomic region on a
153
pseudomolecule corresponding to a single marker or a pair of flanking markers, while SNP markers
154
from scaffold sequences or the PCPs anchored exclusively to the single nucleotide representing their
155
QTL peak location.
156
3.2. Identical or Co-located QTL
157
QTL mapped to the same RCPs are comparable between studies, mapping populations, and
158
traits. Based on our 200 kb upstream and downstream region rule, the 195 QTL/markers for 26 traits
159
mapped to the RCPs were grouped into 133 QTL clusters (Table 3). QTL with the same numbers in
160
the “Co-location” column in Table 3 were deemed to belong to the same QTL clusters, indicating
161
identical or co-located QTL. QTL for 16 of the 29 traits were identified in two or more studies, of
162
which 12 had one or more QTL that located at the same position or in the same QTL cluster (Table 1);
163
thereby supporting the accuracy of the QTL through validation across studies.
164
Some QTL were validated in several studies that differed in markers (SSRs or SNPs), populations
165
(bi-parental population or diverse genetic panel), or statistical methods used for QTL mapping
166
(Tables 1 and 2). For example, QTL-195 (QDTM-Lu4.1) and QTL-54 (QDm.BM.crc-LG4) on Chr 4
167
correspond to the same QTL for days to maturity (DTM) identified in two different studies [20,28].
168
QTL-187 (QIOD-Lu7.2) and QTL-7 (QIod.crc-LG7) on Chr 7 for iodine value (IOD) [19,28], QTL-190
169
(QLIN-Lu7.2) and QTL-5 (QLin.crc-LG7) on Chr 7 for linolenic acid content (LIN) [19,28], QTL-6
170
(QLin.crc-LG16) and QTL-33 (QLin-LG12.3) on Chr 12 for LIN [19,23], and QTL-4 (QLio.crc-LG16) and
171
QTL-30 (QLio-LG12.3) on Chr 12 for linoleic acid content (LIO) [19,23] are additional examples of the
172
same QTL identified in different studies. Some QTL or QTNs were grouped into single QTL because
173
their coordinates on chromosomes were close or identical and, historical recombinations may not
174
have been present in the population; for example, QTL-144 96400) and QTL-145
(scaffold11-175
(scaffold297_275113), and QTL-154 (scaffold297-275113) on Chr 1 for technical length (TL)
177
corresponded to unique QTL [17,26].
178
179
180
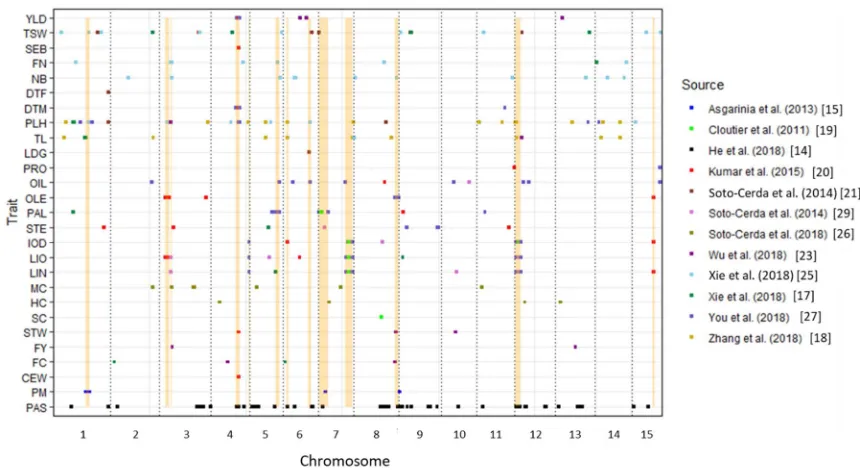
Figure 1. Distribution of 262 QTL associated with 27 traits mapping onto flax chromosomes. Of these
181
QTL, 67 for pasmo resistance have been previously mapped on the most recent release of the flax
182
pseudomolecule. Co-located regions are highlighted in yellow. See Table 1 for the trait name
183
abbreviations.
184
Some co-located QTL may lead to their pleiotropic effects on multiple traits. Thirteen genomic
185
regions that had at least three identical or co-located QTL were observed (yellow highlights in Figure
186
1 and Table 3). For example, eight QTL—QTL-195 (QDTM-Lu4.1), QTL-168 (QYLD-Lu4.1), QTL-179
187
(QPLH-Lu4.3), QTL-49 (QCw.BM.crc-LG4), QTL-54 (QDm.BM.crc-LG4), QTL-52 (QSpb.BM.crc-LG4),
188
QTL-50 (QSw.BM.crc-LG4), and QTL-53 (QYld.BM.crc-LG4)—were co-located between positions
189
13,170,489 and 15,040,682 bp on Chr 4 and had pleiotropic effects on six traits: DTM, YLD, PLH, cell
190
wall content (%) (CEW), seeds per boll (SEB), and straw weight (STW). This is thus an important
191
genomic region controlling seed yield and related agronomic traits. As noted and discussed
192
previously [19,20,28], QTL-186 (QIOD-Lu4.1), QTL-189 (LIN-Lu4.1), and QTL-192 (QLIO-Lu4.1) were
193
co-located between positions 19,907,982 and 19,907,982 bp on Chr 4; QTL-193 (QLIO-Lu7.2), QTL-190
194
(QLIN-Lu7.2), QTL-187 (QIOD-Lu7.2), QTL-7 (QIod.crc-LG7), QTL-5 (QLin.crc-LG7), and QTL-3
195
(QLio.crc-LG7) were between positions 14,540,252 and 17,976,903 bp on Chr 7; QTL-188
(QIOD-196
Lu12.3), QTL-191 (QLIN-Lu12.3), and QTL-194 (QLIO-Lu12.3) located in the 489,561 and 2,981,562 bp
197
interval on Chr 12; and 6 (QLin.crc-LG16), 33 (QLin-LG12.3), 4 (QLio.crc-LG16),
QTL-198
30 (QLio-LG12.3), and QTL-8 (QIod.crc-LG16) positioned between 2,036,216 and 3,802,807 bp on Chr
199
12. These four genomic regions contributed greatly to the genetic variation for LIO, LIN, and IOD in
200
flax populations [19,20,28].
201
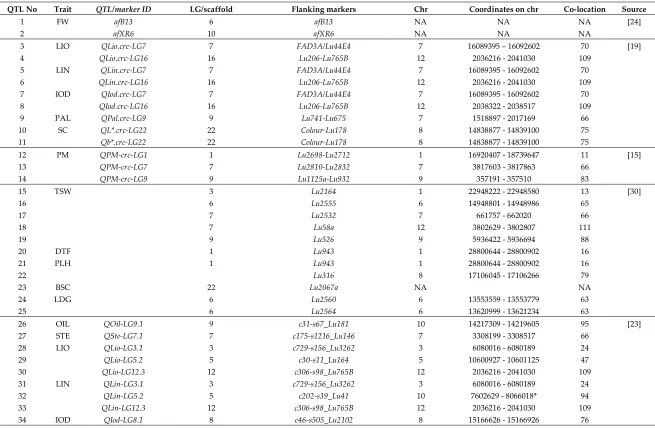
Table 3.QTL mapping to the recently released chromosome-scale pseudomolecules.
QTL No Trait QTL/marker ID LG/scaffold Flanking markers Chr Coordinates on chr Co-location Source
1 FW afB13 6 afB13 NA NA NA [24]
2 afXR6 10 afXR6 NA NA NA
3 LIO QLio.crc-LG7 7 FAD3A/Lu44E4 7 16089395 – 16092602 70 [19]
4 QLio.crc-LG16 16 Lu206-Lu765B 12 2036216 - 2041030 109
5 LIN QLin.crc-LG7 7 FAD3A/Lu44E4 7 16089395 - 16092602 70
6 QLin.crc-LG16 16 Lu206-Lu765B 12 2036216 - 2041030 109
7 IOD QIod.crc-LG7 7 FAD3A/Lu44E4 7 16089395 - 16092602 70
8 QIod.crc-LG16 16 Lu206-Lu765B 12 2038322 - 2038517 109
9 PAL QPal.crc-LG9 9 Lu741-Lu675 7 1518897 - 2017169 66
10 SC QL*.crc-LG22 22 Colour-Lu178 8 14838877 - 14839100 75
11 Qb*.crc-LG22 22 Colour-Lu178 8 14838877 - 14839100 75
12 PM QPM-crc-LG1 1 Lu2698-Lu2712 1 16920407 - 18739647 11 [15]
13 QPM-crc-LG7 7 Lu2810-Lu2832 7 3817603 - 3817863 66
14 QPM-crc-LG9 9 Lu1125a-Lu932 9 357191 - 357510 83
15 TSW 3 Lu2164 1 22948222 - 22948580 13 [30]
16 6 Lu2555 6 14948801 - 14948986 65
17 7 Lu2532 7 661757 - 662020 66
18 7 Lu58a 12 3802629 - 3802807 111
19 9 Lu526 9 5936422 - 5936694 88
20 DTF 1 Lu943 1 28800644 - 28800902 16
21 PLH 1 Lu943 1 28800644 - 28800902 16
22 Lu316 8 17106045 - 17106266 79
23 BSC 22 Lu2067a NA NA
24 LDG 6 Lu2560 6 13553559 - 13553779 63
25 6 Lu2564 6 13620999 - 13621234 63
26 OIL QOil-LG9.1 9 c31-s67_Lu181 10 14217309 - 14219605 95 [23]
27 STE QSte-LG7.1 7 c175-s1216_Lu146 7 3308199 - 3308517 66
28 LIO QLio-LG3.1 3 c729-s156_Lu3262 3 6080016 - 6080189 24
29 QLio-LG5.2 5 c30-s11_Lu164 5 10600927 - 10601125 47
30 QLio-LG12.3 12 c306-s98_Lu765B 12 2036216 - 2041030 109
31 LIN QLin-LG3.1 3 c729-s156_Lu3262 3 6080016 - 6080189 24
32 QLin-LG5.2 5 c202-s39_Lu41 10 7602629 - 8066018* 94
33 QLin-LG12.3 12 c306-s98_Lu765B 12 2036216 - 2041030 109
QTL No Trait QTL/marker ID LG/scaffold Flanking markers Chr Coordinates on chr Co-location Source
35 PAL QPal.BM.crc-LG7 7 Lu402/Lu7-1820805 9 2026186 - 2026487 86 [20]
36 STE QSte.BM.crc-LG1 1 Lu2183a/Lu1-2670961 1 26435050 - 26435329 15
37 QSte.BM.crc-LG3 3 Lu3-8415336/Lu2164 3 7263087 28
38 QSte.BM.crc-LG11 11 Lu2128/Lu11-19000928 11 16797707 - 16797907 102
39 OLE QOle.BM.crc-LG3-1 3 Lu3-3979616/Lu3-5950394 3 3231616 - 4799670 22
40 QOle.BM.crc-LG3-2 3 Lu658/Lu3150 3 24238080 - 24238427 33
41 QOle.BM.crc-LG5 5 Lu5-9728492 15 11375006 131
42 LIO QLio.BM.crc-LG3 3 Lu3-3979616/Lu3-5950394 3 3231616 - 4799670 22
43 QLio.BM.crc-LG6 6 Lu2545 6 8616550 - 8616919 61
44 LIN QLin.BM.crc-LG5 5 Lu5-9728492 15 11375006 131
45 IOD QIod.BM.crc-LG5 5 Lu5-9728492 15 11375006 131
46 QIod.BM.crc-LG6 6 Lu6-2260313/Lu6-2330258 6 2018434 - 2088579 57
47 OIL QOil.BM.crc-LG8 8 Lu8-22516618/Lu3189 8 16363106 - 16363334 78
48 PRO QPro.BM.crc-LG11 11 Lu11-21716266/Lu52 11 19594198 - 19594398 105
49 CEW QCw.BM.crc-LG4 4 Lu2031 4 14489225 - 14489333 40
50 STW QSw.BM.crc-LG4 4 Lu2031 4 14489225 - 14489333 40
51 TSW QTsw.BM.crc-LG15 15 Lu2010a/Lu2001 3 20394564 - 20394673 31
52 SEB QSpb.BM.crc-LG4 4 Lu2031 4 14489225 - 14489333 40
53 YLD QYld.BM.crc-LG4 4 Lu2031 4 14489225 - 14489333 40
54 DTM QDm.BM.crc-LG4 4 Lu2031 4 14489225 - 14489333 40
55 PLH uq.C1–1 Lu1_396428 1 6539309 - 6539089 3 [18]
56 uq.C3–1 Lu3_693423 3 25295008 - 25294801 34
57 uq.C4–1 Lu4_300701 4 19453432 - 19453704 42
58 uq.C5–1 Lu5_8504 5 8681823 - 8682018 45
59 uq.C6–1 Lu6_639236 6 2175711 - 2175911 57
60 uq.C8–2 Lu8_185009 7 (4) 6427466 – 6427621 (6238294
- 6238449)
61 uq.C8–3 Lu8_119488 8 28706 - 28938 72
62 uq.C9–1 Lu9_503128 14 4498680 - 4498955 122
63 uq.C11–1 Lu11_557617 11 1276828 - 1277143 96
64 uq.C11–1 Lu11_447048 11 13338945 - 13339276 100
65 uq.C12–1 Lu12_696508 12 1004697 - 1004929 108
66 uq.C12–1 Lu12_163596 12 351979 - 352221 106
67 uq.C13–1 Lu13_367183 13 8997700 - 8998007 115
68 uq.C14–1 Lu14_231853 14 13485754 - 13486113 126
QTL No Trait QTL/marker ID LG/scaffold Flanking markers Chr Coordinates on chr Co-location Source
70 uq.C2–2 Lu2_597057 2 22508975 - 22508683 21
71 uq.C5–1 Lu5_8504 5 8681823 - 8682018 45
72 uq.C6–1 Lu6_639236 6 2175711 - 2175911 57
73 uq.C7–1 Lu7_781312 7 18087445 - 18087733 71
74 uq.C8–1 Lu8_646184 8 20045574 - 20045815 80
75 uq.C8–2 Lu8_185009 7 (4) 6427466 – 6427621 (6238294
- 6238449)
76 uq.C9–2 Lu9_618122 14 3378716 - 3378969 121
77 uq.C12–1 Lu12_696508 12 1004697 - 1004929 108
78 uq.C14–1 Lu14_231853 14 13485754 - 13486113 126
79 PLH Marker4371 scaffold156 (LG1) 3 6019156 - 6019499 24 [22]
80 TL Marker747228 scaffold2786 (LG8) 12 3620608 - 3620934 110
81 YLD Marker799956 scaffold319 (LG10) 13 3856362 - 3856771 114
82 Marker770415 scaffold117 (LG12) 6 11929857 - 11930253 62
83 Marker1073071 scaffold27 (LG12) 6 8701939 - 8702324 61
84 STW Marker326151 scaffold33 (LG5) 8 22241866 - 22242226 81
85 Marker2368217 scaffold355 (LG15) 10 7140622 - 7140988 92
86 Marker614116 scaffold355 (LG15) 10 7219061 - 7219445 93
87 FY Marker2603286 scaffold156 (LG1) 3 6573623 - 6574023 27
88 Marker1722134 scaffold127 (LG11) 13 10603161 - 10603485 116
89 FC Marker1051901 scaffold680 (LG5) 8 21807786 - 21808148 81
90 Marker1561746 scaffold376 (LG11) 4 8748431 - 8748795 36
91 PLH scaffold112_114241 scaffold112 scaffold112_114241 1 18444086 11 [26]
92 scaffold1491_318496 scaffold1491 scaffold1491_318496 6 14006651 63
93 scaffold31_1800846 scaffold31 scaffold31_1800846 3 3929932 22
94 scaffold344_309662 scaffold344 scaffold344_309662 1 11008279 6
95 scaffold51_1349321 scaffold51 scaffold51_1349321 4 10532424 37
96 scaffold59_572553 scaffold59 scaffold59_572553 1 10051709 4
97 scaffold156_641874 scaffold156 scaffold156_641874 3 5906791 23
98 scaffold147_367986 scaffold147 scaffold147_367986 5 11288517 48
99 scaffold859_123972 scaffold859 scaffold859_123972 15 1939372 129
100 TL scaffold297_275113 scaffold297 scaffold297_275113 1 16435852 9
101 scaffold361_14957 scaffold361 scaffold361_14957 1 16726904 10
102 scaffold273_68457 scaffold273 scaffold273_68457 8 585113 73
103 NB scaffold116_30201 scaffold116 scaffold116_30201 2 9550662 18
QTL No Trait QTL/marker ID LG/scaffold Flanking markers Chr Coordinates on chr Co-location Source
105 scaffold1863_545 scaffold1863 scaffold1863_545 8 1223698 74
106 scaffold212_601171 scaffold212 scaffold212_601171 6 6380495 60
107 scaffold353_773806 scaffold353 scaffold353_773806 5 16077893 54
108 scaffold42_494571 scaffold42 scaffold42_494571 13 15861394 117
109 scaffold464_754364 scaffold464 scaffold464_754364 14 15460919 127
110 scaffold635_43971 scaffold635 scaffold635_43971 8 22494547 82
111 scaffold977_784147 scaffold977 scaffold977_784147 11 18799131 104
112 scaffold212_216830 scaffold212 scaffold212_216830 6 5996154 59
113 scaffold359_282990 scaffold359 scaffold359_282990 14 6711296 124
114 scaffold359_289139 scaffold359 scaffold359_289139 14 6705147 123
115 scaffold977_469888 scaffold977 scaffold977_469888 11 18484872 103
116 FN scaffold137_111000 scaffold137 scaffold137_111000 1 11869417 7
117 scaffold225_427119 scaffold225 scaffold225_427119 8 15994154 77
118 scaffold687_121617 scaffold687 scaffold687_121617 14 16813947 128
119 scaffold156_761294 scaffold156 scaffold156_761294 3 6026211 24
120 scaffold413_1116527 scaffold413 scaffold413_1116527 4 16914228 41
121 scaffold156_1203677 scaffold156 scaffold156_1203677 3 6468562 26
122 scaffold413_388319 scaffold413 scaffold413_388319 5 14910709 52
123 scaffold687_123666 scaffold687 scaffold687_123666 14 16811898 128
124 TSW scaffold101_354340 scaffold101 scaffold101_354340 3 20942454 32
125 scaffold112_184204 scaffold112 scaffold112_184204 1 18514049 11
126 scaffold1143_190268 scaffold1143 scaffold1143_190268 1 4375935 1
127 scaffold1155_171787 scaffold1155 scaffold1155_171787 15 7690615 130
128 scaffold123_1191347 scaffold123 scaffold123_1191347 11 3875819 98
129 scaffold1317_154716 scaffold1317 scaffold1317_154716 15 15275145 133
130 scaffold132_713877 scaffold132 scaffold132_713877 1 24877317 14
131 scaffold1491_58878 scaffold1491 scaffold1491_58878 6 14266269 64
132 scaffold15_1207948 scaffold15 scaffold15_1207948 5 16914987 55
133 scaffold1519_272169 scaffold1519 scaffold1519_272169 9 1027739 84
134 FN scaffold346-438191 scaffold346 scaffold346-438191 14 1083228 120 [17]
135 TSW scaffold43-1111162 scaffold43 scaffold43-1111162 2 21989104 19
136 scaffold51-598586 scaffold51 scaffold51-598586 4 11283142 39
137 scaffold51-598611 scaffold51 scaffold51-598611 4 11283117 39
138 scaffold51-699833 scaffold51 scaffold51-699833 4 11181895 38
139 scaffold261-925068 scaffold261 scaffold261-925068 9 6419385 80
QTL No Trait QTL/marker ID LG/scaffold Flanking markers Chr Coordinates on chr Co-location Source
141 scaffold373-545816 scaffold373 scaffold373-545816 13 17912706 119
142 scaffold107-300735 scaffold107 scaffold107-300735 2 22405177 20
143 PAL scaffold59-164258 scaffold59 scaffold59-164258 1 10459958 5
144 STE scaffold11-96400 scaffold11 scaffold11-96400 5 9964973 46
145 scaffold11-96569 scaffold11 scaffold11-96569 5 9965142 46
146 LIO scaffold1253-27622 scaffold1253 scaffold1253-27622 9 1922095 85
147 LIN scaffold416-80582 scaffold416 scaffold416-80582 5 13560525 50
148 scaffold302-224377 scaffold302 scaffold302-224377 5 13889425 51
149 scaffold302-224395 scaffold302 scaffold302-224395 5 13889443 51
150 FC scaffold179-179593 scaffold179 scaffold179-179593 2 2253135 17
151 scaffold866-116645 scaffold866 scaffold866-116645 6 1083247 56
152 PLH scaffold344-309662 scaffold344 scaffold344-309662 1 11008279 6
153 scaffold59-572553 scaffold59 scaffold59-572553 1 10051709 4
154 TL scaffold297-275113 scaffold297 scaffold297-275113 1 16435852 9
155 scaffold297-275131 scaffold297 scaffold297-275131 1 16435834 9
156 scaffold361-14957 scaffold361 scaffold361-14957 1 16726904 10
157 MC Lu2-22298066 2 Lu2-22298066 2 22402960 20 [27]
158 Lu3-25559600 3 Lu3-25559600 3 17645461 29
159 Lu3-26033342 3 Lu3-26033342 3 18058033 30
160 Lu3-7398487 3 Lu3-7398487 3 6246253 25
161 Lu5-3808878 5 Lu5-3808878 5 4087340 44
162 Lu7-13225294 7 Lu7-13225294 7 12048040 68
163 Lu11-2498303 11 Lu11-2498303 11 2755439 97
164 HC Lu7-6577527 7 Lu7-6577527 7 5834429 67
165 Lu10-21552161 10 Lu10-21552161 4 4609469 35
166 Lu12-5267706 12 Lu12-5267706 12 5160897 112
167 Lu13-2803224 13 Lu13-2803224 13 2764903 113
168 YLD QYLD-Lu4.1 4 Lu4-13594936 - Lu4-14968389 4 13593668 - 14966967 40 [28]
169 OIL QOIL-Lu2.1 2 Lu2-21913720 - Lu2-21913720 2 21912675 19
170 QOIL-Lu5.2 5 Lu5-15704607 - Lu5-15705039 5 15703416 - 15703848 53
171 QOIL-Lu6.3 6 Lu6-4879632 - Lu6-4879632 6 4879493 58
172 QOIL-Lu6.4 6 Lu6-13799180 - Lu6-13970951 6 13798861 - 13970632 63
173 QOIL-Lu7.4 7 Lu7-14209179 - Lu7-14209179 7 14208772 69
174 QOIL-Lu10.5 10 Lu10-6517448 - Lu10-6517448 10 6517339 91
175 QOIL-Lu12.6 12 Lu12-4591214 - Lu12-7491405 12 4591134 - 7490902 112
QTL No Trait QTL/marker ID LG/scaffold Flanking markers Chr Coordinates on chr Co-location Source
177 PLH QPLH-Lu1.1 1 Lu1-13887715 - Lu1-13930292 1 13887346 - 13929923 8
178 QPLH-Lu1.2 1 Lu1-20012490 - Lu1-20012490 1 20011813 12
179 QPLH-Lu4.3 4 Lu4-14305982 - Lu4-15042104 4 14304616 - 15040682 40
180 QPLH-Lu13.4 13 Lu13-17243884 - Lu13-17243884 13 17242916 118
181 QPLH-Lu13.5 14 Lu14-2320469 - Lu14-2320469 14 2320188 121
182 PAL QPAL-Lu5.1 5 Lu5-12062376 - Lu5-12182441 5 12061283 - 12181348 49
183 QPAL-Lu5.2 5 Lu5-13797851 - Lu5-15668995 5 13796740 - 15667804 51
184 QPAL-Lu7.3 7 Lu7-624461 - Lu7-5423691 7 624439 - 5423600 66
185 QPAL-Lu11.4 11 Lu11-4417685 - Lu11-4429424 11 4417306 - 4429045 99
186 IOD QIOD-Lu4.1 4 Lu4-19909467 - Lu4-19909467 4 19907982 43
187 QIOD-Lu7.2 7 Lu7-15346458 - Lu7-17977459 7 15346004 - 17976903 70
188 QIOD-Lu12.3 12 Lu12-489561 - Lu12-2981642 12 489561 - 2981562 107
189 LIN QLIN-Lu4.1 4 Lu4-19909467 - Lu4-19909467 4 19907982 43
190 QLIN-Lu7.2 7 Lu7-14540719 - Lu7-17977459 7 14540265 - 17976903 70
191 QLIN-Lu12.3 12 Lu12-489561 - Lu12-2981642 12 489561 - 2981562 107
192 LIO QLIO-Lu4.1 4 Lu4-19909467 - Lu4-19909467 4 19907982 43
193 QLIO-Lu7.2 7 Lu7-14540706 - Lu7-17977459 7 14540252 - 17976903 70
194 QLIO-Lu12.3 12 Lu12-489561 - Lu12-2981642 12 489561 - 2981562 107
195 DTM QDTM-Lu4.1 4 Lu4-13171757 - Lu4-15042104 4 13170489 - 15040682 40
196 QDTM-Lu11.2 11 Lu11-14768686 - Lu11-14768686 11 14767787 101
197 STE QSTE-Lu9.1 9 Lu9-4229230 - Lu9-4229230 9 4229031 87
198 QSTE-Lu9.2 9 Lu9-20080531 - Lu9-21636823 9 20079433 - 20654527 90
199 PRO QPRO-Lu15.1 15 Lu15-14746288 - Lu15-14746310 15 14745616 - 14745638 132
200 OLE QOLE-Lu8.1 8 Lu8-21782841 - Lu8-23527563 8 21781910 - 23526575 81
1
2
3.3.Candidate Genes for QTL
3
The resolution of current QTL mapping or GWAS technologies is insufficient to pin QTL to
4
accurate locations of genes or genetic features controlling traits. A simple approach for predicting
5
candidate genes is to find related genes on the nearest regions within a QTL, such as a window of 200
6
kb downstream and upstream of a QTL [14,20]. For example, three QTL for powdery mildew
7
resistance were identified [15] and mapped to chromosomes 1, 7, and 9 (Table 3, Figure 1). Some
8
RGAs were found in the vicinity of the QTL, i.e., within the pre-defined window (Table 4). One
9
nucleotide binding site (NBS) encoding gene (Lus10026765), one transmembrane coiled-coil (TM-CC)
10
gene (Lus10023437), and several receptor-like protein kinase (RLK) genes co-located with these QTL.
11
Table 4. Resistant gene analog (RGA) candidates near three QTL for flax powdery mildew resistance.
12
QTL No.
QTL Chr QTL Coordinates (bp)
RGA Gene location on chr (bp)
Gene annotation
12 QPM-crc-LG1 1 16920407 - 18739647 Lus10026756 17134471 RLK
Lus10026761 17159664 RLK
Lus10026765 17189168 NBS
Lus10009703 18125241 RLK
13 QPM-crc-LG7 7 3817603 – 3817863 Lus10023437 3725947 TM-CC
14 QPM-crc-LG9 9 357191 – 357510 Lus10001677 429431 RLK
NBS: nucleotide binding site; RLK: receptor-like protein kinase; TM-CC: transmembrane coiled-coil.
13
4. Conclusion
14
To date, a total of 267 QTL for 29 flax quantitative traits have been reported. However, these
15
QTL were identified based on different references, including genetic maps, scaffold sequences, and
16
chromosome-scale pseudomolecules. This article details the methods, software tools, and database
17
files used to uniquely map these previously identified QTL onto the RCPs. Using these methods, 195
18
out of 200 QTL that are not based on the RCPs were successfully sorted onto 15 chromosomes and
19
grouped into 133 co-located QTL clusters, showing genomic regions associated with and/or
20
pleiotropic to important agronomic and seed quality traits. Mapping of the QTL identified in different
21
studies to the same reference allows comparisons across QTL and facilitates genome-wide QTL
22
analysis, candidate gene prediction, and breeding applications.
23
24
Supplementary Materials: The following are available online at www.mdpi.com/xxx/s1.
25
Table S1. Information related to the pseudomolecules of 15 chromosomes in the NCBI database. The
26
downloaded sequences from NCBI are used as input for Program S1.
27
Table S2. Primer sequences of SSR markers for the identified QTL.
28
Table S3. Flanking sequences of SNP markers for the identified QTL.
29
Table S4. Coordinates of flax scaffold sequences on the most recent release of the chromosome-scale
30
pseudomolecules. This file is used as input for Program S2.
31
Table S5. Coordinates and annotations of flax protein coding genes on the most recent release of the
32
chromosome-scale pseudomolecules. This file is used as input for Program S4.
33
Table S6. Coordinates and annotations of flax resistance gene analogs on the recently released
chromosome-34
scale pseudomolecules. This file is used as input for Program S4.
35
36
Program S1. A Perl script to prepare a search database of reference sequences for electronic PCR. Program file
37
name: ProgramS1_prepare_rePCR.pl.
38
Program S2. A Perl script to perform electronic PCR, i.e., map a pair of PCR primer sequences to a reference
39
sequence. Program file name: ProgramS2_rePCR_pipeline.pl.
40
Program S3. A Perl script to convert coordinates of flax scaffold sequences onto the chromosome-scale
41
Program S4. A Perl script to extract all candidate genes and gene annotation information (protein-coding genes
43
or specifically resistance gene analogs) within a genomic region of a QTL or a marker. Program file name:
44
ProgramS4_flax_QTL_candidate_gene_scanning.pl
45
User guide S1. A user guide for executions of Programs S1, S2, S3, and S4.
46
Author Contributions: Conceptualization, F.M.Y. and S.C.; methodology, F.M.Y.; software, F.M.Y.; validation,
47
F.M.Y. and S.C.; formal analysis, F.M.Y. and S.C.; investigation, F.M.Y. and S.C.; writing—original draft
48
preparation, F.M.Y.; writing—review and editing, S.C.
49
Funding: This research was funded by Agriculture and Agri-Food Canada, Projects J-001672 and J-002035.
50
Acknowledgments: The authors thank Zhen Yao for figure editing.
51
Conflicts of Interest: The authors declare no conflict of interest.
52
53
Reference
54
1. Falconer, D.S. Introduction to Quantitative Genetics. Createspace Independent Publishing Platform: 2007.
55
2. Sehgal, D.; Singh, R.; Rajpal, V.R. Quantitative trait loci mapping in plants: concepts and approaches.
56
In Molecular Breeding for Sustainable Crop Improvement, Rajpal, V. R.; Rao, S. R.; Raina, S. N., Eds.
57
Springer: 2016; Vol. 11, pp 31-59.
58
3. Price, A.H. Believe it or not, QTLs are accurate! Trends Plant Sci. 2006, 11, (5), 213-216.
59
4. Yu, J.; Holland, J.B.; McMullen, M.D.; Buckler, E.S. Genetic design and statistical power of nested
60
association mapping in maize. Genetics 2008, 178, (1), 539-551.
61
5. Monir, M.M.; Zhu, J. Dominance and epistasis interactions revealed as important variants for leaf traits
62
of maize NAM population. Front. Plant Sci. 2018, 9, 627.
63
6. Ren, D.; Fang, X.; Jiang, P.; Zhang, G.; Hu, J.; Wang, X.; Meng, Q.; Cui, W.; Lan, S.; Ma, X., et al. Genetic
64
architecture of nitrogen-deficiency tolerance in wheat seedlings based on a nested association mapping
65
(NAM) population. Front. Plant Sci. 2018, 9, 845.
66
7. Cavanagh, C.; Morell, M.; Mackay, I.; Powell, W. From mutations to MAGIC: resources for gene
67
discovery, validation and delivery in crop plants. Curr. Opin. Plant Biol. 2008, 11, (2), 215-221.
68
8. Mackay, I.; Powell, W. Methods for linkage disequilibrium mapping in crops. Trends Plant Sci. 2007, 12,
69
(2), 57-63.
70
9. Camargo, A.V.; Mackay, I.; Mott, R.; Han, J.; Doonan, J.H.; Askew, K.; Corke, F.; Williams, K.; Bentley,
71
A.R. Functional mapping of quantitative trait loci (QTLs) associated with plant performance in a wheat
72
MAGIC mapping population. Front. Plant Sci. 2018, 9, 887.
73
10. Ongom, P.O.; Ejeta, G. Mating design and genetic structure of a multi-parent advanced generation
74
intercross (MAGIC) population of sorghum (Sorghum bicolor (L.) Moench). G3 (Bethesda) 2018, 8, (1),
331-75
341.
76
11. Cloutier, S.; Miranda, E.; Ward, K.; Radovanovic, N.; Reimer, E.; Walichnowski, A.; Datla, R.; Rowland,
77
G.; Duguid, S.; Ragupathy, R. Simple sequence repeat marker development from bacterial artificial
78
chromosome end sequences and expressed sequence tags of flax (Linum usitatissimum L.). Theor. Appl.
79
Genet. 2012, 125, (4), 685-694.
80
12. Cloutier, S.; Niu, Z.; Datla, R.; Duguid, S. Development and analysis of EST-SSRs for flax (Linum
81
usitatissimum L.). Theor. Appl. Genet. 2009, 119, (1), 53-63.
82
13. Kumar, S.; You, F.M.; Cloutier, S. Genome wide SNP discovery in flax through next generation
83
14. He, L.; Xiao, J.; Rashid, K.Y.; Yao, Z.; Li, P.; Jia, G.; Wang, X.; Cloutier, S.; You, F.M. Genome-wide
85
association studies for pasmo resistance in flax (Linum usitatissimum L.). Front. Plant Sci. 2018, doi:
86
10.3389/fpls.2018.01982
87
15. Asgarinia, P.; Cloutier, S.; Duguid, S.; Rashid, K.; Mirlohi, A.; Banik, M.; Saeidi, G. Mapping quantitative
88
trait loci for powdery mildew resistance in flax (Linum usitatissimum L.). Crop Sci. 2013, 53, (6),
2462-89
2472.
90
16. Cloutier, S.; Ragupathy, R.; Miranda, E.; Radovanovic, N.; Reimer, E.; Walichnowski, A.; Ward, K.;
91
Rowland, G.; Duguid, S.; Banik, M. Integrated consensus genetic and physical maps of flax (Linum
92
usitatissimum L.). Theor. Appl. Genet. 2012, 125, (8), 1783-1795.
93
17. Xie, D.; Dai, Z.; Yang, Z.; Tang, Q.; Sun, J.; Yang, X.; Song, X.; Lu, Y.; Zhao, D.; Zhang, L., et al. Genomic
94
variations and association study of agronomic traits in flax. BMC Genomics 2018, 19, (1), 512.
95
18. Zhang, J.; Long, Y.; Wang, L.; Dang, Z.; Zhang, T.; Song, X.; Dang, Z.; Pei, X. Consensus genetic linkage
96
map construction and QTL mapping for plant height-related traits in linseed flax (Linum usitatissimum
97
L.). BMC Plant Biol. 2018, 18, (1), 160.
98
19. Cloutier, S.; Ragupathy, R.; Niu, Z.; Duguid, S. SSR-based linkage map of flax (Linum usitatissimum L.)
99
and mapping of QTLs underlying fatty acid composition traits. Mol. Breed. 2011, 28, (4), 437-451.
100
20. Kumar, S.; You, F.M.; Duguid, S.; Booker, H.; Rowland, G.; Cloutier, S. QTL for fatty acid composition
101
and yield in linseed (Linum usitatissimum L.). Theor. Appl. Genet. 2015, 128, (5), 965-984.
102
21. Soto-Cerda, B.J.; Duguid, S.; Booker, H.; Rowland, G.; Diederichsen, A.; Cloutier, S. Genomic regions
103
underlying agronomic traits in linseed (Linum usitatissimum L.) as revealed by association mapping. J.
104
Integrat. Plant Biol. 2014, 56, (1), 75-87.
105
22. Wu, J.; Zhao, Q.; Zhang, L.; Li, S.; Ma, Y.; Pan, L.; Lin, H.; Wu, G.; Yuan, H.; Yu, Y., et al. QTL mapping
106
of fiber-related traits based on a high-density genetic map in flax (Linum usitatissimum L.). Front. Plant
107
Sci. 2018, 9, 885.
108
23. Soto-Cerda, B.J.; Duguid, S.; Booker, H.; Rowland, G.; Diederichsen, A.; Cloutier, S. Association
109
mapping of seed quality traits using the Canadian flax (Linum usitatissimum L.) core collection. Theor.
110
Appl. Genet. 2014, 127, (4), 881-896.
111
24. Spielmeyer, W.; Green, A.G.; Bittisnich, D.; Mendham, N.; Lagudah, E.S. Identification of quantitative
112
trait loci contributing to Fusarium wilt resistance on an AFLP linkage map of flax (Linum usitatissimum).
113
Theor. Appl. Genet. 1998, 97, (4), 633-641.
114
25. Wang, Z.; Hobson, N.; Galindo, L.; Zhu, S.; Shi, D.; McDill, J.; Yang, L.; Hawkins, S.; Neutelings, G.;
115
Datla, R., et al. The genome of flax (Linum usitatissimum) assembled de novo from short shotgun sequence
116
reads. Plant J. 2012, 72, (3), 461-473.
117
26. Xie, D.; Dai, Z.; Yang, Z.; Sun, J.; Zhao, D.; Yang, X.; Zhang, L.; Tang, Q.; Su, J. Genome-wide association
118
study identifying candidate genes influencing important agronomic traits of flax (Linum usitatissimum
119
L.) using SLAF-seq. Front. Plant Sci. 2018, 8, 2232.
120
27. Soto-Cerda, B.J.; Cloutier, S.; Quian, R.; Gajardo, H.A.; Olivos, M.; You, F.M. Genome-wide association
121
analysis of mucilage and hull content in flax (Linum usitatissimum L.) seeds. Int. J. Mol. Sci. 2018, 19, (10),
122
2870.
123
28. You, F.M.; Xiao, J.; Li, P.; Yao, Z.; Jia, G.; He, L.; Kumar, S.; Soto-Cerda, B.; Duguid, S.D.; Booker, H.M.,
124
et al. Genome-wide association study and selection signatures detect genomic regions associated with
125
29. You, F.M.; Xiao, J.; Li, P.; Yao, Z.; Jia, G.; He, L.; Zhu, T.; Luo, M.-C.; Wang, X.; Deyholos, M.K., et al.
127
Chromosome-scale pseudomolecules refined by optical, physical, and genetic maps in flax. Plant J. 2018,
128
95, (2), 371-384.
129
30. Soto-Cerda, B.J.; Duguid, S.; Booker, H.; Rowland, G.; Diederichsen, A.; Cloutier, S. Genomic regions
130
underlying agronomic traits in linseed (Linum usitatissimum L.) as revealed by association mapping. J.
131
Integrat. Plant Biol. 2013, 56, (1), 75-87.
132
31. Schuler, G.D. Sequence mapping by electronic PCR. Genome Res. 1997, 7, (5), 541-550.