Article
Seismic Damage Recognition Based on Watershed
Segmentation of SAR Image Texture Features
Qiang Li 1,2, Lixia Gong 1,*, Jingfa Zhang 2
1 Institute of Engineering Mechanics, China Earthquake Administration, Harbin 150080, China; [email protected](Q.L.)
2 Key Laboratory of Crustal Dynamics, Institute of Crustal Dynamics, China Earthquake Administration, Beijing 100085, China; [email protected](J.Z.)
* Correspondence:[email protected]; Tel.: +86-10-62846725
Abstract: The information of seismic damage of buildings in SAR images of different time phase, especially in SAR images after earthquake, is easily disturbed by other factors, which affects the accuracy of information discrimination. In order to identify and evaluate the distribution information of the seismic damage accurately and make full use of the abundant texture features in the SAR image. The conventional method of change detection based on texture features usually takes the pixel as the calculating unit. In this paper, a method of texture feature change detection of SAR images based on watershed segmentation algorithm is proposed. Based on the optimization of texture feature parameters, the feature parameters are segmented by the watershed segmentation algorithm, and the feature object image is obtained. This method introduces the idea of object oriented, and carries out the calculation of the difference map at the object level, Finally, the classification threshold value of different types of seismic damage types is selected, and the recognition of building damage is achieved. Taking the ALOS data before and after the earthquake in Yushu as an example to verify the effectiveness of the method, the overall accuracy of the building extraction is 88.9%, Compared with pixel-based methods, it is proved that the proposed method is effective.
Keywords: seismic damage building; watershed segmentation; SAR; texture feature; change detection
1. Introduction
Synthetic aperture radar (SAR) can penetrate cloud haze and have all day long and all-weather ability to obtain the information of ground, Since 1950s, it has been widely used in the field of surface subsidence monitoring, topographic mapping, resource exploration, environmental remote sensing and military, etc. In recent years, with the rapid development of the technology of SAR, the SAR image building change detection [1] has become a research hotspot [2-5], especially after the earthquake, SAR technology can overcome the effects of bad weather and obtain images after the earthquake quickly, so as to extract the earthquake damage to buildings as soon as possible.
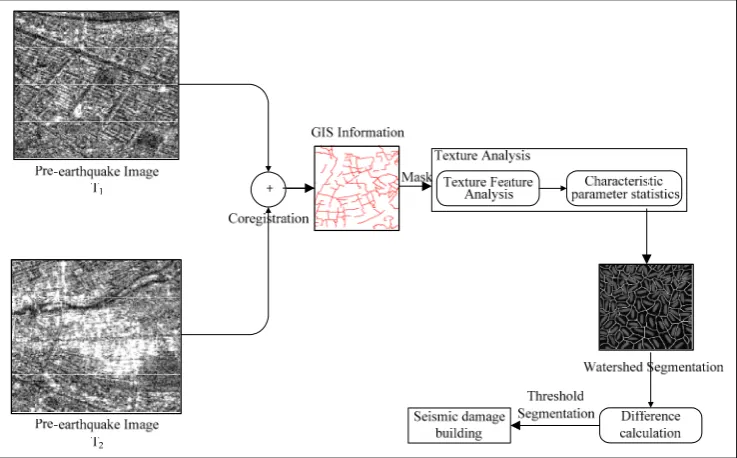
based on texture feature is usually expressed in the form of the difference map. The method is based on the pixel calculation and cannot represent the whole change of the object image, while the main goal of image segmentation is to divide the image into an integral part of the real world objects or regions. The idea of object oriented is introduced, which makes the change detection more meaningful. In this paper, we calculate the omnidirectional texture value of 8 kinds of texture features based on gray level co-occurrence matrix (GLCM). Then, the texture feature is segmented by the watershed segmentation method. The difference of texture features of SAR image is calculated on the object-based level; finally, the information of seismic damage is extracted. The method technical flow chart is shown in figure 1.
Figure 1. Technical flow chart
2. Materials and Methods
Before the feature analysis, the image needs to be processed by filtering in order to reduce the influence of speckle noise of SAR image. There are many filtering algorithms, such as Lee filter, Frost filter, Frost filter, enhanced Kuan filter and Gamma filter, In this paper, the enhance the Lee filter with the window size of 3×3 is used. The method proposed in this paper is divided into three main processes: (1) Texture feature analysis and statistics ;(2) Watershed segmentation for texture feature;(3) Split object difference analysis.
2.1 Texture Feature Analysis and Statistics
SAR image texture mainly reflects the spatial distribution and roughness of the surface, which represents the characteristics of the object surface, and it is an important symbol of the discrimination of surface features. As the texture of SAR image is very rich, the texture analysis of SAR image is more and more used in various fields. Due to the lack of spatial information of SAR image, the rich texture information is the best feature of SAR image information recognition.
extraction based on gray level co-occurrence matrix is a classical statistical analysis method, which has been applied to the texture extraction of high resolution remote sensing image and multi spectral remote sensing image [17]
In this paper, the co-occurrence probability texture feature is used to extract texture features ,The co-occurrence probability texture feature is a statistical method based on texture description, which uses co-occurrence matrix GLCM grey-level to describe the texture feature[18]. The co-occurrence probability texture feature is proposed by the Haralick using gray level co-occurrence matrix [19]. The gray level co-occurrence matrix emphasizes the spatial dependence of the gray level, which is characterized by the spatial relation of the pixels in a texture pattern[20]. Gray level co-occurrence matrix is a matrix function of pixel distance and angle, it reflects the image in the direction, distance, change the amplitude and speed of the integrated information through the calculation of the image of a certain distance and the direction of the correlation between the two points. The texture characteristic parameters of seismic damage buildings mainly include Mean (ME), variance (VA), contrast (CON), entropy (ENT), homogeneity (HOM), dissimilarity (DI), correlation (COR), angular second moment (ASM).
= =×
=
iNjJi
P
ijME
, 0 ,(1)
ME
reflects the local change of image.
−= × −
= , 10 2
, ( )
N j
i i Pi j i ME
VA
(2) VA is expressed in the form of gray level co-occurrence matrix, which is a measure of the pixel
value and the mean deviation.
− = − = − = −= = 1 0 1 0 1 | | 0 , 2 N n N i N n j ij j i P n CON(3) CON reflects the extent of image clarity and texture of the grooves.
j i N i N j j i p P ENT , 1 0 1 0 , log
− = − ==
(4)
ENT represents the degree or complexity of the texture in the image, which is a measure of the
amount of information in the image, and it is a measure of randomness.
) ) ( 1 /( 2 1 0 1 0
, i j P HOM N i N j j
i + −
=
− =−
=
(5)
HOM can reflect the homogeneity of image texture, how much the local change of image
texture is measured.
−= × −
= , 10 , | |
N j
i i Pij i j
DI
(6)
DI
and contrast are linear correlation, the greater the local contrast, the greater the difference.2 1 2 1 1 0 1 0 , /σσ − =
− = − = u u ijP COR N i N j j i(7)
Where
− = − = − = − = − = − = − = − = − = − = = = 1 0 1 0 , 2 2 2 2 1 0 1 0 , 2 1 2 1 1 0 1 0 , 2 1 0 , 1 0 1 ) ( ) ( N j Ni ij N i N j j i N j N i j i N
j ij N i P u j P u i P j u P i u σ σ
COR measures the similarity degree of spatial GLCM elements in row or column direction.
2 1 0 , ,
− = × = Nij i Pi jASM
(8)
ASM is the square sum of the element value of the gray level co-occurrence matrix, which reflects the uniformity of the distribution of the image and the thickness of the texture.
In the above formula, i,j=0,1,2,3...N-1,N is the image gray series,
u
represents mean,σ
represents variance,
P
i,jrepresents the pixel starting from the image gray level i, statistics theoccurrence probability of gray level of
j
pixels with the distance toδ
.2.1.1 Determination of texture parameters
The texture features are described by gray level co-occurrence matrix. The gray level co-occurrence matrix is related to the chosen direction, step size, window size and image quantization level, so the parameters of the gray level co-occurrence matrix should be selected according to the specific image texture feature. According to the experience, taking the average value of 4 degrees, 0°, 45°, 90° and 135° as the GLCM of the local image center pixel position. The change of image quantization level has little effect on the GLCM of the image. In this study, the image quantization level is 64. The smaller step size can reflect the texture characteristics. In this paper, the step length is 1.
Figure 2.The curve of the texture feature parameters with the change of the window size
2.1.2 Texture Feature Selection
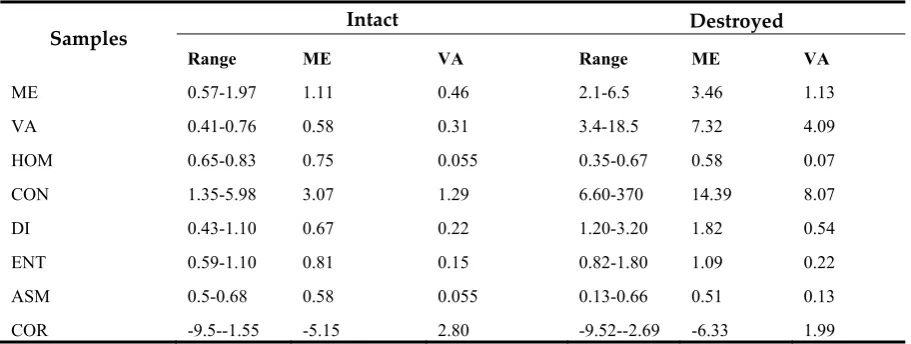
According to the image characteristics, the characteristics of the obvious, clear building samples were chosen to carry out statistical characteristics. Among them, the basic intact of the category is 25, the destruction of the category is 39. Statistical parameters are as follows: ME,VA, CON,ENT,HOM,DI,COR,ASM(Table 1).
Table 1. Statistical results of SAR samples
Samples Intact Destroyed
Range ME VA Range ME VA
ME 0.57-1.97 1.11 0.46 2.1-6.5 3.46 1.13
VA 0.41-0.76 0.58 0.31 3.4-18.5 7.32 4.09
HOM 0.65-0.83 0.75 0.055 0.35-0.67 0.58 0.07
CON 1.35-5.98 3.07 1.29 6.60-370 14.39 8.07
DI 0.43-1.10 0.67 0.22 1.20-3.20 1.82 0.54
ENT 0.59-1.10 0.81 0.15 0.82-1.80 1.09 0.22
ASM 0.5-0.68 0.58 0.055 0.13-0.66 0.51 0.13
COR -9.5--1.55 -5.15 2.80 -9.52--2.69 -6.33 1.99
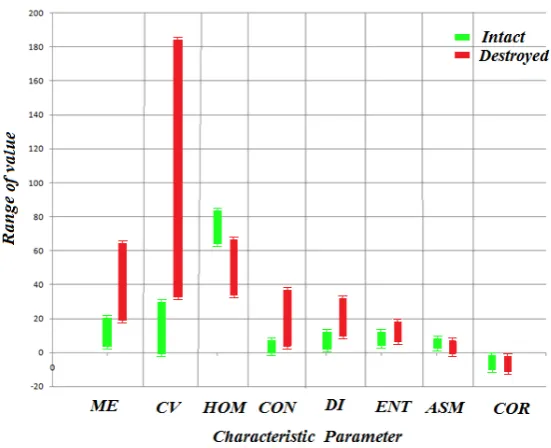
Figure 3. Statistical distribution of SAR image characteristic parameters of different types of buildings
2.2 Watershed segmentation algorithm
Watershed segmentation method is derived from the understanding of topography, this method uses a topological map to describe an image. We know that the lake and the sea correspond to the regional minima in the topography, Terrain can be completely divided into several areas, which will lead to a specific lake or sea, the lake or the sea is called a water basin. When the watershed algorithm is applied to image segmentation, the height of the topographic map corresponds to the gray value of the pixel, the larger gray value corresponds to the peak in the topographic map, and the smaller gray value corresponds to the valley in the topographic map. Water always flows downwards, it will be gathered in a valley low-lying areas. The valley called for water basin, water will eventually gathered in different water basin, watershed is that water basin between the ridges. When the water flows from the watershed to the water basin, the probability of flowing to every basin is the same. This idea is used to image segmentation in order to find the image of the water basin and the watershed, both of which are divided into the region is the goal we want to split. The schematic diagram of the watershed and the water basin is shown in figure 4.
In image segmentation, the result of the output of the watershed segmentation algorithm is the water basin image of the input image, and the watershed is the boundary between the water basins. Watershed segmentation based on distance transform, watershed segmentation based on gradient and marker based watershed segmentation are the main three kinds of classical watershed segmentation algorithms [21]. Image gradient change is often used as the basis for the segmentation of the watershed algorithm, therefore, in order to get the water basin image, the gradient amplitude is usually used to process the image, That is, the input of the watershed algorithm is the gradient image, and the gradient of the image is usually expressed as the difference between the pixel gray level[22,23].
1
2 2
2 2
( , ) { ( , )}
{
[ ( , )
( 1, )]
} {
[ ( , )
( , 1)]
}
g x y =grad f x y =f x y
−
f x
−
y
+f x y
−
f x y
−
(9)
In the formula,
f x y
( , )
represents the original image, and the grad{ }• represents the gradient operation.Firstly, the gradient image is extracted from the original image using watershed segmentation based on gradient, then the gradient image is smoothed, and finally the gradient image is divided into a watershed.
Assuming
M M
1, 2,...,M
R is the coordinate set for all local minima of the gradient image( , )
g x y
, The coordinate set of the pixel points associated with any local minimum valueM
i isdefined as C(
M
i),T n( )is a collection of coordinate( , )
s t
, where the T n( ) expression is as follows:( ) {( , ) | ( , )
}
T n
=
s t g s t
<
n
(10)( i)
n
C M
represents the coordinates of the pixels that have been flooded in the valley of theminimum value of
M
i( i) ( i) ( )
n C T n
C M
=M
(11)[ ]
C n
is the union of valley flooded part in stepn
1
[ ] ( )
R
i n i
C n
C M
=
=
(12)The flooding process of the watershed algorithm is described that the water level increases from the local minimum point to the maximum value of the gradient image with the whole number of
units.
g x y
( , )
=
n
can be seen as a horizontal plane, T n( )is the set of coordinates of all points in the horizontal plane.The watershed algorithm is low complexity, simple and easy to implement, the algorithm needs less time, and has a good response to the weak edge. Extracted object contour edge line is closed, the algorithm can accurately locate the target object. In addition, the results obtained after the watershed segmentation is a closed water basin, which is more convenient for the analysis of the characteristics of the image object.
3. Results
3.1 Study area
Figure 5. Scope and location of study area
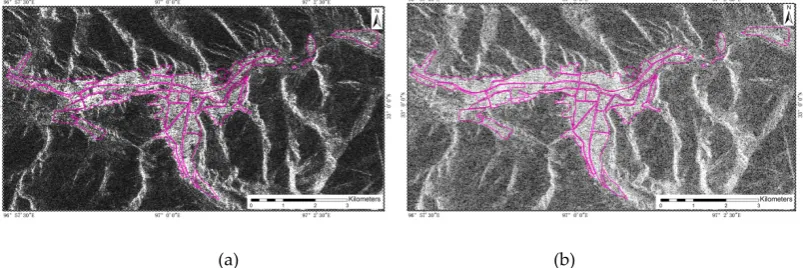
In order to verify the feasibility and accuracy of the method proposed in this paper, we will take the ALOS data to compare the experimental results, Data acquisition time is 2010.01.15 and 2010.04.17, the image resolution is 16m, the image is shown in figure 6.
(a) (b)
Figure 6. Multi temporal SAR images of Yushu earthquake zone ((a) SAR image before the earthquake, (b) SAR
image after the earthquake)
3.1 Texture feature change detection based on watershed segmentation(WSCCD)
The method of WSCCD is divided into two steps, The first step is to deal with the texture feature for watershed segmentation, and the segmentation object is combined; The second step is to seek the difference image between the texture feature object after segmentation so as to identify the information of seismic damage building. Principal component analysis is performed on the ME, HOM, CON texture feature parameters. The target layer of watershed segmentation is the first principal component.
In this paper, the calculation process of the watershed is an iterative process. The algorithm is
mainly divided into two steps, one is the sorting process, and one is the submerged process. Firstly,
the gray level of each pixel is sorted from low to high, and then in the process of flooding from low
to high, each local minimum value is judged by using the advanced first out structure in the
influence field of the H order height. Watershed algorithm has a good response to the weak edge,
image noise; the object of the gray level changes will produce over segmentation phenomenon. In
order to eliminate the over segmentation of the watershed algorithm, two methods are usually
adopted. The first is to remove the irrelevant edge information by using the prior knowledge. The
second is to modify the gradient function to make the water collecting basin only respond to the
target detected. In this paper, we use the method of modifying the gradient function to deal with the
threshold of the gradient image in order to eliminate the over segmentation caused by the small
The watershed segmentation is easy to produce over segmentation, which produces a number of
small regions, in order to reduce the number of segmented regions, the results of image processing
should be combined after segmentation. After setting the appropriate merge parameters (this paper
is set to 65), the collection of small areas can represent a small group of buildings, and the merged
image is shown in figure 7.
Figure 7.Split merge image
Texture feature image before and after earthquake is merged with the same parameters to ensure that the size of the object after the split is the same. On this basis, subtraction operation is implemented. The basic principle of image difference change detection is
ID
(
x y
,
)=|
I
2(
x y
,
)-
I
1(
x y
,
)|
(13)Assuming that I1 and I2 represent two images of the same region as phaseT1 and T2. In the
formula, ID(x,y) is the pixel value of the difference image. If the object does not change, the
corresponding pixel value in the difference image is close to 0. If the pixel value ID in the difference
image is greater than the threshold value ID, it is believed that the pixel has changed. Difference
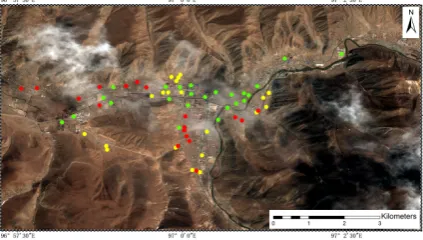
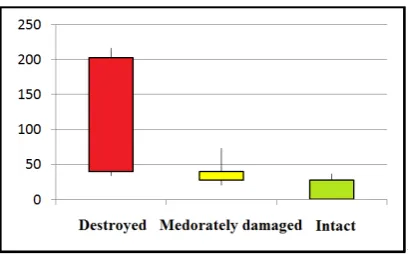
method is the most widely used change detection method at present. But in the process of application, the reasonable threshold selection is the key to determine the accuracy of the detection, In this paper, we select the buildings with different degree of damage in optical image, and count the pixel value of the difference map of the sample points, so as to determine the reasonable threshold value. Sample point distribution is shown in figure 8.
Figure 8.Sample distribution of buildings with different damage types
Figure 9.Threshold distribution range of earthquake damage to buildings
Figure. 10.Results of earthquake damage to buildings based on watershed segmentation
Figure. 11. The results of visual interpretation of optical image
The results of the analysis of the building and the visual interpretation of the optical image (figure 11) are compared, the extraction area of three buildings with different damage degree is calculated and compared with the visual results, and the extraction accuracy is evaluated.
3.2 Difference change detection based on texture feature(TFDCD)
Figure 12. Distribution of the results of the earthquake damage
4. DISCUSSION
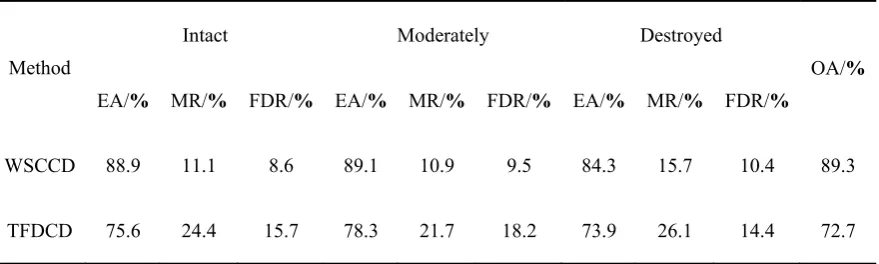
In this paper, the original image texture feature change detection method is as a result of comparison. Due to the lack of field survey data, the results of visual interpretation of QuickBird optical images are the basis of the results. The area extracted is as the evaluation criterion for quantitative evaluation of information extraction results. The extraction accuracy of the two kinds of methods is calculated respectively, and the comparison is shown in the Table 2.
Table 2Comparison of three kinds of methods of building extraction accuracy with different damage degree,
the extraction accuracy including the extraction accuracy (EA), missed rate (MR), false detection rate (FDR) and
overall accuracy (OA).
Method
Intact Moderately Destroyed
OA/%
EA/% MR/% FDR/% EA/% MR/% FDR/% EA/% MR/% FDR/%
WSCCD 88.9 11.1 8.6 89.1 10.9 9.5 84.3 15.7 10.4 89.3
TFDCD 75.6 24.4 15.7 78.3 21.7 18.2 73.9 26.1 14.4 72.7
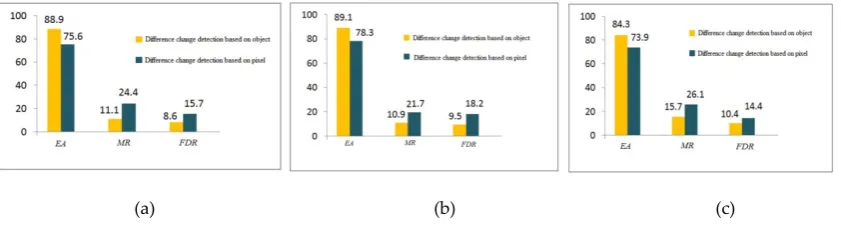
The EA, MR and FDR of the two methods were compared, comparison is shown in figure 13. Through (a), (b), (c), the EA of the three types of damaged buildings of WSCCD is higher than that of the direct difference change detection, the EA is 88.9% and 75.6% respectively. By comparing the image, the result of the direct difference change detection method is more broken. Difference distribution between the pixel and the pixel is more dispersed and distributed around the threshold of jump points is more; direct difference of pixel is easy to cause the miscarriage of justice and miscarriage of justice.
(a) (b) (c)
Figure 13.Comparison of the accuracy of different damage types of buildings
Remote sensing images of different data sources have different characteristics of earthquake damage, so there are also differences in texture characteristics, the texture features used in this paper are three characteristic parameters of ME, HOM, CON, and the first principal component of which is chosen to participate in the analysis and calculation. The texture feature parameters of different types of image and damage degree may not be the same, the extraction accuracy will be different.
5. Conclusions
This paper proposes a texture feature change detection method based on watershed segmentation, This method uses the watershed segmentation algorithm to segment the texture feature and get the texture feature after obtaining the optimal texture feature, Then, the characteristic object image is subtracted to detect the difference, and the samples are selected to calculate the classification threshold so as to get the distribution information of the earthquake damage buildings. Taking the ALOS data of Yushu earthquake as an example, the proposed method has higher accuracy compared with the direct difference change detection method of the texture feature. The method made a breakthrough in the following points
:( )
1 Taking the texture feature object as the unit to participate in the change detection algorithm, the idea of object oriented is introduced to change detection, which breaks the conventional change detection method mode with pixel as the unit;(2) The watershed segmentation algorithm is applied to the texture feature based on statistics, which makes the segmentation more meaningful. The traditional change detection algorithm usually uses pixels as the calculating unit, the results often accompanied by a large number of broken spots, in this paper, the breakthrough point 1 will have the same characteristics of the pixel set to form the image object, and change detection takes the object as a unit, and avoids the generation of pixel spot. The generation of HOM is based on gray level statistics, the watershed segmentation method is used to describe the image of the image, and the gray value of the image pixel corresponds to the height of the topographic map, so the idea of the segmentation method is consistent with the statistical texture feature calculation method. The thought is also the breakthrough point 2 of this paper, which makes the texture feature segmentation of the object more in line with the actual object, and thus improves the recognition accuracy.Taking the Yushu earthquake as an example, the effectiveness of the method is proved. Experimental results show that the texture feature change detection method based on watershed segmentation can effectively identify the seismic damage building information, and can improve the recognition accuracy compared with the direct change detection method based on pixel. In accuracy comparison process, due to the lack of detailed field survey data of Yushu earthquake, So the visual interpretation result of block is used as a comparison basis, To a certain extent, which will affect the accuracy of the calculation. In the future work, it will be possible to select the detailed results of the investigation of the single building with the field as the validation data. At the same time, this paper only selects one of the best texture features. In the future, how to integrate the texture features into the segmentation operation is also the focus of the study.
Acknowledgments:The authors wish to thank the anonymous reviewers for their comments. This work was
supported by the National Natural Science Foundation of China (Grant No. 41374050), Major Projects of High
Author Contributions: G.LX and L.Q. conceived and designed the experiments; L.Q. performed the experiments; L.Q. analyzed the data; G.LX and L.Q. wrote the paper.All authors read and approved the manuscript.
Conflicts of Interest: The authors declare no conflict of interest.
References
1. HANCHICHAS.; CHAABANE F. On the SAR Change Detection Review and Optimal
Decision[J].International Journal of Remote Sensing.2014, 5,1693-1714.
2. MARINO A.; HAJNSEK I.A. Change Detector Based on an Optimization with Polarimetric SAR
Imagery[J].IEEE Transaction on Geoscience and Remote Sensing.2014, 8,4781-4798.
3. AGHABABAEE H.; AMINI J.; TZENG Y C. Improving Change Detection Methods of SAR Image Using
Fractals. Science Iranica,2013, 1,15-22.
4. AGHABABAEE H; AMINI J; TZENG Y C, et al. Unsupervised Change Detection on SAR Image Using a
New Fractal-based Measure. Photogrammetrie-Fernerkundung-Geoinformation. 2013, 3,209-22.
5. XIONG Boli.; CHEN J M.; KUANG Gangyao. A Change Detection Measure Based on a Likelihood Ratio
and Statistical Properties of SAR Intensity Images.Remote Sensing Letters.2012, 3,267-275.
6. HAO Hongmei.; ZHANG Yonghong.; SHI Haiyan. Application of Test Statistic Method in Fully
Polarimetric SAR Change Detection.Journal of Remote Sensing.2012, 3,520-532.
7. AGHABABAEE H.;TZENG Y C.; AMINI J. Swarm. Intelligence and Fractals in Dual-pol Synthetic
Aperture Radar Image Change Deception.Journal of Applied Remote Sensing. 2012, 1, 63596-63586.
8. HUANG Shiqi.;. LIU Daizhi.;. HU Mingxing. Multi-temporal SAR Image Change Detection Technique
Based on Wavelet Transform. Acta Geodaetica et Cartographica Sinica. 2010, 2,180-186.
9. GAO Congshan.; ZHANG Hong.; WANG Chao.SAR Change Detection Based on Generalized Gamma
Distribution Divergence and Auto-threshold Segmentation. Journal of Remote Sensing.2010, 4,710-724.
10. HU Zhaoling. An Unsupervised Change Deception Approach Based on KI Dual Thresholds under the
Generalized Gauss Model Assumption in SAR Images. Acta Geodaetica et Cartographical Sinica.2013,
1,116-122.
11. HAN Chunming.; GUO Huadong.; WANG Changlin. The Essence of SAR Image Speckle Suppression.
Journal of Remote Sensing.2002, 6,470-474.
12. MESER G.;SERPICO S B. Unsupervised Change Detection from Multichannel SAR Data by Markovian
Data Fusion.IEEE Transactions on Geoscience and Remote Sensing.2009, 7,2114-2128.
13. WANG Guangxue.;HUANG Xiaotao.; ZHOU Zhimin. A New SAR Image Change Detection Algorithm
Based on Texture Feature. Proceeding of the 3rd International Asia-Pacific Conference on Synthetic
Aperture Rader. Seoul ,Korea:IEEE,2011.
14. GONG Maoguo.;LI Yu.;JIAO lichen. SAR Change Detection Based on Intensity and Texture Changes.
ISPRS Journal of Photogrammetry and Remote Sensing.2014,93,123-135.
15. CHEN Zhipeng.; DENG Peng.; CHONG Jinsong. Application of Textural Features to Change Detection in
SAR Image. Remote Sensing Technology and Application.2002, 3,162-166.
16. LIU Li.; KUANG Gangyao. Overview of Image Textural Feature Extraction Methods. Journal of Image and
Graphics.2009, 4,622-635.
17. Hu Z L.; Li H Q.; Du P J. Study on the Extraction of Texture Features and It s Application in Classifying
SAR Images. Journal of China University of Mining & Technology.2009, 3,422-427.
18. TUCER YAN M.;JAIN A K. Texture Analysis, CHEN C H,PAU A F,WANG PS P. The Handbook of
19. Pesar esi M.; Benediktsso n J A. A New Approach for the Morph logical Segmentation of High resolution
Satellite Imagery. IEEE Transactions on Geoscience and Remote Sensing.2001, 2,309-320.
20. Chen Z P.; Deng P. Application of Textural Features to Change Detection in SAR Image. REMOTE
SENSING TECHNOLOGY AND APPLICATION.2002, 3,162-166.
21. LOWE D G. Distinctive Image Feature from Scale-invariant Keypoint. International Journal of Computer
Vision.2004, 2, 91-110.
22. Digabel H.; Lantuejoul C. Iterative algorithms. Proceeding 2nd European Sump. Quantitative Analysis of
Microstructures in Material Science, Biology and Medicine. Sturrgart West Germany: Riederer Verlag,
1978.
23. Vincent L.; Soille, P. Watersheds in digital spaces: an efficient algorithm based on immersion simulations.
IEEE Transactions on Pattern Analysis and Machine Intelligence.1991, 6,583-598.
24. Yu S Z. Investigation and analysis of earthquake damage to the residential buildings in Yushu M7.1
earthquake. Journal of Civil, Architectural &Environmental Engineering.2010, 32,13-15.
25. Li J W.; Bo J S.; Lu T. Seismic damage analysis of school buildings in Yushu Ms 7.1 earthquake. JOURNAL
OF NATURAL DISASTERS.2013, 22,123-129.