Type of the Paper (Article)
1
An
Experimental Characterization for Injection Quantity
2
of a High-Pressure Fuel Injector in GDI Engines
3
Wen-Chang Tsai
4
Department of Electrical Engineering
5
Kao Yuan University, Luju 82151, Kaohsiung City, Taiwan
6
Correspondence: [email protected]; Tel.: +886-7-6077018
7
8
Abstract: In GDI engine applications, high-pressure (H.P.) injectors typically require to be designed
9
to be capable of rapid response for GDI engines in order to be driven in the rapid response with
10
respect to magnetic actuators, allowing for example more precise air-fuel ratio control in the GDI
11
engines. The H.P. fuel injector is a highly dynamic component requiring careful voltage and
12
pressure input modulation to achieve the required fuel injection quantities of GDI engines. The
13
accurate fuel injection curves are a key influence for this technology, therefore will require the
14
estimation of the fuel flow rate to be realized. In this paper, a PIC microchip for programming
15
injector drive circuits is implemented to improve the performance of a H.P. fuel injector and tested
16
to verify its feasibility. In the proposed injector drive circuit, powers MOSFETs directly control the
17
charging/discharging current by a dsPIC30F4011 microchip. Design and analysis of the proposed
18
injector drive circuit are presented. Next, effects of total pulse width, injector supply voltage, fuel
19
system pressure and PWM operation on fuel injection quantities of a H.P. fuel injector are
20
measured. Also, the measured data of the H.P. fuel injector fed by the injector driving circuit are
21
defined as the fuel injection curves. Finally experimental results are provided for verification of the
22
proposed injector drive circuit.
23
Keywords: dsPIC30F4011 microchip, Injector Driving Circuit, Fuel Injection Curves, GDI Engines
24
25
Nomenclature
26
Symbols Description Unit
27
H.P. High-pressure bar
28
GDI Gasoline-direct-injection
29
AFR Air-fuel ratio
30
MOSFET Metal oxide semiconductor field effect transistor
31
PWM Pulse width modulation
32
ECU Electronic control unit
33
PFI Port fuel injection
34
PCB Printed circuit board
35
TDC Top dead center
36
rpm revolutions per minute
37
Ip1 First turn-on pulse signal
38
mfuel Fuel injection mass g
39
tp Injection pulse duration μs
40
41
1. Introduction
42
Many advanced solenoid fuel injection techniques have been developed to implement in various
43
investigations of GDI engines [1-3]. The electronic unit injector is the major component in the high
44
pressure fuel injection system. The injector driving circuit was optimized and projected to generate
45
optimal values of two stage currents by a coupled simulation of injector electromagnetic, needle
46
rigid body motion and computational fluid dynamics model [4]. Two-stage current shapes were
47
found to be the optimal power strategy for driving the fuel injector under different supply pressures.
48
It helps us to get a better analysis of the performance of the driving circuits [5]. The injector drive
49
circuit was optimized by controlling the current across the solenoid, which further increased the
50
response speed of the valve. Experimental results show that current drive circuit is feasible and
51
reliable to implement for practical applications [6]. The development of an electrical drive for the
52
high-pressure GDI injector was studied for a 500cc motorbike engine. A programmable injector
53
drive circuit is designed and simulated by using PSpice software. Three-stage driving current (two
54
pulse time and adjustable PWM duties) can be optimized by a predetermined current control
55
algorithm [7]. The different types of power losses associated with a solenoid injector were
56
investigated with the help of software simulation. There were remarkable differences in the power
57
losses and the performances of the injector, when it worked within different driven strategies.
58
Simulation results of power losses were validated by comparing to experimental results [8]. Various
59
electrical driving circuit designs for the H.P. fuel injector are proposed and the experimental data of
60
the H.P. fuel injection system are investigated [9-10].
61
In this study, injector driving circuits are designed to satisfy the rapid response and sustain the
62
instantaneous surge currents for various H.P. GDI injectors. The designed electric driving circuit is
63
tested to verify its feasibility. The experiment for the GDI injection quantities is conducted under
64
60-100 bar fuel pressure, 1200-2000μs injecting pulse duration and DC 40~70V executing supply
65
voltage. Also, PWM on/off control operation is introduced to the holding current during the last
66
pulse duration for rapid response time to turn off the GDI injector. Design and analysis of the
67
proposed injector drive circuit are presented in the paper. Next, effects of total pulse width, injector
68
supply voltage, fuel system pressure and PWM operation on fuel injection quantities of a H.P. fuel
69
injector are measured and the measured data of the H.P. fuel injector fed by the injector driving
70
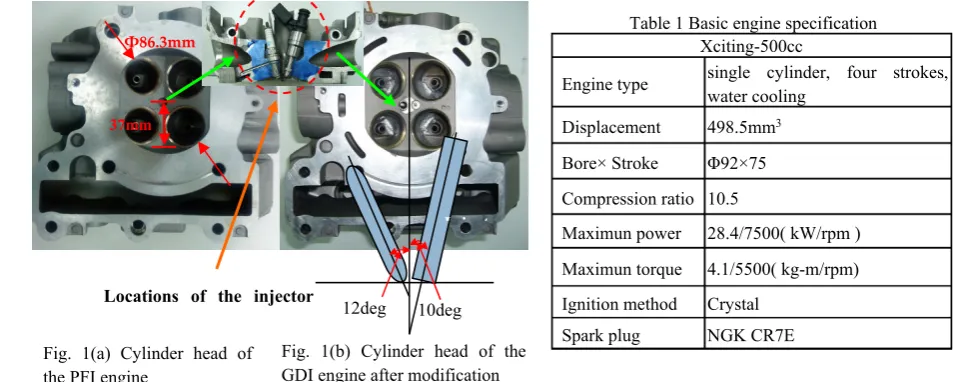
circuit are defined as the fuel injection curves. Fig. 1(a) illustrates the cylinder head of the PFI engine.
71
The specifications of the base engine with the PFI injection are shown in Table 1. Fig. 1(b) shows a
72
schematic picture of this PFI engine with certain modifications in its cylinder head. Limited by the
73
structure of the cylinder head, the fuel injector and the spark plug are respectively center-mounted
74
at an induced angle of the left-hand 100 and the right-hand 120 to the vertical plane between the
75
intake and exhaust valves. A testing study is carried out on the modified KYMCO Xciting-500 GDI
76
engine. Experimental configuration of a 500c.c. GDI engine system is shown in Fig. 2. Results show
77
that the H.P. fuel supply system for GDI engines is capable of operating stably and assuring the
78
accurate injection quantities by the three-pulse power MOSFETs electric driving circuit.
79
80
81
82
83
84
85
86
87
88
89
90
91
92
93
94
95
2. The High-Pressure GDI Fuel Injection System
96
In-cylinder direct injection technology is a superior option choice due to its advantages in potential
97
fuel economy and emission reduction. One of the most important technologies is the GDI fuel
98
injecting system, of which the H.P. fuel injector is the central component. A H.P. fuel supply system
99
of GDI engines directly injects fuel to the cylinder of the engine. The injecting timing and duration is
100
electronically controlled by an Electronic Control Unit (ECU). Various pulse durations can be sent to
101
Table 1 Basic engine specification Xciting-500cc
Engine type single cylinder, four strokes, water cooling
Displacement 498.5mm3
Bore× Stroke Φ92×75
Compression ratio 10.5
Maximun power 28.4/7500( kW/rpm )
Maximun torque 4.1/5500( kg-m/rpm)
Ignition method Crystal
Spark plug NGK CR7E
Fig. 1(b) Cylinder head of the GDI engine after modification 37mm
Φ86.3mm
12deg 10deg
I j t S
Locations of the injector
the fuel injector according to the engine’s actual operating conditions from the signals of engine
102
sensors. The H.P. fuel injection system mainly comprises of four parts: the fuel supply system,
103
electronic control unit (ECU), electrical driving circuit and an injector. The fuel supply system
104
provides a constant 60-100 bar pressure resource for the injector. The injection pulse duration and
105
timing of the injector are controlled by using the Electronic Control Unit (ECU), which computes and
106
analyzes the analogue and digital input signals from various engine sensors. The engine
107
performances can be improved by more rapid engine response in throttle positions, and more
108
precise control of air/fuel ratio. In this study, a Bosch GDI single-hole injector is installed and tested
109
on the cylinder head of a 500c.c. motorcycle engine.
110
111
112
113
114
115
116
117
118
119
120
121
122
123
124
125
126
127
2.1. Fuel Supply System
128
The fuel supply system is similar to the conventional design of GDI engines in H.P. fuel containers.
129
This research adopts a Bosch GDI single-hole injector to be installed in the test device. Its pressure
130
can be operated between 60 and 100 bar (max) which has been commonly used in some GDI engines.
131
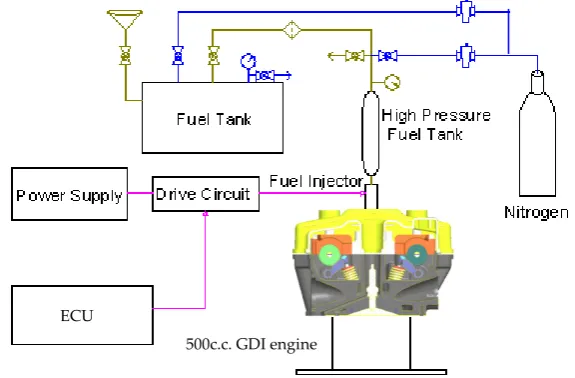
In the fuel supply system illustrated in Fig. 2, the H.P. Nitrogen
bottle
pulls the operating pressure132
of the stainless fuel cylinder up to 60-100 bar (max). It is expected to maintain this constant value to
133
avoid any disturbances to the GDI injector performance caused by the gasoline pump pressure dip
134
at high speed operation of motorcycle engines. The cylinder pressure is maintained at a constant
135
value through regulating H.P. Nitrogen flow. The pressure fluctuation of the fuel container, caused
136
by closing and opening of the nozzle is about 0.5 bar.
137
The experimental equipment for characterizing the dynamic performances of the H.P. GDI
138
injector are illustrated in Fig. 3(a). According to the test requirements, the parameters of the fuel
139
injection system are calibrated properly to each part of the injector driving circuit. After the
140
characterization of the injector’s dynamic performances, the fuel pressure in the GDI Bosch injector
141
mounted onto a 500c.c. motorcycle engine cylinder head is set at 60-100 bar for the running test.
142
2.2. High-pressure Fuel Injector
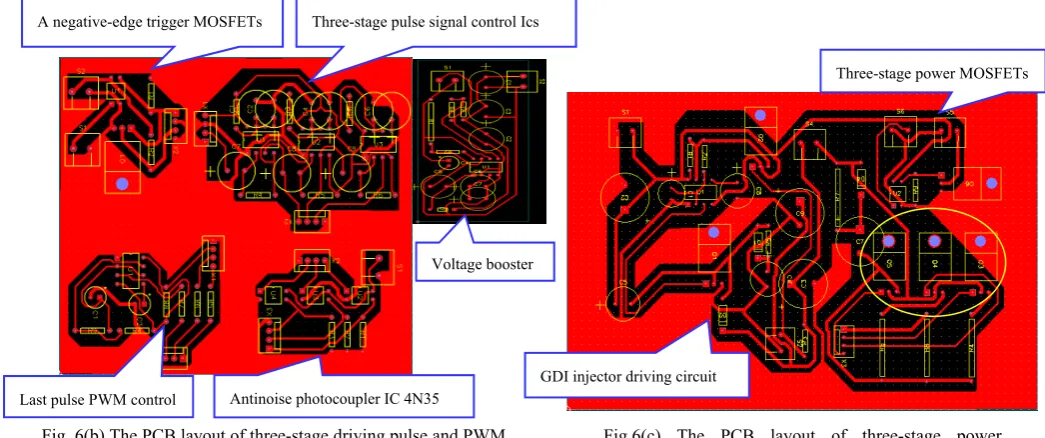
143
In order to investigate the effect of the total pulse width on the fuel injection quantities, the
144
power voltage is supplied by DC 60 V and the pressure of the fuel supply system were set to and 100
145
bar. A H.P. GDI injector is preferred for engines with small displacement in relation to the optimum
146
angle of fuel atomization and spray penetration. However, due to the constraints of limited
147
researches into the development of small motorcycle GDI engines, it requires time to design, test,
148
modify and calibrate such a swirl injector. Taking all these into account, the Bosch GDI single-hole
149
injector is adopted based on analyzing the working principle of the electronic controlled injector.
150
The injector is driven by a three-stage current waveform according to the injector characteristics. It
151
Fig. 2 Experimental test configuration of a 500cc GDI motorbike engine system
ECU
uses the solenoid valve as electricity-fluid conversion element and controls the injection parameters
152
precisely through the reference current waveforms. The minimum injection quantities is about
153
1200μs pulse duration and 14.07 mg in each pulse. This satisfies requirements of the idle operation of
154
motorcycle engines. In order to accurately control the expected air-fuel ratio of GDI motorcycle
155
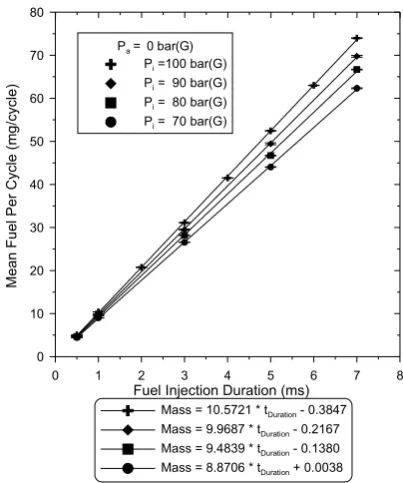
engines, effect of various fuel pressures and pulse widths on fuel injection quantities for the GDI
156
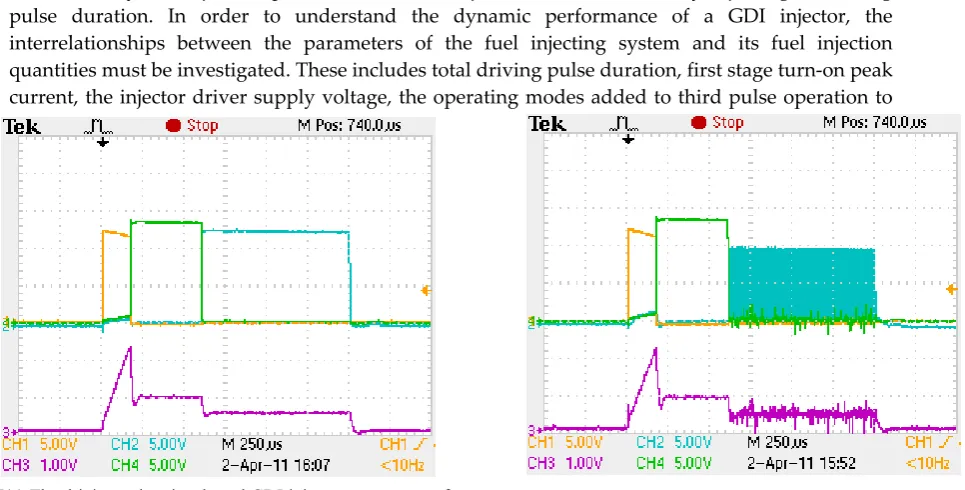
injector fed by the single-pulse (12A) driving current was examined and characterized as illustrated
157
in Fig. 3(b) [7].
158
159
160
161
162
163
164
165
166
167
168
169
170
171
172
173
174
175
176
177
178
179
2.3 Mathematical Model: The H.P. fuel injector system consists of three mainly coupled
180
components: (1) solenoid coil and driver; (2) fuel flow component; and (3) needle lift of injectors.
181
These state submodels can be given by the following nonlinear state model equations. The solenoid
182
coil and driver model will be
183
expressed by the states x⃗1 = [B B]T ,
184
the fuel flow model by the states x⃗2
185
= [Pbv ], and the needle lift of
186
injectors by 𝑥⃗3 =[x 𝑥 Puv Plv u 𝑢 z 𝑧
187
y 𝑦]T. α
1 , α2 , α3 , β1 , β2 , andβ3are
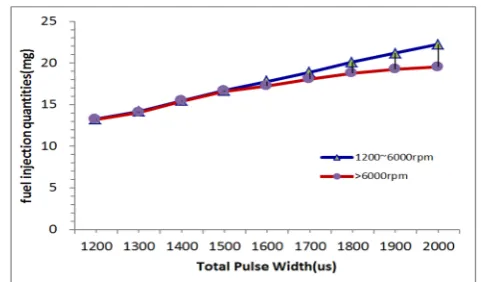
188
known functions of states and
189
inputs to determine state
190
derivatives or model outputs. [3]
191
Solenoid coil driver model:
192
x⃗2 = 𝛼⃗1 (x⃗1, u⃗1) = 𝛼⃗ 𝐵
𝐵 , 𝑉𝑢 (1)
193
y⃗1 = 𝑉
𝐵 =β⃗1 (x⃗1, u⃗1) =β⃗1 𝐵𝐵 , 𝑉𝑢 (2)
194
Fuel flow model:
195
x⃗2 = 𝛼⃗2(x⃗2, u⃗2) = 𝛼⃗ 𝑃 ,
𝑃 𝑥 𝑃
𝑃
(3)
196
Fig. 3(b) Effect of various fuel pressures and pulse widths on fuel injection quantities of the GDI injector fed by the single-pulse (12A) driving current
Fig. 3 (a) Injection quantity measurements of the H.P. GDI injector
0 1 2 3 4 5 6 7 8
Fuel Injection Duration (ms)
0 10 20 30 40 50 60 70 80
Me
an
Fue
l P
er
Cycle
(m
g/c
ycle
)
Mass = 10.5721 * tDuration - 0.3847 Mass = 9.9687 * tDuration - 0.2167 Mass = 9.4839 * tDuration - 0.1380 Mass = 8.8706 * tDuration + 0.0038 Pa = 0 bar(G)
Pi =100 bar(G) Pi = 90 bar(G) Pi = 80 bar(G) Pi = 70 bar(G)
Conical Flask
y⃗2 = 𝜔𝑃 =β⃗2 (x⃗2, u⃗2)=β⃗2 𝑃 , 𝑃 𝑥 𝑃 𝑃 (4)
197
Needle lift system model:
198
x⃗3 = 𝛼⃗3(x⃗3, u⃗3) = 𝛼⃗
⎝ ⎜ ⎜ ⎜ ⎜ ⎜ ⎛ ⎣ ⎢ ⎢ ⎢ ⎢ ⎢ ⎢ ⎢ ⎡ 𝑥𝑥 𝑃 𝑃 𝑢 𝑢 𝑧 𝑧 𝑦 𝑦 ⎦⎥ ⎥ ⎥ ⎥ ⎥ ⎥ ⎥ ⎤ , ⎣ ⎢ ⎢ ⎢ ⎢ ⎡ 𝑃𝐵 𝑃𝐿 𝑃𝐿 𝑃𝐿 𝑃𝐿 ⎦⎥ ⎥ ⎥ ⎥ ⎤ ⎠ ⎟ ⎟ ⎟ ⎟ ⎟ ⎞ (5)
199
y⃗3 =
𝑥 𝑃
𝑢 =β⃗3 (x⃗3, u⃗3)=β⃗3
⎝ ⎜ ⎜ ⎜ ⎜ ⎜ ⎛ ⎣ ⎢ ⎢ ⎢ ⎢ ⎢ ⎢ ⎢ ⎡ 𝑥𝑥 𝑃 𝑃 𝑢 𝑢 𝑧 𝑧 𝑦 𝑦 ⎦⎥ ⎥ ⎥ ⎥ ⎥ ⎥ ⎥ ⎤ , ⎣ ⎢ ⎢ ⎢ ⎢ ⎡ 𝑃𝐵 𝑃𝐿 𝑃𝐿 𝑃𝐿 𝑃𝐿 ⎦⎥ ⎥ ⎥ ⎥ ⎤ ⎠ ⎟ ⎟ ⎟ ⎟ ⎟ ⎞ (6)
200
where PLs1, PLs2, PLs3 , and PLtot are the preloads for the needle upper volume spring, needle return
201
spring, needle lower volume spring, and all injector springs, respectively. The coupling between
202
these subsystem models is shown in Fig. 4. The complete list of states is Pbv , Plv , Puv , x, x , u, u , z,
203
z, y, y, B, and 𝐵.
204
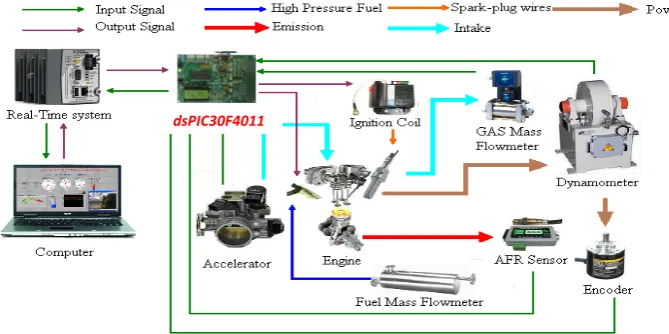
2.4 Data Acquisition Card and ECU Controller
205
The Electronic Control Unit (ECU) is designed to be capable of precise A/F ratio control according
206
to the requirements of various engine operating conditions. The injection pulse width and throttle
207
angle can be tuned by the ECU to ensure proper A/F ratio and stable power output requirements (as
208
depicted in Fig. 5). The ECU includes the NI Compact RIO controller, PCI 6221 signal acquisition
209
card, and the PCB board generating the three-stage injection pulses as well as the PWM control
210
signal. The PCI 6221 signal acquisition card collects signals such as engine speed, TDC, throttle
211
position, fuel flow volume, air flow, water temperature and fuel supply pressure etc., received from
212
various engine sensors. These signals are processed and then transmit to the PC for monitoring the
213
operating conditions of motorcycle engines. The NI Compact RIO controller performs a logic
214
operation for the A, Z and proximity switch signals of motorcycle engines to determine the TDC on
215
intake and compression of engines. The TDC on compression of engines is a reference (based) point.
216
By the reference point, the ECU performs an arithmetic computation of engine parameters as speed,
217
torque, throttle position, air flow and fuel supply pressure to achieve the delay timing and duration
218
of the injection driving pulse. The PWM control is added to the last pulse duration of injector driving
219
current to rapidly turn off the GDI injector. The pulse and PWM control circuit board outputs the
220
two different duration injection pulses and a last-stage PWM signal to drive the power MOSFETs
221
switches in injector driving circuit. Therefore, the three-stage (12/5/3 A) peak and holding current
222
profiles are generated and supplied to the solenoid valve coils of the injector to induce the
223
electromagnetic force to draw back and hold the nozzle needle of a GDI injector. The configuration
224
of PC_Based control system for the 500c.c. motorcycle engine is illustrated in Fig. 5.
225
3. Design of Injector Driving Circuit
226
This research develops various driving circuits for the H.P. fuel supply system of a 500c.c. GDI
227
motorcycle engine. The initial design of the driving circuit for the H.P. GDI fuel supply system is
228
developed by three-stage power transistors. The designed driving circuit was tested in
229
high-frequency driving pulse to execute the experiments of high-speed fuel injection quantities. The
230
antinoise photocoupler 4N35 driving ICs driven by the first and second pulses were usually
231
damaged due to surge voltages and currents exceeding their operating rating. To improve the above
232
faulty design or simplify the driving circuit, three-stage power MOSFETs driving circuits were
233
developed in this study. The GDI injector driving circuits were developed to be a practical printed
234
circuit board (PCB) to test the effect of engine speeds, pressures of the GDI fuel supply system,
235
driver supply voltages, first stage turn-on driving currents, pulse durations and PWM control added
236
to the last pulse duration on the dynamic performance of the GDI injector. Therefore, the power
237
MOSFETs components were adopted to design the GDI injector driving circuit under the operations
238
of high-frequency surge voltages and currents. The procedures for the simulation and practical
239
designs are illustrated as below:
240
241
3.1 Injector Driving Circuit
242
The governing equation is then obtained for the simple resistor-inductor circuit (RL Circuit) using
243
KVL as follows:
244
VSC = ISC RSC + LSC dISC
dt (7)
245
where VSC is the voltage across fuel injector solenoid coils;RS is the resistance of fuel injector
246
solenoid coils; LSC is the inductance of fuel injector solenoid coils.
247
From the above equation (7), the coil current is expressed by
248
ISC (t) = .(1−e SC
)= .(1−e ) (8)
249
where τ is the electrical subsystem time constant,
250
The following expression for inductance of the fuel injector solenoid coil is given by[4]
251
LSC = (9)
252
where,
253
μ1= permeability in the air [H/m]
254
N = number of solenoid coil turns
255
h = pintle height [mm]
256
d = pintle disk diameter [mm]
257
∆ = air gap[mm]
w = non-magnetic strip width [mm]
259
In order to carry on the experiments under the operations of high-frequency surge voltages and
260
currents, three-stage power MOSFETs is introduced in the design of the injector driving circuit. The
261
electric driving circuit is designed and simulated for the requirements of the GDI injector
262
characteristics in the Pspice simulation software. The Pspice model of the three-stage power
263
MOSFETs electric driving circuit is illustrated in the Fig. 6(a). After simulation and experimental
264
test, the improved electric driving circuit and PWM control added into the last pulse duration is
265
required to make a practical PCB. The PCB layouts of three-stage driving pulse and PWM control
266
signal circuit as well as power MOSFETS drive circuit are presented in Figs. 6(b) and 6(c)
267
respectively. By taking the procedures of exposure, photography development, and metallurgy
268
etching, two circuit boards was developed and then the parts were soldered into the PCB board. In
269
this work, a programmable driving module based on the working principle of the injector electric
270
driving circuit is designed and shown in Figs. 6(d) and 6(e).Three driving pulse signals are supplied
271
to drive the power MOSFETs switches of the electrical driving circuit via the photocoupler driving
272
IC 4N35. The functions of the photocoupler driving IC 4N35 are signal processing and antinoise. The
273
Fig. 6(b) The PCB layout of three-stage driving pulse and PWM control signal added to the last pulse operation
A negative-edge trigger MOSFETs Three-stage pulse signal control Ics
Voltage booster
Antinoise photocoupler IC 4N35 Last pulse PWM control
Fig.6(c) The PCB layout of three-stage power MOSFETS drive circuit
Three-stage power MOSFETs
GDI injector driving circuit
DC 5V trigger signals from ECU output are required to raise up to at least 15V voltage level using IC
274
4N35 photocoupler circuit to be able to drive the power MOSFETs switches M4~M6 as depicted in
275
Fig. 6(a). It may prevent the pulse signals from noise disturbances and protect the logic operation ICs
276
of the signal circuit against the damage of surge voltages and currents due to IGBT switching. Total
277
turn-on injection pulse duration of the GDI injector is set at a range between 1200μs and 2000μs, in
278
which the first, second and third pulse duration are 200μs, 600μs and 400~1200μs respectively. Three
279
pulse signal durations can be determined by resistors at Pin 6 and capacitors connected into the Pin 7
280
of the ICs. Total pulse duration is limited up to 3000μs. The PWM frequency has been
281
experimentally selected and applied in the last pulse, fm = 30-200(kHz). It considered as the best
282
compromise between reducing current ripple and a limited switching action from the components,
283
therefore ensuring a good injector squirting response.
284
3.2. Experimental Procedures and Measurement Conditions
285
Generally, fuel injection quantities of the GDI injector can be controlled by adjusting the driving
286
pulse duration. In order to understand the dynamic performance of a GDI injector, the
287
interrelationships between the parameters of the fuel injecting system and its fuel injection
288
quantities must be investigated. These includes total driving pulse duration, first stage turn-on peak
289
current, the injector driver supply voltage, the operating modes added to third pulse operation to
290
cut off the injector and the pressure of the fuel supply system. The executing driver supply voltages,
291
output driving pulses and currents for the H.P. GDI injector are measured and displayed on the
292
digital storage oscilloscope so as to meet the operating requirements of the GDI injector. Fig. 7(a) and
293
Fig. 7(b) The driving pulse signals and GDI injector current waveforms with PWM control added to the last pulse duration (Ip1=200
μ
s)Fig. 7(a) The driving pulse signals and GDI injector current waveforms without PWM control added to the last pulse duration (Ip1=200
μ
s)Fig. 6 (d) Practical three-pulse signal circuit board with
7(b) present the experimental driving pulse signals of three different pulse durations and the GDI
294
injector current waveform without and with last pulse PWM control. The yellow waveform
295
represents the first turn-on pulse signal (Ip1=200μs), the 12A current produced is sufficient to
296
rapidly draw back the nozzle needle of the GDI injector when the fuel injecting pressure is set at 100
297
bar. The second driving pulse as shown in the blue waveform drives the GDI injector to produce the
298
5A holding current and maintain continuous injection. The last driving pulse is indicated as the pink
299
waveform, the driving circuit supplies the 3A current to hold the nozzle needle of the GDI injector.
300
Meanwhile, the injection status of the GDI injector is carrying on but ready to stop squirting. An
301
injecting pulse signal from ECU is fed into the three-stage power MOSFETs PCB to generate the
302
three-stage (12/5/3A) driving current waveforms. The three-stage currents are supplied to drive the
303
actuators in the GDI injector for carrying out the fuel injection experiments. In the experiments, the
304
driver supply voltage is varied between 40V and 70V. The pressure of the fuel supply system is set at
305
a range between 60 bar and 100 bar. A power MOSFETs-switch GDI driver is designed with a wide
306
range of injection pulse durations (1200~2000μs). The fuel injection quantities for four corresponding
307
engine speed settings, 1200rpm, 2400rpm, 6000rpm, and 9000rpm are measured. After completing
308
1000 times of fuel injections, the fuel injection quantities is measured in the electronic balance and
309
total measured fuel mass (g) is divided by 1000 to obtain the average fuel injection quantities (mg)
310
per injection. The results characterize the dynamic performances of the GDI injector fed by the
311
electrical driving circuit and provide the engine AFR control with the precise fuel injection quantities
312
to achieve superior dynamic performances of a GDI injector.
313
4. Results And Discussions
314
The electrical driving circuit is installed and tested in the GDI injecting system as illustrated in
315
Fig 3(a). Experimental configuration is described in Table 2. Experimental validation was taken
316
based on a single-hole Bosch GDI injector. This type of GDI injector requires the three-stage driving
317
circuits charged by a DC supply voltage to acquire three-stage driving currents. In order to evaluate
318
the operating stability of the GDI injector application, the injection pulse duration is normally
319
defined between 1200~2000μs. The components of the electrical driving circuit are designed to be
320
capable of withstanding the peak voltages and currents. A 5V Square-pulse signal inputted to the
321
electrical driving circuit. The supply voltage is
322
adjusted ranging from DC 40V to 70V and supplied
323
the GDI injector actuator to test the effects of the
324
injector supply voltage on the fuel injection
325
quantities. Finally, experiments for two different first
326
pulse turn-on currents (12/10A) have been conducted
327
and compared in the paper. The experimental
328
configuration for the spray test of the GDI injector
329
and injection performance is observed at first pulse
330
turn-on time (Ip1=200μs) and driving signal
331
duration=1500μs.
332
4.1 Effect of Total Pulse Width
333
The power supply voltage and the pressure of the fuel supply system are set at DC 60V and 100
334
bar to measure the fuel injection quantities by adjusting total pulse width. The injecting frequency
335
and driving pulse duration are adjusted at the above sampling speeds to measure the average fuel
336
injection quantities. Effects of various speeds and pulse widths on fuel injection quantities of the
337
H.P. fuel injector fed by the three-stage (12/5/2.5A) driving current are represented in the Fig. 8. The
338
following equations for characterizing the fuel injection curves are given by:
339
mfuel = 1.0984 tp + 11.567 between 1200 and 6000 rpm (R2 =0.9993)
340
mfuel = -0.0639𝑡 + 1.4758 tp + 11.715 for exceeding 6000 rpm (R2 =0.9968) (10)
341
where mfuel= Fuel injection mass (g);tp= pulse duration (μs)
342
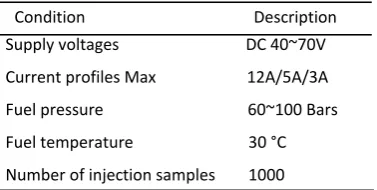
Table 2 Experimental configuration
Condition Description Supply voltages DC 40~70V
Current profiles Max 12A/5A/3A
Fuel pressure 60~100 Bars
Fuel temperature 30 °C
In the experiment, PWM control is withdrawn from the last pulse duration. As the first driving
343
pulse turns on the MOSFET, the actuator coils of the H.P. fuel injector is charged by the DC 60V
344
supply voltage. The first-pulse turn-on peak currents is, therefore, generated and flow into the
345
solenoid valve coils of the injector to induce the electromagnetic force to draw back the nozzle
346
needle of a H.P. fuel injector. The 100 bar fuel pressure thus forces the fuel into the experimental jar
347
via the nozzle hole. Next, the second and third pulses trigger the second- and third- stages MOSFETs
348
to produce the 5A and 2.5 A
349
holding currents respectively.
350
These two exciting currents charge
351
the solenoid valve coils to hold the
352
nozzle needle of the H.P. fuel
353
injector, therefore the fuel of the
354
H.P. fuel injector would keep
355
spurting. The H.P. fuel injector is
356
operated at an injecting frequency
357
ranging from 10 pulses /s to 75
358
pulses /s. The injecting frequency
359
is equal to the engine speeds from
360
1200 to 9000rpm. By adjusting the
361
fuel injection width within a range
362
between 1200μs and 3000μs, the fuel injection quantities is increased from 13.153mg/pulse to
363
22.080mg/pulse, of which the variation is very small at above sampling engine speeds, however the
364
operating frequency of the H.P. fuel injector is closed to 75 pulses /s (corresponding to engine speed
365
at 9000 RPM), inadequate fuel injection quantities would begin to result in significant fuel variations
366
exceeding 1600μs pulse duration.
367
4.2 Effect of Injector’s Supply Voltage and PWM Operation
368
In the practical electrical circuits of motorcycle GDI engines, the injector’s supply voltage drop
369
significantly influences the fuel injection quantities during high speed injecting operation. Effect of
370
the injector’s supply voltage and PWM control on the fuel injection quantities is required to
371
investigate in the fuel injection experiments. An injecting pulse signal from ECU is fed into the
372
three-stage power MOSFETs PCB to generate the three-stage (12/5/3A) current waveforms. The
373
three-stage currents are supplied to drive the actuators in the H.P. fuel injector. In the experiments,
374
the driver supply voltage is varied from 40 to 70 volts and the pressure of the fuel supply system is
375
set at 100 bars. A power MOSFETs-switch H.P. driver is designed with a wide range of injection
376
pulse durations (1200~2000μs). The fuel injection quantities for three engine speed settings at
377
1200rpm, 2400rpm, and 6000rpm are
378
measured. The DC supply voltage is
379
supplied to drive the actuators in the
380
H.P. fuel injector for carrying out the fuel
381
injection experiments. In the research,
382
the effects of the injector supply voltage
383
on the fuel injection quantities of the
384
H.P. fuel injector fed by the three-stage
385
12/5/2.5A (without PWM mode) and
386
12/5/3A driving current (with PWM
387
mode) are investigated. The pressure of
388
the fuel supply system is set at 100 bars.
389
An injecting pulse duration (1500μs) is
390
sent to the three-stage power MOSFETs
391
H.P. driver to measure the fuel injection
392
quantities for three engine speed settings
393
9 10 11 12 13 14 15 16 17 18
30 35 40 45 50 55 60 65 70 75 80
Injector DC supply voltage(V)
F
u
el
in
je
ctio
n
q
u
an
tity
(g
)
1200RPM 2400RPM
6000RPM
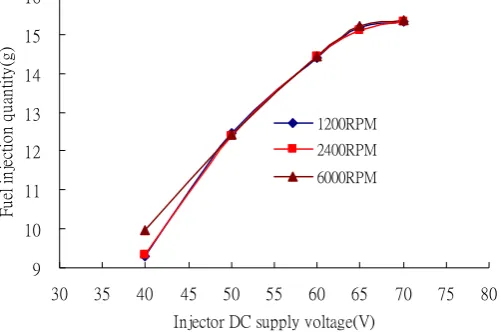
Fig. 9(a) Effect of the injector supply voltages on the fuel injection quantities of the H.P. injector (PWM control withdrawn from the last pulse duration) Fig. 8 Effect of various speeds and pulse widths on the fuel injection quantities of
at 1200rpm, 2400rpm, and 6000rpm. Effect of the injector supply voltages on the fuel injection
394
quantities of the H.P. fuel injector without PWM control added to the 2.5A holding currents during
395
last pulse duration is presented in Fig. 9(a). In Fig. 9(a), the fuel injection quantities fed by the DC
396
40V injector supply voltage are 15.641g, 15.568g and 15.729g at 1200rpm, 2400rpm and 6000rpm
397
respectively. They are almost same and irrespective of engine speeds. When the injector supply
398
voltage is raised to DC 70V, the fuel injection quantities increased to 16.935g from 15.641g. The
399
equations for characterizing the fuel injection curves are given by:
400
mfuel =-0.0003𝑉 + 0.0736 Vs + 13.175 (R2 =0.9992) between 1200 and 6000 rpm
401
mfuel =-0.0013𝑉 + 0.1773 Vs + 10.722 (R2 =0.9994) for exceeding 6000 rpm (11)
402
where mfuel= fuel injection mass (mg/pulse);Vs= power supply voltage (V)
403
Also, PWM control is added to the 2.5A holding currents during the last pulse operation as
404
shown in Fig. 9(b). It is shown from these results that the fuel injection quantities are varied with the
405
injector supply voltage. However, the fuel injection quantities fed by the DC 40V injector supply
406
voltage shows 9.314g, 9.328g and 9.952g
407
at 1200rpm, 2400rpm and 6000rpm
408
respectively (Fig. 9(b)). When the injector
409
supply voltage is raised to DC 70V, the
410
fuel injection quantities increased to
411
15.327 from 9.314g in the case of 1200rpm
412
engine speed. As the fuel injection
413
quantities are decreased to 9.314g as a
414
result of the addition of PWM control to
415
the 2.5A holding currents during the last
416
pulse duration, variations of the fuel
417
injection quantities among engine speeds
418
became less and more stable due to
419
PWM control operation added to the 2.5
420
A holding currents during last pulse
421
durations. The following characteristic
422
equations for the fuel injection curves can thus be obtained:
423
mfuel =-3E-05𝑉 - 0.0003𝑉 + 0.5339 Vs - 9.4735 from 1200rpm to 6000rpm (R2 =0.9991)
424
mfuel =-0.0001𝑉 + 0.0179𝑉 - 0.5583 Vs + 12.136 for exceeding 6000 rpm (R2 =0.9991) (12)
425
where mfuel= Fuel injection mass (mg/pulse);Vs= power supply voltage (V)
426
It is shown from these test results addition of last pulse PWM control to the H.P. fuel injector
427
driving circuits improves the injector’s performance and provides a more stable and accurate fuel
428
injection quantities of the H.P. fuel injector in the fuel supply and injection system at an operating
429
voltage range between DC 60 and 70V. Therefore, it is required to design a voltage booster circuit in
430
order to improve the power supply voltage operating in excess of DC 60V as well as adding PWM
431
control to the 3A holding current during last pulse durations in the further investigations.
432
4.3 Effect of Fuel Pressure and PWM Operation
433
The fuel and the fuel pressure of the H.P. fuel injectors is supplied by a high-pressure fuel pump,
434
which have to be large enough to supply more fuel than the maximum amount that the engine may
435
require to ensure that the fuel pressure remains adequate at full throttle and at maximum RPM. The
436
fuel pressure supplied by the fuel pump of motorcycle GDI engines is usually dipped and the
437
pressure significantly influences the opening time and the fuel injection quantities of the H.P. fuel
438
injector under the engine operating with high speed or heavy load. It is essential to investigate the
439
fuel injection quantities of the H.P. fuel injector at the various fuel supply pressures. The fuel
440
injection quantities between two current operating modes and various fuel pressures at the engine
441
speed 6000rpm is compared in Figs. 10(a) and 10(b). Basically, during the testing of fuel injection
442
quantities of the H.P. fuel injector, the electrical driving circuit is designed to supply a three-stage
443
(12/5/3A) current waveform to the injector coils in order to generate the electromagnetic force to
444
9 10 11 12 13 14 15 16
30 35 40 45 50 55 60 65 70 75 80
Injector DC supply voltage(V)
Fu
el
i
nj
ec
ti
on
qua
nt
it
y(g)
1200RPM 2400RPM
6000RPM
draw back and hold the nozzle needle of the injector. At the various fuel pressures ranging from 60
445
to 100 bars, the fuel injection quantities with and without PWM control added to the last holding
446
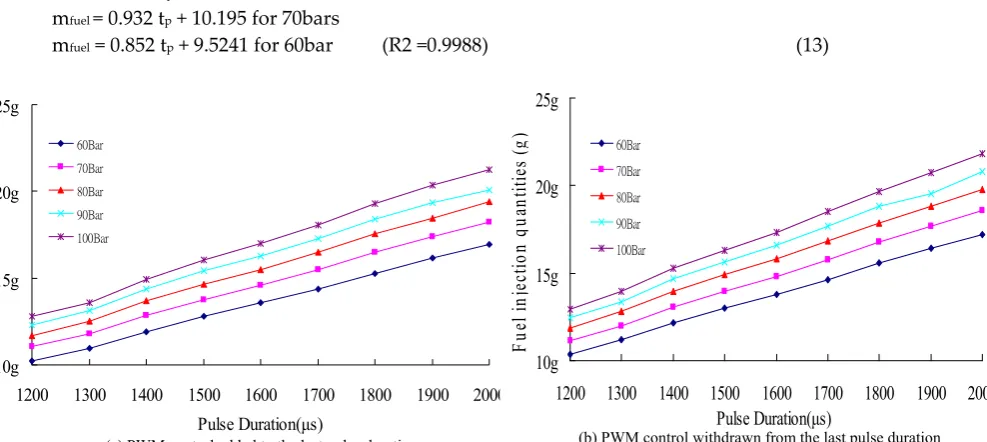
pulse are obtained in Fig. 10(a) and 10(b). From the results in Fig. 10, the PWM control provides the
447
injector with a faster closure and a higher response performance. The equations for characterizing
448
the fuel injection curves without PWM control added to the injector driving circuit can be written as:
449
mfuel = 1.114 tp + 11.826 for 100 bars
450
mfuel = 1.038 tp + 11.429 for 90bars
451
mfuel = 0.994 tp + 10.879 for 80bars
452
mfuel = 0.932 tp + 10.195 for 70bars
453
mfuel = 0.852 tp + 9.5241 for 60bar (R2 =0.9988) (13)
454
The equations characterizing the fuel injection curves for PWM control adding to the injector
455
driving circuit are also obtained as follows:
456
mfuel = 1.0827 tp + 11.621 for 100bar
457
mfuel = 0.9965 tp + 11.297 for 90bar
458
mfuel = 0.9726 tp + 10.681 for 80bar
459
mfuel = 0.9067 tp + 10.089 for 70bar
460
mfuel = 0.8438 tp + 9.3587 for 60bar (R2 =0.9985) (14)
461
where mfuel= Fuel injection mass (g);tp= pulse duration (μ)
462
4.4 Effect of First-Stage Turn-on Pulse Width
463
In order to understand the effects of the
464
first-stage turn-on pulse width on the fuel
465
injection quantities, the total driving pulse
466
duration is adjusted between intervals of
467
1200~2000μs, the injector voltage is supplied
468
by DC 60V and the pressure of the fuel supply
469
system is set at 100 bar as the experimental
470
conditions. The first-stage turn-on driving
471
pulses are set at 180μs and 200μs to generate
472
the 10A and 12A driving currents respectively.
473
The peak charging current amplitude during
474
the first-stage turn-on pulse duration is
475
interrelated to the fuel injection quantities. As
476
for the case of 200μs first driving pulse width
477
in Fig. 7, the driving pulse width is adequate to
478
10g 15g 20g 25g1200 1300 1400 1500 1600 1700 1800 1900 2000
Pulse Duration(μs) 60Bar
70Bar
80Bar
90Bar
100Bar
F
uel
in
je
cti
on
q
uan
tit
ies
(
g)
10g 15g 20g 25g
1200 1300 1400 1500 1600 1700 1800 1900 2000 Pulse Duration(μs)
60Bar
70Bar
80Bar
90Bar
100Bar
Fue
l i
nj
ec
tio
n
qu
an
titie
s
(g
)
(b) PWM control withdrawn from the last pulse duration (a) PWM control added to the last pulse duration
Fig. 10 Comparison of the fuel injection quantities (a) with and (b) without PWM control at various fuel pressures at engine speed 6000rpm
0 5 10 15 20 25
1100 1200 1300 1400 1500 1600 1700 1800 1900 2000 2100 Total pulse width(μs)
F
ue
l i
nj
ec
tion
qu
ant
ity(
g)
10A
12A
boost the first-stage H.P. fuel injector peak current to 12A. The H.P. fuel injector peak current is able
479
to fully draw back the needle of the H.P. fuel injector and thus yielding the stable fuel injection
480
quantities. The effects of the first-stage turn-on 10A and 12A driving currents on the fuel injection
481
quantities of the H.P. fuel injector are investigated and discussed in Table 3. It is noticed in the table
482
that the variations in the fuel injection quantities are changed from negative to positive in
483
comparison between the 10A and 12A first-stage turn-on driving currents at the engine speed
484
9000rpm. At this engine speed, the 10A first-stage turn-on driving current causes a reduction in the
485
injector supply voltage drop and hence, resulted in more fuel quantity squirted. At the pulse
486
intervals ranging from 1200~2000μs, the fuel injection quantities are increased to 20.998g from
487
12.452g and to 21.325g from 12.733g for the cases of the 10A and 12A driving currents respectively.
488
The 12A fuel injection quantities are slightly more than those of the 10A first-stage turn-on driving
489
current as shown in Fig. 11. The fuel injection quantities can be derived by the following equation for
490
characterizing the fuel injection curves:
491
mfuel_12A =1.0868 tp – 11.56 for all engine speeds (R2 =0.9991)
492
mfuel_10A =1.0868 tp – 11.24 for all engine speeds (R2 =0.9989) (15)
493
where mfuel= Fuel injection mass (g);tp= pulse duration (μs)
494
Therefore, the more favorable first-stage turn-on driving currents are ranged between 12 and 10A
495
for the H.P. fuel injector characteristics.
496
5. Conclusions
497
The injector driving circuit has been
498
developed for the high-pressure (H.P.) injector in
499
order to achieve rapid response and good air-fuel
500
ratio control for GDI engines. As it can be seen
501
from the results, an injector drive circuit was
502
developed to improve the fuel injection of H.P.
503
fuel injector reducing the lifetime of solenoid coils
504
of an injector actuator during the fuel injection
505
operation. PWM control was added to the power
506
MOSFET drive circuit to quickly turn off the H.P.
507
fuel injector injection. The injector drive circuit has
508
been successfully implemented in many
509
high-speed and long-lasting fuel injection
510
experiments to verify its feasibility, meeting the
511
operating characteristics of H.P. syringe. In this
512
paper, experimental studies have been conducted
513
to characterize the fuel injection curve of the H.P.
514
fuel injector. Based on the operating requirements
515
of the GDI fuel injector, an adjustable injector
516
driving circuit was developed using a reference
517
current profile. The GDI injector was calibrated by
518
the injector driving circuit to improve the stability
519
of automotive engines during their operation.
520
Experimental investigations were used to
521
characterize the performance of the injector
522
driving circuit. Some main conclusions have been
523
drawn:
524
1. The designed injection system can be applied
525
in other engines; however, it is required to investigate the classifications of the combustion
526
system equipped in the GDI engine before the experiment. The GDI combustion system can be
527
assigned to one of these major classifications: spray-guided, wall-guided and air-guided, on the
528
basis of strategies for realizing stratified charge operation during part load. It is essential to
529
Table 3 Comparisons between 10 and 12A peak driving currents on fuel injection quantities
Pulse Width rpm 10A 12A variation
1200μs
1200 12.452 12.733 -0.281 2400 12.515 12.768 -0.253 6000 12.529 12.739 -0.210 9000 12.596 12.513 0.083
1300μs
1200 13.288 13.566 -0.278 2400 13.411 13.607 -0.196 6000 13.384 13.602 -0.218 9000 13.427 13.343 0.084
1400μs
1200 14.402 14.866 -0.464 2400 14.489 14.883 -0.394 6000 14.549 14.925 -0.376 9000 14.591 14.613 0.122
1500μs
1200 15.716 16.001 -0.285 2400 15.838 16.042 -0.204 6000 15.893 16.098 -0.205 9000 15.914 15.758 0.156
1600μs
1200 16.639 16.931 -0.292 2400 16.753 17.298 -0.545 6000 16.818 17.036 -0.218 9000 16.844 16.691 0.153
1700μs
1200 17.671 18.023 -0.352 2400 17.802 18.237 -0.435 6000 17.888 18.188 -0.300 9000 17.924 17.773 0.151
1800μs
1200 18.939 19.254 -0.315 2400 19.06 19.308 -0.248 6000 19.172 19.426 -0.254 9000 19.198 18.972 0.226
1900μs
1200 19.952 20.246 -0.294 2400 20.102 20.444 -0.342 6000 20.219 20.428 -0.209 9000 20.238 19.956 0.282
2000μs
select a high-pressure injector that is appropriate for the performance of the tested engine
530
combustion system. An experimental investigation on the characterization of the dynamic
531
performance for the selected high-pressure injector is implemented in the paper by the design of
532
injector driving circuit, injector experimental procedures, and the derived fuel injection curves
533
using polynomial curve fitting method.
534
2. The designed GDI injector driving circuit improves the injector’s performance and provides
535
more stable and accurate fuel injection quantities in the H.P. fuel injecting system. The power
536
supply voltage of the H.P. fuel injector has to be operated and held in excess of DC 60V to squirt
537
adequate fuel quantities, otherwise the 500c.c. motorcycle GDI engine would run a transition
538
from homogeneous combustion to lean burn combustion even misfire.
539
3. The H.P. fuel supply system for GDI engines is capable of operating stably and assuring the
540
accurate injection quantities to precisely control the superior performance of GDI engines under
541
the influence of the three-pulse power drive circuit. The developed injector drive circuit is
542
implemented well in both experiments and practical applications. The self-tuning algorithm can
543
optimize the driving parameters in the GDI Engine. It ensures the repeatability and stability of
544
the injection. The experimental injection quantity curves for the injector driving circuit need to
545
be properly configured to ensure the injection quality. Therefore, the fast response and superior
546
performance would be achieved in automotive GDI engines by the well-designed injector drive
547
circuit.
548
Acknowledgements: This research is supported by Ministry of Science and Technology under Project No.
549
MOT-106-2221-E-244-007. The author would like to thank his colleagues, Mr. Peng-Cheng Yu (AERC, Taiwan)
550
who helped me to set up the experimental engine system.
551
Author Contributions: The author proposed to design a new electrical driving circuit for the H.P. GDI injector.
552
The designed electric driving circuit is tested to verify its feasibility and performed. The author carried out the
553
driving circuit allows the H.P. fuel supply system its ability to operate stably and assures accurate fuel injection
554
quantities to precisely control the expected AFR in the 500 c.c. motorcycle GDI engine operation. Design and
555
analysis of the proposed injector drive circuit are presented. Next, effects of total pulse width, injector supply
556
voltage, fuel system pressure and PWM operation on fuel injection quantities of a H.P. fuel injector are
557
measured. Also, the measured data of the H.P. fuel injector fed by the injector driving circuit are defined as the
558
fuel injection curves. Finally experimental results are provided for verification of the proposed injector drive
559
circuit. The author also drafted the manuscript.
560
Conflicts of Interest: The author declares no conflict of interest.
561
References
562
1. Zhao, F., Lai, M.-C., and Harrington, D.L., (1999). Automotive spark-ignited direct-injection gasoline
563
engines, Progress in Energy and Combustion Science, 25, 437–562.
564
2. Guo Hui, Gao Wei, IU Xintian, and Zhang, Z. D., (2010). Study on Measurement System of the Dynamic
565
Performances for an Electronic Fuel Injector, International Conference on Measuring Technology and
566
Mechatronics Automation, 608-611.
567
3. Satkoski, C, Shaver, G, “Piezoelectric fuel injection: pulse-to-pulse coupling and flow rate estimation,”
568
IEEE-ASME T Mech. 2011; 16(4): 627–642.
569
4. Zhang, Xiaohua, Alan Palazzolo, Chol-Bum Kweon, Erwin Thomas, Randall Tucker and Albert Kascak,
570
Direct Fuel Injector Power Drive System Optimization. No.2014-01-1442. SAE Technical Paper, 2014.
571
5. Zhang, J. Q., and Ouyang, G. Y. (2009). Optimization Design of the Electronically Controlled Injector, 2009
572
IEEE International Conference on Mechatronics and Automation, August 9-12, Changchun, China,
573
1996-2001
574
6. Tsai, W.C. and Wu Z.H., (2012) “Use of Taguchi Method to Optimize the Operating Parameters of a
575
High-Pressure Injector Driving Circuit”, Doi10.4028/ www.scientific.net /AMM.130-134 (2012) 2795-2799.
576
7. Tsai, Wen-Chang, and Yu, Peng-Cheng "Design of the electrical drive for the high-pressure GDI injector in a
577
500cc motorbike engine." International Journal of Engineering and Industries 2 (2011):70-83.
578
8. Cheng, Qiang, Zhendong Zhang, and NailiuXie. "Power losses and dynamic response analysis of ultra-high
579
9. Jo, I. S., Chung, M. C., Kim, S. M., Sung, G. S., and J. W. Lee. “Experimental Investigation and Hydraulic
581
Simulation of Dynamic Effects on Diesel Injection Characteristics In Indirect Acting Piezo-Driven Injector
582
With Bypass-Circuit System, International Journal of Automotive Technology, 16, 2, (2015), pp. 173 - 182.
583
10.Bai, Y., Fan, L. Y., Ma, X. Z., Peng, H. L., and Song, E. Z. Effect of Injector Parameters on The Injection
584
Quantity of Common Rail Injection System for Diesel Engines, International Journal of Automotive