Title
1Consumer Understanding, Perception and Interpretation of Serving Size Information on
2Food Labels: A Scoping Review
34
Author List and Affiliations
5Tamara Bucher *
A,B,Kerith Duncanson
A,B, Beatrice Murawski
B,C, Klazine Van der
6Horst
D, David Labbe
D 7A
School of Health Sciences, Faculty of Health and Medicine, The University of Newcastle,
8Callaghan NSW 2308, Australia
9B
Priority Research Centre for Physical Activity and Nutrition, The University of Newcastle,
10Callaghan NSW 2308, Australia
11C
School of Medicine and Public Health, Faculty of Health and Medicine, The University of
12Newcastle, Callaghan NSW 2308, Australia
13D
Nestlé Research Center, Lausanne 1000, Switzerland
1415
*
Corresponding author
: Tamara Bucher
[email protected]
16
Kerith Duncanson
[email protected]
17
Beatrice Murawski
[email protected]
18
Klazine van der Horst
[email protected]
19
David Labbe
[email protected]
20 21 22 23
1
Abstract
24
This scoping review investigated how consumers perceive and interpret serving size
25information on food packages. A search of seven databases (2010 to September 2017) was
26followed by title and abstract screening, with relevant articles assessed for eligibility in
27full-text. Fourteen studies met inclusion criteria, with relevant data extracted by one
28reviewer and checked for consistency by a second reviewer.
29Five studies reported poor understanding of nutrition facts labelling and portion size, with
30information to ‘benchmark’ serving size against reported as helpful in two studies.
31Consumer attitudes towards serving size labelling were measured in six studies and
32identified that serving size information was interpreted as indicative of nutrient intake
33regardless of portion size recommendations. Increased labelled serving sizes resulted in
34increased portion sizes in three studies, with three studies reporting the opposite or
35neutral effect for discretionary food portion sizes.
36The influence of labelled serving size on consumer attitudes and consumption is complex
37and sometimes counterintuitive. As labelled serving size can impact on consumption, any
38changes may result in unintended public health consequences. The effects of labelled
39serving size format changes should be tested carefully within experimental and ecological
40contexts and accompanied by tailored, comprehensive and serving size-specific food
41literacy initiatives.
4243
Keywords
Food labelling; serve size; obesity; back of pack label; BOP; front of pack label;
44FOP; food marketing; nudging
4546
2
Introduction
47
Optimal nutrition enhances wellbeing and reduces physical and mental health risks across
48all life stages, whereas sub-optimal as well as over-nutrition are risk factors for lifestyle
49diseases (e.g., type-2 diabetes, heart disease) that have become endemic worldwide
1.
50To guide populations on healthy food selection and overall dietary intake, most countries
51have implemented food guidance systems that have been developed using evidence-based
52food, health, disease and life stage information
2-4. These guidance systems include
53recommended food choices across food groups, including numbers of serves of a particular
54size (serve sizes) that are gender and age specific.
5556
The food environment in which people select, prepare and consume food has changed
57considerably in the past generation and is expected to continue to change at an equally
58rapid rate. Improvements to agricultural practices, food transportation, food processing
59and food storage have contributed to an increase in food availability and variety
5. A
60decrease in home prepared foods and increased purchasing and consumption of packaged
61foods has led to increased reliance on food package labels for information about the
62composition of foods purchased and consumed
6-8. In this context, the importance of
63serving size and nutrition information labelling is paramount for consumer awareness and
64understanding of their food purchasing and consumption behaviours.
6566
The term serving size pertains to the labelled serving size found on a food label, unlike
67portion size which describes the actual amount of food that has been consumed. However,
68the terms serving size and portion size are often used interchangeably, which may lead
693
consumers to believe they mean the same thing, but there is a distinct difference. This
70misconception has led to confusion of food labelling, designed to guide food selection and
71consumption
9.
7273
In recent decades, portion sizes (the actual consumption of food) and portions offered (the
74size of packages and restaurant meals) have increased globally, leading to a greater caloric
75intake
10. The association between increased portion sizes and weight gain has also been
76acknowledged and documented around the world
11-12. This increase has been observed for
77food consumption both inside the home and outside the home
13, especially with regards to
78foods high in energy
14. Several short-term studies have shown that providing a larger serve
79of snacks
15-16, sugar-sweetened beverages
17and individual meals
15, 18-21leads to increased
80consumption, of both volume and energy. All of the described factors have the potential to
81substantially, negatively affect food consumption and health status at a global level.
8283
Food labels display a plethora of information for consumers, including serving sizes,
84nutrition information, ingredients list and sometimes, health claims. The volume and
85nature of information may be difficult to interpret. Both Australia and the USA, as well as
86other countries across the world, have detailed information on how to interpret and
87understand food labels
22-23. The literature provides mixed information on consumer
88understanding and use of food labels. A systematic review by Cowburn and Stockley
24 89found that most consumers looked at nutrition labels often or sometimes with some
90participants indicating that labels influences their food purchases. A study that used
eye-91tracking technology to investigate consumer attention specific to labelled serving size
924
information concluded that the proportion of people looking at this information at all times
93is trivial (approximately 1% of participants)
25. Moreover, reviews show that consumers
94lack understanding with regard to some nutrition label terms
24. Low health literacy is
95associated with less food label use and poorer
26with lower overall literacy skills are
96associated with less accuracy when estimating serving sizes
27.
9798
In most countries, listing the serving size in the nutrition information panel is mandatory
99but the unit amount is determined by the food manufacturer, so serving size can vary
100between products in the same food category and of the same size. At a conceptual level, the
101‘per serving’ information is useful for consumers to estimate how much of a nutrient they
102are consuming. For example, if an individual with cardiovascular disease is monitoring fat
103consumption, they may use the ‘per serving’ amount to help calculate their daily total fat
104intake from packaged foods
28.
105106
Some countries such as the USA and Canada regulate the labelled serving size. In May 2016,
107the US FDA announced a new nutrition facts label for packaged foods to reflect new
108scientific information, including the link between diet and chronic diseases such as obesity
109and heart disease
29. This new regulation included updates on serving sizes and labelling
110requirements for certain package sizes. As the portion sizes consumed have increased
111within the last decade
10, these regulations have been updated.
112113
For packaged foods that contain between one and two servings, such as a 20-ounce (600ml)
114soda or a 15-ounce (425 gram) can of soup, the calories and other nutrients will now be
1155
required to be labelled as one serving, because people typically consume this amount in
116one sitting. These specified serving sizes somewhat translate to serve sizes in the national
117level food guidance systems, but are not exactly identical, which adds another layer of
118complexity and confusion for consumers.
119120
The current standards for serving sizes and portion size guidance (how much should be
121consumed) stir confusion and there are many barriers to the uptake of serving size
122guidance such and the heterogeneity between the rules and regulations surrounding
123serving sizes as well as interchangeable terminology. A study conducted by Spence et al.
124(2013) found that consumers felt conflicted with inconsistent messages about ‘what’ and
125‘how much’ they should eat
30. Consumers obtained information regarding serving sizes
126from a number of sources including dietitians and food packages, much of which was
127contradictory or inconsistent
30. Consumers describing the burden of deciphering food
128labels and how it leads to meaningless serving size guidance also found that some serving
129size suggestions (e.g., cereal) were too small and queried the generalisability of serving size
130advice
30.
131132
With complex food environments and consumer confusion surrounding serving size labels
13330
, changes need to be made to simplify food labelling and assist consumers in choosing
134healthy portion sizes. Several suggestions on how this could be achieved have been made.
135One suggestion concerns the manipulation of labelled serving sizes to influence food
136choices and consumption
31. This type of manipulation is called ‘health framing’ and
137capitalises on consumers’ perceptions of serving sizes. For example, food items with
1386
smaller serving sizes are more likely to be considered healthier than a larger serving size of
139a comparable food item
32. Other suggestions are to improve consumer education and
140health literacy related to food labels, the standardisation of terminologies used
9and the
141introduction of a standardised food volume measurement unit such as the international
142food unit
33. However, to improve food labelling and help consumers make informed
143decisions about portion size, we need to understand how consumers interpret serving size
144information and how this influences product perception and consumption.
145146
The aim of this scoping review was to explore potential mechanisms of action between
147serving size labelling and consumer behaviour by investigating consumer understanding
148and interpretation of the serving size information on food labels.
1497
Materials and methods
150
The scoping review reported herein followed the five-stage framework proposed by Arksey
151and O'Malley
34. These stages are intended to facilitate the processes of identifying a
152research question, identifying relevant studies, selecting studies, charting the data and
153collating, summarising and reporting the results.
154155
The following research questions were developed and defined under consideration of
156Participants or Population group, Intervention, Control or Comparator condition, Outcomes
157and Study type (PICOS)
35.
158159
1.
How do consumers interpret the meaning (understand the quantity) of the labelled
160serving size information and does this have an impact on food choice? (perception,
161understanding, selection, consumption)
1622.
Does this differ between core and discretionary food groups?
1633.
Do consumers differentiate between the Front of Pack (FOP) labelled serving size
164and portion guidance (usually BOP)?
1654.
Are there any recommendations for effective serving size display to ensure correct
166understanding and usage (e.g., to understand product nutrition information; to select
167healthier product options; or to manage reasonable consumption)?
168169
The above research questions were defined to keep the overall focus on consumers’
170understanding of the labelled serving size with eligible scientific articles published since
1712010.
1728
Seven electronic databases were used to search for relevant studies and these included:
173MEDLINE, The Cochrane Library, EMBASE (Excerpta Medica Database), CINAHL
174(Cumulative Index to Nursing and Allied Health), Scopus, PsycInfo and Business Source
175Ultimate. The search was comprised of truncated key words used individually and in
176combination, these included: “point of sale”, “point of purchase”,
177“nutrition/food/health/front of pack/back of back” and “label/rating/symbol/information
178or logo”, “menu/food” and “label”, “nutrition and guideline/panel/table/profile/summary
179or score”, or “nutrition fact label”, “portion size”, “serve”, “serving” or “serves”. The full
180search strategy is included as supplemental material (S1). Studies were limited to human
181subjects only and where possible, a number of terms describing various diseases were
182excluded. The search was also limited to studies published between 2010 and September
1832017.
184185
Results of the search were exported to EndNote X8 (Clarivate Analytics, Philadelphia, US),
186where duplicates were removed using the inbuilt function in Endnote, which enables
187automatic identification of duplicates. These were then checked manually before duplicates
188were excluded. The remaining titles and abstracts were uploaded to Covidence (Veritas
189Health Innovation, Melbourne, Australia. Available at www.covidence.org), where members
190of the research team were able to undertake the two screening processes. The title and
191abstract screening was shared between three reviewers (KB, AA, XYK) with any studies
192categorised as ‘retrieve’ or ‘unclear’ included for full-text screening. The full-text screening
193was conducted by two reviewers (AA and XYK) with a third reviewer (KB) independently
194assessing any conflicts.
1959 196
To guide study selection, a set of eligibility criteria were established that aligned with the
197research questions listed in Stage 1. A study was eligible, if it provided information on how
198consumers perceive, understand or interpret the labelled serving size (e.g.,
199recommended vs. usual portion), if it provided information on how the labelled serving size
200on food labels influences product perception, choice or consumption or if it provided
201information on whether consumers differentiate between the Front of Pack (FOP) labelled
202serving size and portion guidance (which is sometimes found on Back of Pack labels) and
203relates to dietary recommendations such as serve sizes.
204205
Studies were excluded, if they reported information on calorie labelling of menus, or the
206general impact of FOP labelling on consumers. Studies were also excluded, if serving size as
207such was not addressed on the label (e.g., the study focuses on the impact of new
low-208energy density food and related nutritional information on consumer behaviour), or if the
209study was concerned with the impact of the presence/absence of serving size and other
210FOP elements and not the impact of serving size or amounts on food choice or intake. Any
211reports on the impact of portion-related activities on calorie-related outcomes were
212beyond the scope of this review, as were studies focused on any forms of portion size
213education other than those provided on the label (unless strictly relating to education on
214serving size labelling). Studies could not be included where there was no study parameter
215relating to consumer behaviour (i.e., perception, interpretation, food choice, intake), or if
216the study was merely descriptive in nature (e.g., an overview of different types of labels on
21710
the market). Studies examining packaging waste were also deemed irrelevant for this
218review.
219220
Relevant data, including study design (e.g., study type, sample size and setting), sample
221characteristics (e.g., age, gender and weight), description of labels, study outcomes
222(including attitudes and behaviour) and conclusions was extracted by one reviewer into an
223Excel spreadsheet. A second reviewer checked the data extracted from each study for
224consistency.
225226
Data was further divided into the following sub sections, each of which were summarised in
227table format:
228229
1)
Study selection: authors (year), country, study type and design, sample size,
230description of study arms/conditions, study setting, participant age, gender ratio and
231weight status.
2322)
Description of included studies: authors (year), food type, food label type, main
233findings relating to attitudes, main findings relating to behaviour, implications.
234235
Data was described in a narrative format, by grouping studies by features and findings.
236237 238
11
Results
239
STUDY SELECTION
240241
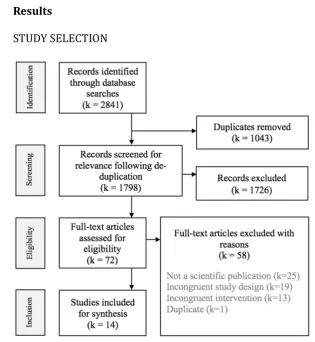
Figure 1
. Flow Diagram of Study Selection for food label serving size information scoping
242review
243244
A total of 2,841 studies were identified as part of the electronic database searches
245(MEDLINE (k = 644), The Cochrane Library (k = 36), EMBASE (k = 720), CINAHL (k = 169),
246Scopus (k = 859), PsycINFO (k = 222), Business Source Ultimate (k = 191). One thousand
247and forty-three duplicates were removed, which left 1,798 titles and abstracts to be
248screened. One thousand seven hundred and twenty-six studies were deemed irrelevant
249based on title and abstract screening, with disagreement resolved by a third reviewer. The
250remaining 72 full-text reports were assessed for inclusion by two reviewers, with conflicts
25112
resolved by discussion and consensus. Fourteen studies were included for the final
252
synthesis (see Figure 1).
253254
The fourteen studies were conducted between 2010 and 2017 in four different countries
255including nine from the United States of America (USA)
36-44, two from The Netherlands
45-46 256and one each from Canada
47, Australia
48and South Africa
49. Sample sizes across these
257studies ranged from n = 51
42to n = 16,048
43with a mean of n = 2,218, including ten
258studies with less than 1,000 participants and four studies of over 1,000 participants. The
259settings in which these studies were conducted included online (k = 4), University course (k
260= 3), community settings (k = 3), laboratory (k = 2), home-completed survey (k = 1),
261University dining hall (k = 1), fast food restaurants (k = 1) and a cinema (k = 1). Table 1
262provides a summary of descriptive data for each of the included studies.
263Table 1. Food label serving size information scoping review summary of included studies
Meta-data Study characteristics Sample characteristics
Authors
(year)
Country
Study type &
design
Sample
size
Description of study
arms/conditions
Study setting Participant Age Gender ratio;
weight status
Christoph and
Ellison (2017)
USA
Experimental
(non-randomised, no
control)
1,069 Food selections
photographed pre-and
post-meal, coded for
selection, servings and
MyPlate categories for
nutrition label users (n =
235) and nonusers (n =
834)
University
dining hall
University
students
M = 19
SD = 1.3
60% males
40% females
24% overweight
or obese (BMI)
Dallas et al.
(2015)
USA
4-arm
experimental
(non-273 Study 1(n = 101):
consumer belief about
serving sizes on BOP labels;
Study 1:
online
Study 2:
Online
representative
panel - adults
M = 27
SD = 6.3
55% male
45% female
Preprints
(www.preprints.org) | NOT PEER-REVIEWED | Posted: 23 January 2018
Table 1. Food label serving size information scoping review summary of included studies
Meta-data Study characteristics Sample characteristics
Authors
(year)
Country
Study type &
design
Sample
size
Description of study
arms/conditions
Study setting Participant Age Gender ratio;
weight status
randomised, no
control) single
time point
Study 2 (n = 51): exposure
to current v. proposed BOP
label; Studies 3 (n = 60)
and 4 (n = 61): influence of
exposure to current v.
proposed label influences
on food portions served
and purchased for others.
basketball
game queue
Studies 3 and
4:
University
marketing
course
Mean BMI =
23.8
Hydock et. al.
(2016)
USA
3-arm
experimental
trial
(non-randomised, no
753 Study 1(n = 208): Intake x
current or proposed
(double) serving sizes of
five; Study 2 (n = 347):
Laboratory University
students
Study 1:
M = 32,
SD = 12
54% males
46% females
BMI not
Preprints
(www.preprints.org) | NOT PEER-REVIEWED | Posted: 23 January 2018
Table 1. Food label serving size information scoping review summary of included studies
Meta-data Study characteristics Sample characteristics
Authors
(year)
Country
Study type &
design
Sample
size
Description of study
arms/conditions
Study setting Participant Age Gender ratio;
weight status
control group) Virtual portioning (for self)
of 6 foods x label viewing.
Study 3 (n = 198)
Nutritional label showing
current or larger serving
size x confectionery
portion.
Study 2:
M = 31,
SD = 10
Study 3:
M = 20,
SD = 1
reported
Jones et al.
(2015)
Canada
2-arm
experimental
survey design
(randomised to
group, no control
2,011 Beverage energy content
estimation x per
serving/per
container/dual-column.
Cracker energy content x
Online Adults 50% of
sample
aged 16
– 18
years
50% males
50% females
22% overweight
or obese (BMI);
Preprints
(www.preprints.org) | NOT PEER-REVIEWED | Posted: 23 January 2018
Table 1. Food label serving size information scoping review summary of included studies
Meta-data Study characteristics Sample characteristics
Authors
(year)
Country
Study type &
design
Sample
size
Description of study
arms/conditions
Study setting Participant Age Gender ratio;
weight status
group) single serving small
font/single serving large
font/number of servings
per bag
Preference for serving size
display format.
Age
range:
16 – 24
years
12% BMI not
stated
Lando et al.
(2012)
USA
10-arm 3 x 3
experimental
trial
(randomised, no
control group)
9,493 Calories and nutrients per
serving and per container x
perception of
(healthfulness and calorie
content per container and
Online Adult M = 46
SD =
15.5
51% male
49% female
Mean BMI =
28.5
SD = 7.1
Preprints
(www.preprints.org) | NOT PEER-REVIEWED | Posted: 23 January 2018
Table 1. Food label serving size information scoping review summary of included studies
Meta-data Study characteristics Sample characteristics
Authors
(year)
Country
Study type &
design
Sample
size
Description of study
arms/conditions
Study setting Participant Age Gender ratio;
weight status
per serving).
Miller et al.
(2016)
USA
Pre-post
experimental
survey design
(non-randomised, no
control group)
358 Pre-and 2 weeks post 8 x
‘inconsistent’ product pair
comparison x healthful
(sodium or saturated fat)
and 2 ‘consistent’ product
pair comparison x healthful
(sodium or saturated fat)
Mailed survey Members of the
Sacramento,
California
community
35% <40
years;
26% 40
– 60
years:
39% >60
years
Age
range:
40% male
60% female
BMI not
reported
Preprints
(www.preprints.org) | NOT PEER-REVIEWED | Posted: 23 January 2018
Table 1. Food label serving size information scoping review summary of included studies
Meta-data Study characteristics Sample characteristics
Authors
(year)
Country
Study type &
design
Sample
size
Description of study
arms/conditions
Study setting Participant Age Gender ratio;
weight status
20 – 78
years
Mohr et al
(2012)
USA
Experimental
(randomised, no
control)
between-subjects design
with measured
moderator
151 Health frame (yes/no) x
discretionary weight
(low/high) x product
category (pizza vs. soup)
with measured moderator
(dietary concern, guilt)
Online Adults M = 46
SD = NR
46% male
54% female
BMI not
reported
Roberto et al.
(2012a)
3-arm RCT 243 Original smart choices label
(servings per package) x
Online Adults M = 26
SD =
37% males
63% females
Preprints
(www.preprints.org) | NOT PEER-REVIEWED | Posted: 23 January 2018
Table 1. Food label serving size information scoping review summary of included studies
Meta-data Study characteristics Sample characteristics
Authors
(year)
Country
Study type &
design
Sample
size
Description of study
arms/conditions
Study setting Participant Age Gender ratio;
weight status
USA Modified smart choices
label (incl. serving size) x
No calorie label
10.0
Mean BMI =
27.3
Spanos S, et al.
(2015)
Australia
4-arm RCT (pilot
study)
100 Portion size: 200g Pizza in
12 pieces or 400g Pizza in
24 pieces (equal grams)
Labelling: Packaging for
200g pizza and one 400g
pizza included NO
information about number
of servings; Packaging for
Laboratory University
students
M = 21
SD = 2.3
100% females
Mean BMI =
21.5
SD = 2.95 range
= 16.1–34.7
Preprints
(www.preprints.org) | NOT PEER-REVIEWED | Posted: 23 January 2018
Table 1. Food label serving size information scoping review summary of included studies
Meta-data Study characteristics Sample characteristics
Authors
(year)
Country
Study type &
design
Sample
size
Description of study
arms/conditions
Study setting Participant Age Gender ratio;
weight status
two other 400g pizza
conditions either included
statement “Contains 2
servings” or “Contains 4
servings”
Tal et al
(2017) USA
1) Observational
2) Experimental
(2 x 2)
51 Study 1: Comparison of
FOP image with actual
reported serving size of 158
common cereals
Study 2: Varied serving
sizes (exaggerated, multiple
serving size x
University
course
University
students
M =22
SD = NR
Age
range:
18 – 55
years
31% male
69% female
BMI not
reported
Preprints
(www.preprints.org) | NOT PEER-REVIEWED | Posted: 23 January 2018
Table 1. Food label serving size information scoping review summary of included studies
Meta-data Study characteristics Sample characteristics
Authors
(year)
Country
Study type &
design
Sample
size
Description of study
arms/conditions
Study setting Participant Age Gender ratio;
weight status
recommended
single-serving size) for 2 cereals.
van der Merwe
(2012)
South Africa
Cross sectional 229 Face to face delivered
survey to measure
consumer ability to: (i)
locate and manipulate
information; (ii) assess
accuracy of nutrient
content claims and which
health/nutrient claims are
allowed; and (iii) identify
Public
locations
(post offices,
health-care
centres or
municipal
offices)
Non-health
professional
adults
34% 18–
24 years
20% 25–
34 years
18% 35–
44 years
13% 45–
54 years
15% 55
36% male
64% female
BMI not
reported
Preprints
(www.preprints.org) | NOT PEER-REVIEWED | Posted: 23 January 2018
Table 1. Food label serving size information scoping review summary of included studies
Meta-data Study characteristics Sample characteristics
Authors
(year)
Country
Study type &
design
Sample
size
Description of study
arms/conditions
Study setting Participant Age Gender ratio;
weight status
symbols on labels. years +
Vermeer et al.
(2010)
The
Netherlands
Experimental,
non-randomised,
no control group
168 2 photographed labelling
formats (control vs.
small/medium/large) x
participants’ intended soft
drink size choice (control
vs. 14, 18, or 24 oz).
3 fast food
restaurants (6
occasions)
Adults M = 26
SD =
10.3
50% male
50% female
19% overweight
or obese (BMI)
Vermeer et al.
(2011)
The
2-arm
experimental
trial
(between-101 Portion size and caloric
guidance for daily amounts
labelling (second evening) x
Cinema Adults M = 50
SD =
12.4
26% male
74% female
Preprints
(www.preprints.org) | NOT PEER-REVIEWED | Posted: 23 January 2018
Table 1. Food label serving size information scoping review summary of included studies
Meta-data Study characteristics Sample characteristics
Authors
(year)
Country
Study type &
design
Sample
size
Description of study
arms/conditions
Study setting Participant Age Gender ratio;
weight status
Netherlands subject design
with a control
group)
No label control (first
evening).
Choice of five portion sizes
(200, 250, 400, 500 and
750 millilitre cups) vs
control (only cup sizes (ml)
displayed).
33% overweight
or obese (BMI)
Zhang (2014)
USA
Repeat cross
sectional surveys
16,048 Consumer understanding
and usage of serving size
information on Nutrition
Community Adults NR NR
Preprints
(www.preprints.org) | NOT PEER-REVIEWED | Posted: 23 January 2018
Table 1. Food label serving size information scoping review summary of included studies
Meta-data Study characteristics Sample characteristics
Authors
(year)
Country
Study type &
design
Sample
size
Description of study
arms/conditions
Study setting Participant Age Gender ratio;
weight status
Facts in 3 large national
repeat measures surveys
that contained similar
questions on serving size
meaning.
Note. BMI = body mass index (kilograms/height in metres2); BOP = Back of Pack; FOP = Front of Pack; NR = not reported
Preprints
(www.preprints.org) | NOT PEER-REVIEWED | Posted: 23 January 2018
25
Participants
264
Studies recruited adult volunteers from the general public (k = 10) or University students
265(k = 4). All but one sample
48were mixed gender with a greater proportion of female
266participants relative to males. The average participant age per sample ranged from 19 years
26736
to 50.4 years (Vermeer 2011). Of the eight studies that reported weight status, four
268reported the percentage of the study sample who were classified as overweight or obese
269based on body mass index (BMI) measures
36, 45-47, with a range of 19 – 33% and average of
27024.5% of sample above the health weight range. Four studies reported mean BMI, which
271ranged from 21.5 to 28.5 with an average of 25.3
37, 39, 44, 48. The remaining six studies did
272not report weight status. None of the studies excluded individuals from participating based
273on this criterion.
274275
Study designs
276Various study designs were employed to answer respective research questions, with
277experimental studies involving between two and 10-arm designs. A non-randomised
278experimental design was used in six studies, of which five had no control group
36-38, 40, 45 279and one had a control group
46. An experimental survey design (random allocation, no
280control group) was used in three studies
39, 41, 47. A randomised controlled trial (RCT) design
281was chosen for two studies, including a 3-arm RCT
44and a 4-arm RCT
48. A cross sectional
282design was used in three studies, with two being single time-point studies
42, 49and one
283repeat cross sectional
43.
284285
26
Test conditions, comparator conditions and measurement of consumer attitudes and
286behaviours
287All fourteen studies involved consumers reporting on serving size information on food
288packaging, in a paper-based
40, interviewer administered
49or online survey
37, 39, 41, 47, using
289food models
37-38, 42or displayed in food outlets
36, 45-46. Of these studies, six studies
290specifically investigated BOP nutrition facts and serving size labelling
37, 39-40, 43, 47-48, five
291investigated FOP and BOP nutrition facts and servings size labelling
38, 41-42, 44, 49, two
292investigated percentage of daily needs based on a national food guidance system, in
293addition to serving size labelling
45-46and one investigated serving size in relation to
294whether consumers used nutrition facts labels routinely
36. Seven included studies
295specifically used discretionary foods in their studies
38-40, 45-48, five studies involved both
296discretionary and core foods
36-37, 41-42, 44and two studies involved use of generic food labels
29743, 49
.
298299
Consumer attitudes (including understanding, beliefs and concerns) about nutrition facts
300and serving sizes on existing labels were investigated in two studies
39, 41. Mohr et al (2012)
301further investigated the influence of health framing on consumer perception
41. Eight
302studies investigated consumer understanding of proposed or modified relative to existing
303NFL and serving size information
37-38, 40, 42-44, 47, 49.
304305
Consumer behaviours in relation to existing nutrition facts labelling and serving size
306information was investigated in two studies
36, 39. Seven studies investigated consumer
307behaviours in relation to proposed or modified relative to existing NFL and serving sizes
37-30827 38, 42, 44-46, 48
. Mohr et al (2012) also investigated the influence of health framing on
309
purchasing intention
41.
310311
Table 2. Food label serving size information scoping review summary of findings and implications
Authors (yr)
Country
Food type Label
type
Main findings -
Attitudes
Main findings -
Behaviour
Implications
Christoph and
Ellison
(2017)
USA
Buffet lunch Nutrition
facts
label,
SS label
Both DF
and CF
no data available Nutrition label users
selected more fruit,
vegetables, beans
(legumes), less
potatoes, refined grains,
fried foods, foods with
added sugar (all p <
0.05)
In buffet setting, labelling
influences food choice (selecting
different foods) rather than food
quantity (selecting more or less
food).
Dallas et al
(2015)
USA
Study 1:
Chicken Veg.
Soup;
Study 2: Choc
chip cookies;
Study 3:
BOP
nutrition
facts
label,
SS label
78% believed SS
related to how much
food can or should be
consumed in one
sitting as part of a
healthy diet.
Modified (larger
amount) label (vs.
current) led consumers
to serve themselves
41% more cookies;
serve 27% more cheese
Increased serving sizes may lead
people who use this information
as a reference to serve more food
to themselves and others.
NB. In Study 1 researchers used
Preprints
(www.preprints.org) | NOT PEER-REVIEWED | Posted: 23 January 2018
Table 2. Food label serving size information scoping review summary of findings and implications
Authors (yr)
Country
Food type Label
type
Main findings -
Attitudes
Main findings -
Behaviour
Implications
Crackers; Study
4: Lasagne
Both DF
and CF
crackers to another
person; buy 43% more
lasagne for others and
divide a lasagne into
22% larger slices.
the term serving size for what is
usually defined as portion size
(usual consumption)
Hydock et al.
(2016)
USA
Study 1: Pizza;
Pasta; Fruit
Loops; Sliced
Cheese; Ham;
Study 2:
Macaroni
cheese; Chili;
Lasagne; Rice
Snacks; Soup;
FOP and
BOP
nutrition
facts
label,
SS label
Mostly
DF
Larger SS rated lower
for health perceptions
(p < 0.05) but more
representative of
portions (p < 0.05 all
foods).
SS impacted on health
perception (p < .001),
estimated calories (p <
0.05) and guilt (p <
0.05). Consumers who
viewed larger serving
sizes (proposed) ate
less confectionery than
those presented with
Larger SS of DF considered less
healthy but more representative
of portion. Larger SS of DF caused
consumers to anticipate greater
consumption-related guilt and
influenced estimation of calories
portioned out.
Larger SS of DF may help
decrease consumption of foods
Preprints
(www.preprints.org) | NOT PEER-REVIEWED | Posted: 23 January 2018
Table 2. Food label serving size information scoping review summary of findings and implications
Authors (yr)
Country
Food type Label
type
Main findings -
Attitudes
Main findings -
Behaviour
Implications
Frozen Fish;
Study 3:
Confectionery
the current serving
sizes
(p < 0.05).
perceived as less healthy if
nutrition information viewed.
Jones et al
(2015)
Canada
Chocolate milk;
crackers
BOP
nutrition
facts
label,
SS label
DF
Study 1: Nutrition
label with per
container or dual
column better for
correctly identifying
energy content than
per serving (p < 0.01).
Study 2: No
association between SS
No data available Per container and dual column
increased understanding of
energy content compared to per
serving. This may help decrease
individual consumption of DF by
influencing perceptions of food
health. Font size and display
order of same information did
not influence correct energy
Preprints
(www.preprints.org) | NOT PEER-REVIEWED | Posted: 23 January 2018
Table 2. Food label serving size information scoping review summary of findings and implications
Authors (yr)
Country
Food type Label
type
Main findings -
Attitudes
Main findings -
Behaviour
Implications
display format and
correct energy
estimation. 62%
preferred SS size
format including
servings per package.
estimation.
Lando et al
(2012)
USA
Frozen meal;
crisps
BOP
nutrition
facts
label,
SS label
DF
Single-serving per
contained and
dual-column formats
performed better and
scored higher on most
outcome measures.
No data available For products that contain 2
servings but usually consumed in
single eating occasion,
single-serving or dual-column labelling
approach recommended.
Preprints
(www.preprints.org) | NOT PEER-REVIEWED | Posted: 23 January 2018
Table 2. Food label serving size information scoping review summary of findings and implications
Authors (yr)
Country
Food type Label
type
Main findings -
Attitudes
Main findings -
Behaviour
Implications
Miller et al
(2016)
USA
Frozen pizza;
snacks
BOP
nutrition
facts
label,
SS label
DF
Overall accuracy was
low (50–55%) across
all age groups.
Numeracy, nutrition
knowledge and
self-reported food label use
supported accuracy,
but did not influence
age differences in
accuracy.
Detailed instructions
improve accuracy, even
for difficult
comparisons in which
No data available Accuracy limited by lack of
consideration for multiple
servings rather than too many
columns to evaluate or numeracy
skills.
Preprints
(www.preprints.org) | NOT PEER-REVIEWED | Posted: 23 January 2018
Table 2. Food label serving size information scoping review summary of findings and implications
Authors (yr)
Country
Food type Label
type
Main findings -
Attitudes
Main findings -
Behaviour
Implications
per serving and per
package information is
inconsistent. Accuracy
is compromised by
poorer numeracy (all
ages) and poor
attention skills and
with less instructions
(older adults).
Preprints
(www.preprints.org) | NOT PEER-REVIEWED | Posted: 23 January 2018
Table 2. Food label serving size information scoping review summary of findings and implications
Authors (yr)
Country
Food type Label
type
Main findings -
Attitudes
Main findings -
Behaviour
Implications
Mohr et al.
(2012)
USA
Frozen pizza;
vegetable soup
FOP and
BOP
nutrition
facts
label,
SS label
CF and
DF
Health framing
manipulation reduced
guilt about
consumption (p <0.05)
for consumers who
were more concerned
about their diet.
People with high
dietary concern are
influenced more by
health framing.
Health frame dietary
concern affects
purchase intention (p <
0.05) and guilt
mediated the influence
of health framing on
purchase intention for
participants with high
concern (p < 0.05).
Prevention-focused health
communication influenced
participants towards selection of
health-framed product whereas
prompting to consider calories
consumed influenced choice
specifically towards listed calorie
count. Health communication
that encouraged participants to
be diligent about their diet, but
wary of health framing resulted
in adjustment for serving sizes
and selection of product with
lowest negative nutrients.
Preprints
(www.preprints.org) | NOT PEER-REVIEWED | Posted: 23 January 2018
Table 2. Food label serving size information scoping review summary of findings and implications
Authors (yr)
Country
Food type Label
type
Main findings -
Attitudes
Main findings -
Behaviour
Implications
Roberto et al
(2012a)
USA
Chocolate milk;
waffles; spread;
dressing; cereal
bars;
microwave
popcorn; meat
and veg soup
FOP and
BOP
nutrition
facts
label,
SS label
CF and
DF
All 3 TL groups more
accurate in
calories-per-serving estimates
compared with the
symbol and no-label
groups
(all p < 0.001)
Symbol (and no label)
perceived as healthier
than any TL items (p <
0.001) but no
differences in intention
to purchase or
perceived taste.
Additional information in relation
to sugar, fat and salt can
negatively influence perception
relative to overall symbol.
Spanos et al
(2015)
Australia
Cheese pizza BOP
SS label
DF
No data available Labelling pizza with a
higher number of
servings decreased food
intake relative to
labelling the pizza with
Providing SS labelling on a food
product can reduce the
portion-size effect on consumer food
intake.
Preprints
(www.preprints.org) | NOT PEER-REVIEWED | Posted: 23 January 2018
Table 2. Food label serving size information scoping review summary of findings and implications
Authors (yr)
Country
Food type Label
type
Main findings -
Attitudes
Main findings -
Behaviour
Implications
a lower number of
servings
(p < 0.05).
Tal et al
(2017) USA
Breakfast
cereals
FOP food
image
(photo)
and BOP
nutrition
facts
label,
SS label
CF and
DF
Portion size depictions
on front of cereal
boxes 64.7% larger
than recommended
portions on NFL.
Boxes that depicted
exaggerated SS resulted
in 17.8% more cereal
portioned compared to
boxes that depicted a
single-size portion of
cereal matching
suggested SS and 42%
more than suggested SS.
Biases in SS depicted on cereal
packaging are prevalent and may
lead to over-serving, which may
consequently lead to overeating.
Preprints
(www.preprints.org) | NOT PEER-REVIEWED | Posted: 23 January 2018
Table 2. Food label serving size information scoping review summary of findings and implications
Authors (yr)
Country
Food type Label
type
Main findings -
Attitudes
Main findings -
Behaviour
Implications
van der
Merwe
(2012)
South Africa
Generic FOP and
BOP
nutrition
facts
label,
SS label
86% reported ability
to locate label
information and 97%
could correctly
identify symbols. 19%
were able to correctly
identify health/
nutrition claims
allowed on labels.
Front panel healthy
product icon
favourably received.
No data available Respondents able to locate and
manipulate label information,
identify symbols and some
nutrient content claims, but
unable to identify some
permissible health/nutrient
claims and false claims.
Vermeer et
al. (2010)
Regular soft
drink
%
needs,
No data available Statistical trend for
reference portion size
Reference portion size labelling
may reduce large portion size
Preprints
(www.preprints.org) | NOT PEER-REVIEWED | Posted: 23 January 2018
Table 2. Food label serving size information scoping review summary of findings and implications
Authors (yr)
Country
Food type Label
type
Main findings -
Attitudes
Main findings -
Behaviour
Implications
The
Netherlands
serving
size
label
labelling increasing
the likelihood to
choose small sizes (OR
2.55).
preferences for specific DF.
Vermeer et
al. (2011)
The
Netherlands
Regular soft
drink
%
needs,
serving
size
label
No data available Labelling neither
stimulated
participants to choose
small portion sizes
(OR = 0.75), nor
dissuade participants
to choose large
portion sizes (OR =
0.51).
Portion size and caloric FGS
labelling had no effect on soft
drink (DF) intake.
Preprints
(www.preprints.org) | NOT PEER-REVIEWED | Posted: 23 January 2018
Table 2. Food label serving size information scoping review summary of findings and implications
Authors (yr)
Country
Food type Label
type
Main findings -
Attitudes
Main findings -
Behaviour
Implications
Zhang (2014)
USA
Generic BOP
SS label
Majority of
respondents
misinterpreted the
meaning of SS
(Surveys 2 and 3).
Women and obese
individuals more likely
to misinterpret SS
meaning. A small
subsample of
participants expressed
distrust of SS
information.
Use of SS information
(often or sometimes)
increased from 54% to
64% from 1994 to 2008
(Survey 1). Women and
obese individuals more
likely to use SS often or
sometimes.
The increasing use, widespread
misunderstanding and distrust of
SS indicates need for change to
both NFL education and
information.
Note. BOP = Back of Pack; CF = core foods; DF = discretionary choices; FGS = food guidance system; FOP = Front of Pack; NFL =
Preprints
(www.preprints.org) | NOT PEER-REVIEWED | Posted: 23 January 2018
Table 2. Food label serving size information scoping review summary of findings and implications
Authors (yr)
Country
Food type Label
type
Main findings -
Attitudes
Main findings -
Behaviour
Implications
nutrition facts label; OR = odds ratio; SS = serving size
Preprints
(www.preprints.org) | NOT PEER-REVIEWED | Posted: 23 January 2018
DESCRIPTION OF STUDY FINDINGS
312
The fourteen studies identified in this scoping review related to a range of research
313
questions and hypotheses, but were consistent enough in study design study and
314
primary outcome measures to consolidate into a set of study findings, as they related to
315
attitudes and behaviours towards labelled serving size. Table 2 summarises the findings
316
by study.
317 318
Consumer health perception (or attitudes towards) of labelled serving size
319Consumer attitudes towards serving size labelling were measured in different ways in
320
the six studies that reported on this influence. Hydock et al. (2016) reported that larger
321
serving size decreased the products health perception (
p
< 0.001) and increased guilt
322
associated with consumption (
p
< 0.05), but was perceived as more representative of
323
portions typically consumed (
p
< 0.05 all foods)
38.
324325
While ‘traffic light’ guidance systems were found by Roberto et al. (2012a) to be more
326
accurate than a symbol, a ‘Choices’ symbol (or no label) were perceived as healthier
327
than any traffic light items (
p
< 0.001) in the same study
44. A front panel healthy
328product icon was also favourably received in a survey-based study by van der Merwe, et
329
al.
49.
330331
Two studies reported negative impacts or influences in relation to consumer perception
332
of serving size labelling. In a study specifically related to health framing of labelling,
333
Mohr et al. (2012) addressed the manipulation of serving size (and nutritional)
334
information and reported that health framing reduced guilt of consumption (
p
< 0.05)
335
for consumers who were more concerned about their diet
41. In the open response
336section of a large national cross-sectional survey reported by Zhang et al. (2014), a small
337
subsample of participants expressed distrust of serving size information
43.
338339
Consumer understanding and interpretation of labelled serving size
340In a cross-sectional survey by van der Merwe, et al.
49, 86% of participants reported
341having the ability to locate label information and 97% could correctly identify symbols.
342
However, only 19% were able to correctly identify health or nutrition claims that are
343
allowed on labels. Miller et al. (2017) identified that improved accuracy in serving size
344
estimations was associated with higher numeracy, nutrition knowledge and
self-345
reported food label use and enhanced by the provision of detailed instructions, even for
346
difficult comparisons in which per serving and per package information was
347
inconsistent
40. Conversely, serving size estimation was compromised by poorer
348numeracy (all ages) and poor attention skills and with less instruction (older adults
349
only)
40.
350351
Three studies investigated consumer interpretation of labelled serving size and
352
identified that consumers interpret serving size as a recommended serving rather than
353
as a typical serving
37, 40, 43.
A discrepancy between understanding of serving size and
354portion size was reported by Dallas et al. (2015), with 78% of participants believing that
355
serving size related to how much food can or should be consumed in one sitting as part
356
of a healthy diet
37. Zhang et al. (2014) reported that the majority of respondents across
357two cross-sectional studies (n = 16,280) misinterpreted the meaning of serving size,
358
particularly women and obese individuals
43. Reported accuracy in serving size
359interpretation was also low (50–55%) across all age groups in an experimental study by
360
Miller et al.
40.
361362
In two studies that compared existing to modified versions of serving size labelling,
363
Jones, et al.
47reported that accuracy in calorie estimation was improved with a
364nutrition label that contained both per serving and either per-container or dual column
365
information and Lando and Lo
39reported improved accuracy with dual column
366information for more complex calorie estimation tasks. While there was no association
367
between different serving size display formats (e.g., font size or order) and correct
368
energy estimation in the study by Jones et al. (2015), the majority (62%) of participants
369
preferred a serving size format that included servings per package
47.
370371
In a study that investigated the influence of four Front of Pack labelling systems on
372
estimation of calories per serving for the individual products, Roberto et al. (2012)
373
found that three variations of a traffic light system all were more accurate for estimates
374
of calories-per-serving compared with the symbol and no-label groups (all
p
< 0.001)
44.
375In a study that investigated food image depiction on the front of packages, Tal et al.
376
(2017) identified that portion size depictions, i.e., the image of the cereal bowl on cereal
377
boxes were 64.7% larger than recommended portions on nutrition facts label
42.
378379
Consumer behaviour in relation to labelled serving size
380The behaviours exhibited by participants in the included studies in relation to labelled
381
serving size were influenced by a range of factors including understanding of food
382
labelling, health framing and intentional modification to labelling. Three studies
383
reported that increased serving sizes resulted in increased portion sizes
37found that
384viewing of modified (larger amount) serving sizes on labels relative to existing serving
385
sizes led consumers to serve themselves 41% more cookies, serve 27% more cheese
386