Diabetes, Metabolic Syndrome and Obesity: Targets and Therapy
Dove
press
O R I G I N A L R E S E A R C H
open access to scientific and medical research
Open Access Full Text Article
Proteomic analysis to identify candidate
biomarkers associated with type 1 diabetes
Valzimeire do Nascimento
de Oliveira,1,2 Abelardo
Barbosa Moreira
Lima-Neto,1 Maurício Fraga
van Tilburg,2 Ana Cristina
de Oliveira
Monteiro-Moreira,3 Marina Duarte
Pinto Lobo,3 Davide
Rondina,4 Virgínia Oliveira
Fernandes,5 Ana Paula Dias
Rangel Montenegro,5 Renan
Magalhães Montenegro
Júnior,5 Maria Izabel
Florindo Guedes1,2
1Collegiate Nutrition Science,
Laboratory of Biotechnology and Molecular Biology, Ceará State University, Fortaleza, Ceará, Brazil; 2Collegiate Biotechnology,
Northeast Network of Biotechnology, Laboratory of Biotechnology and Molecular Biology, Ceará State University, Fortaleza, Ceará, Brazil;
3Center of Experimental Biology,
University of Fortaleza, Fortaleza, Ceará, Brazil; 4School of Veterinary
Science, Ceará State of University, Fortaleza, Ceará, Brazil; 5Faculty of
Medicine, Federal University of Ceará and University Hospitals, Fortaleza, Ceará, Brazil
Purpose: Type 1 diabetes mellitus (DM1) is one of the most common chronic diseases observed during childhood. The incidence of DM1 is increasing worldwide, and there is currently no way to prevent or delay the onset or to cure the disease. Most diseases, including diabetes, stem from abnormalities in the functioning of proteins, and some studies have reported the expression of protein variation to be involved in the development of DM1. Thus, the aim of this study was to investigate the differential expression of serum proteins in patients with DM1.
Materials and methods: Serum of patients with DM1 (n=30) and healthy controls (n=30) was collected. A proteomic approach was used with depletion of albumin and immunoglobulin G chromatography on serum samples followed by data-independent, label-free mass spectro-metric analysis.
Results: A total of eight serum proteins were identified as being differentially expressed and involved in the immune system, lipid metabolism, and pathways of coagulation. DM1 was associated with the upregulation of six proteins: alpha-2-macroglobulin, apolipoprotein A-II,
β2 glycoprotein I, Ig alpha-2 chain C region, alpha-1-microglobulin, and prothrombin. A total of two proteins were downregulated, including pregnancy zone protein and complement C4.
Conclusion: To the best of our knowledge, these findings show differential expression of proteins revealing new proteins that may be involved in the development and progression of diabetes.
Keywords: proteome, mass spectrometry, precision medicine, diagnosis
Introduction
Type 1 diabetes mellitus (DM1) is characterized by the destruction of insulin-producing β-cells in the pancreas, with consequent insulin deficiency.1 It is a metabolic and endocrine condition more common in childhood development and is preceded by the dysregulation of many biological pathways.2 At present, no therapy exists to halt the immune-mediated destruction of β-cells,3 and DM1 has a substantial long-term impact on the quality of life, particularly in children and adolescents.
According to the International Diabetes Federation,4 the total population with DM was equivalent to 415 million and is estimated to increase to 471 million by 2035. A recent report of World Health Organization estimated that, globally, 422 million adults aged >18 years were living with diabetes in 2014, compared with 108 million in 1980.5 Following the same trend, the incidence of DM1 has increased by ~3% worldwide and represents 5%–10% of the entire population with diabetes.6
There has been a lot of research conducted on diabetes over the decades. Several proteomic approaches have been undertaken to identify biomarkers for monitoring the Correspondence: Valzimeire do
Nascimento de Oliveira
Av. Dr. Silas Munguba, 1700, Campus do Itaperi, bloco D, 10 andar, Sala 01,
Laboratório de Biologia Molecular e Biotecnologia, Fortaleza, Ceará, Brazil Tel +55 85 99991 3404
Email valzimeire.oliveira@uece.br
Journal name: Diabetes, Metabolic Syndrome and Obesity: Targets and Therapy Article Designation: ORIGINAL RESEARCH
Year: 2018 Volume: 11
Running head verso: do Nascimento de Oliveira et al Running head recto: Candidate biomarkers for type 1 diabetes DOI: http://dx.doi.org/10.2147/DMSO.S162008
Diabetes, Metabolic Syndrome and Obesity: Targets and Therapy downloaded from https://www.dovepress.com/ by 118.70.13.36 on 21-Aug-2020
For personal use only.
Dovepress
do Nascimento de Oliveira et al
prediction7,8 and progression9 of the disease. However, there are some limitations due to low specificity or late application to the disease stage.10
DM1 is a complex disease with altered expression of many genes and their products.11 Therefore, different approaches were developed using current proteomic tech-nologies to explore its clinical potential and enable the discovery of new biomarkers for DM1.
Recent advances in proteomics have triggered rapid prog-ress in mass spectrometry (MS)-based proteomics. It enables more than simple protein identification and can accurately and reliably quantitate differences in protein abundance in an organism, a cell, or a tissue at a given time or under a particular condition.12 The label-free technique has been shown to be more accurate in estimating absolute abundance of proteins in complex samples.13
In the current study, we performed a quantitative and quali-tative analysis using a sample pretreatment immunodepletion of serum albumin and immunogloblin G (IgG) combined with data-independent label-free mass spectrometry (MSE) analysis with the aim of identifying differentially expressed levels of serum proteins in DM1 patients and healthy controls (HCs).
Materials and methods
Study participants
The present study enrolled DM1 patients selected among those in a regular follow-up in the outpatient of Endocrinol-ogy and Diabetes at the Federal University Hospital of Ceara, Fortaleza, Brazil. DM1 patients aged ≥18 years, both male and female, who had attended the outpatient department of Endocrinology and Diabetes for a minimum of 6 months, with clinical and cognitive conditions to answer an interview and the capacity to stand up normally were eligible for the DM1 group. Patients using immunosuppressive medications (renal, heart, or hepatic dysfunction; type 2 diabetes; etc.); those with alcoholism and mental disorders (including dementia and Alzheimer’s disease); those diagnosed with leprosy or HIV infection; and those with autoimmune disease, amputa-tion or ulcers on the lower limbs, acute infectious frames, or diabetic ketoacidosis in the 3 months preceding the evalua-tion, as well as pregnant or lactating females, were excluded. HCs were selected from the Federal University and Ceará State University, considering the same criteria used for DM1 patients, besides not having a familiar history of diabetes and with fasting blood glucose ≤99 mg/dL.
The study initially enrolled all patients attending the out-patient department as potential participants. After applying
rigorous inclusion and exclusion criteria to achieve a group with highly homogeneous clinical features and accounting for loss during the selection process, a total of 60 subjects were included as study participants: 30 DM1 patients and 30 HCs. The DM1 and HC groups were matched by gender, age, body mass index (BMI), total cholesterol, high-density lipoprotein cholesterol (HDL-C), serum low-density lipopro-tein cholesterol (LDL-C), total prolipopro-tein, urea, and creatinine. General health features, demographics, and clinical data were obtained through medical records and direct interviews. The study protocol (number 1357544) was approved by the Federal University Hospital of Ceará Ethics Committee, and the study was conducted according to the principles of the Declaration of Helsinki. Written informed consent was obtained from all the participants.
Anthropometry and health-related
behaviors
Weight and height were measured according to the SISVAN (Food and Nutritional Surveillance System; 2004).14 BMI was calculated as weight (in kg) divided by height (in m2).15 The considered standard doses for alcohol consumption and categories were in accordance with World Health Organiza-tion.16 Cigarette smoking status was consistent with that shown in Vital and Health Statistics.17
Serum samples
Blood samples were collected from all subjects after an overnight fast (12 hours) for biochemical analysis. All the samples were centrifuged at 3000 rpm for 15 minutes at room temperature, and the serum obtained was kept frozen at −80°C until analyzed. Fasting blood sugar, total cholesterol, HDL-C, triglyceride, urea, and creatinine were measured by colorimetric enzymatic method using commercially available kits (Bioclin, Quibasa Quimica Basica Ltda, Belo Horizonte, Minas Gerais, Brazil) and an automated biochemical analyzer (Mindray BC-2800; Shenzhen Mindray Bio-Medical Electronics Co. Ltd., Shenzhen, China). LDL-C was calculated using the Frederick-son–Friedewald equation.18 C-peptide analysis was performed by immunoassays of microparticles by quimioluminescence (Kit ARCHITECT C-Peptide) using Architec Asystema no. i2000 (Chicago, IL, USA). Samples were analyzed in triplicate.
The serum protein concentration was determined by the Bradford method.19 The serum samples were pooled in the same group for proteomic analysis. Using 5.33 μg of protein from each individual sample, 15 samples were pooled to form each group of patients with diabetes and the HC groups. Therefore,
Diabetes, Metabolic Syndrome and Obesity: Targets and Therapy downloaded from https://www.dovepress.com/ by 118.70.13.36 on 21-Aug-2020
Dovepress Candidate biomarkers for type 1 diabetes
two pools of samples from patients with DM1 (DM1a and DM1b) and two pools of HCs (HCa and HCb) were generated.
Immunodepletion of high-abundance
proteins
In order toimprove the chance of detecting a wide range of serum proteins of medium to low abundance, proteins of high abundance, albumins, and immunoglobulins were depleted from the serum. Aliquots of serum were filtered through 0.22-μM membrane (KASVI, São José do Pinhais, Brazil). Then, 150 μL of filtered serum was applied to a HiTrap® Albumin & IgG Depletion column (GE Healthcare Bio-Sciences Corp., Piscataway, NJ, USA) attached to an AKTA Purifier 10 fast protein liquid chromatography system (GE Healthcare). The column was preequilibrated with a solution of 20 mM Tris–HCl (pH 7.4) and 0.15 M NaCl. The elution of fraction rich in albumin and immunoglobulin was realized with 0.1 M Glycine–HCL buffer (pH 2.7) delivered at 1 mL/ min, and absorbance was monitored at 216 and 280 nm.
Nano-ultra performance liquid
chromatografy MS analysis
After immunodepletion, the fractions of the pools were dia-lyzed, concentrated, and quantified using a Vivaspin™ (GE Healthcare) and a NanoVue™ Spectrometer (GE Healthcare), respectively, at an absorbance at 280 nm. The denatured sam-ples (100 μg) were diluted in 50 mM ammonium bicarbonate, denatured with a solution of 0.2% RapiGest™ SF (Waters Corporation, Milford, MA, USA) at 80°C for 15 minutes in a dry bath, and reduced with 100 mM dithiothreitol at 60°C for 60 minutes, and alkylation with 300 mM iodoacetamide for 30 minutes was performed in the dark at room temperature. The digestion occurred with the addition of 1 μg of modified trypsin (Promega, Madison, WI, USA) to each sample at 37°C, and the samples were incubated overnight. The reaction was stopped by adding 10 μL of 5% of trifluoroacetic acid, the samples were incubated for 90 minutes at 37°C, centrifuged, and the supernatant was transferred to vial (Waters, Manches-ter, UK). Tryptic peptides of yeast alcohol dehydrogenase (ADH) were added to vials containing digested proteins to a final concentration of 50 fmol/μL as internal standards. The final protein concentration was ~1 μg/μL.
The tryptic peptides were separated using a nanoAC-QUITY UPLC® system (Waters) equipped with an HSS T3 C18 reverse-phase column (1.8 μm, 75 μm×20 mm; Waters) for 110 minutes using 0%–40% gradient for 90 minutes and 40%–85% for 5 minutes. The column was reequilibrated for 15 minutes at 35°C. The flow rate was 0.35 μL/min, and
mobile Phases A and B contained 0.1% formic acid in water and 0.1% formic acid in acetonitrile, respectively. All the samples were measured in triplicate. MSE was performed using a Synapt HDMS (nano-electrospray ionization quadru-pole /orthogonal acceleration time-of-flight mass spectrome-ter; Waters, Manchester, UK). The equipment was operated in “V” mode with a precursor double-charge resolution ≥10,000 full width at half maximum and in electrospray positive-ion mode nano-electrospray ionization (+). Mass spectrometer data were acquired using a NanoLockSpray probe channel infusion of Glu-fibrinogen peptide (Glu-Fib) derived from fibrinopeptide B human (M + 2H)2 and final calibration of the equipment used MS/MS Glu-Fib fragments.
Data processing and protein identification
and quantification
Liquid chromatography (LC)/MSE data were processed, and the proteins were identified using the ProteinLynx Global Server (PLGS) version 2 software with the UniProt reverse Homo sapiens annotated database. For searching spectra and the database, the default parameters of PLGS were used, followed by a maximum of one missed trypsin cleavage. The absolute quantification of each run was calculated according to the three most intense peptides (label-free Hi3 method) using ADH peptides as internal standards.13 Relative quantifi-cation of identified proteins from each expression group was performed using alpha-1-antitrypsin (UniProt) as an internal common housekeeping protein to normalize expression lev-els, using PLGS ExpressionE software (Waters).20 The average quantitative values of all the samples were calculated, and the
p-values (<0.05) were calculated using ExpressionE software to refer to the differences between biological replicates.
Gene ontology analysis
The identified proteins were classified into different catego-ries, as biological processes, cellular location, and molecular function in accordance with the information found in the Gene Ontology database, UniProtKB, and EBI GOA.
Statistical analysis
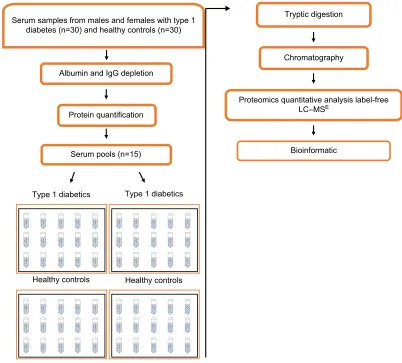
The data obtained concerning demographics and biochemical and anthropometric parameters were analyzed using R soft-ware Version 3.2.2 (2017). For the comparison of two means, Student’s t-test was used for independent samples; otherwise, Mann–Whitney U test was used. Correlations between vari-ables were tested using Pearson and Spearman correlation tests. Data were considered significant with p-values <0.05. Figure 1 presents the experimental strategy used in this study.
Diabetes, Metabolic Syndrome and Obesity: Targets and Therapy downloaded from https://www.dovepress.com/ by 118.70.13.36 on 21-Aug-2020
Dovepress
do Nascimento de Oliveira et al
Results
Clinical features
A total of 60 individuals with an average age of 33.30±9.80 years (ranging from 18 to 59 years) were studied and grouped into 30 DM1 patients and 30 HC individuals. Table 1 shows the biochemical and anthropometric characteristics of the patients enrolled for the study. DM1 and HC groups were matched, and there were no significant differences between the groups regarding age, gender, and BMI or in the serum concentrations of total cholesterol, HDL-C, LDL-C, total proteins, and creatinine. As expected, fasting blood glucose and C-peptide were significantly different between DM1 patients and HCs (p<0.001). The DM1 group also exhibited a negative correlation between C-peptide and duration of disease (r=−532; p<0.001). Moreover, no significant differ-ences were observed between the groups relative to alcohol consumption and cigarette smoking status.
Expression of proteins
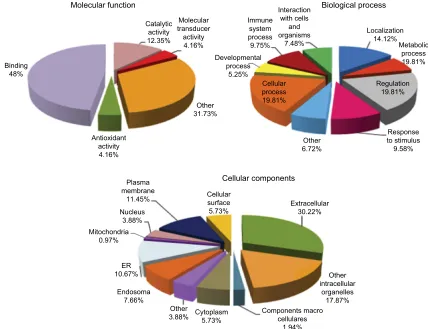
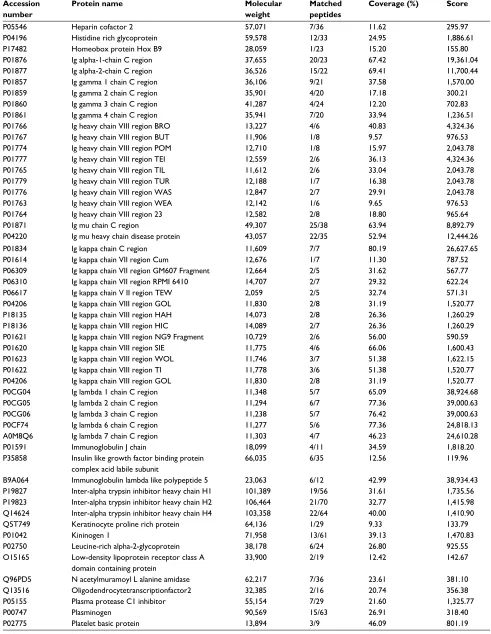
A comparative proteomic analysis was performed between DM1 and HC groups to investigate alterations in serum proteins in DM1 patients. In the current study, a total of 130 proteins were identified in the serum of the DM1 and HC groups in the total data set (Table S1). Eight proteins were differentially expressed in the serum of the DM1 group com-pared with the HC group (six proteins were upregulated and two were downregulated). Of the list of proteins identified, the criteria stated for the differential expression in each of the two biological replicates only considered proteins with differential expression (DM1/HC) with absolute ratios >1.5 (upregulated) and <0.66 (downregulated) and the levels of those proteins with ratios between 1.5 and 0.66 (unchanged). Based on gene ontology analysis, most of the proteins that were identified as related to molecular function were involved in binding (48%), catalytic (12.35%) and antioxidant (4.16%)
Figure 1 Diagram of the study design used for research of proteomic biomarker in the serum of individuals.
Abbreviations: LC–MSE, liquid chromatography––data-independent label-free mass spectrometry; IgG, immunoglobulin G.
Serum samples from males and females with type 1 diabetes (n=30) and healthy controls (n=30)
Albumin and IgG depletion
Protein quantification
Serum pools (n=15)
Tryptic digestion
Chromatography
Bioinformatic
Proteomics quantitative analysis label-free LC–MSE
Type 1 diabetics
Healthy controls Healthy controls Type 1 diabetics
Diabetes, Metabolic Syndrome and Obesity: Targets and Therapy downloaded from https://www.dovepress.com/ by 118.70.13.36 on 21-Aug-2020
Dovepress Candidate biomarkers for type 1 diabetes
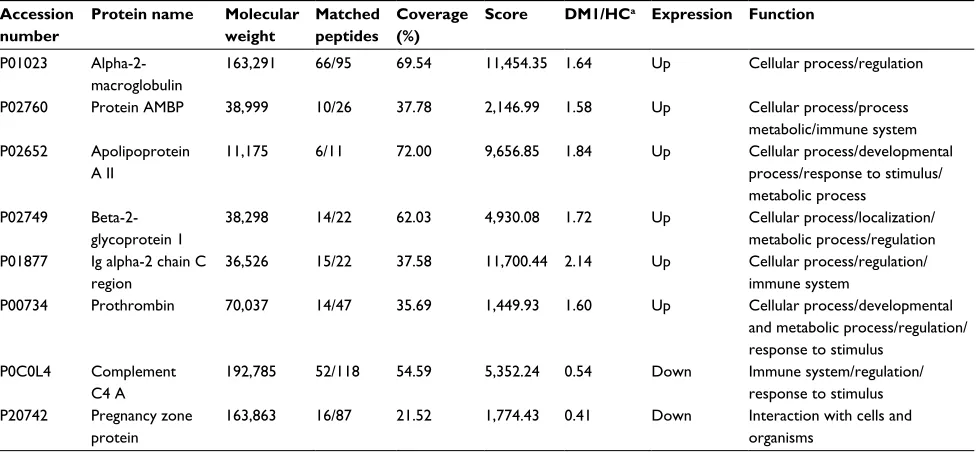
activities, and other functions. They also participated in biological processes related to regulation (19.81%), cellular process (19.81%), localization (14.12%), stimulus response (9.58%), and immune system (9.75%), among others. In addition, the majority of proteins were located in the extracel-lular region (Figure 2). Table 2 shows the proteins identified as differentially expressed in the serum from DM1 group compared with HC group.
Discussion
Diabetes occurs as a result of a range of minor changes in protein expression that alters the stability of the health β-cell to a prediabetic phenotype of instability and possibly β-cell destruction.21 Thus, the proteomic analysis of protein expres-sion is an important tool for understanding the molecular modifications associated with disease progression and may contribute to the therapeutic monitoring of this autoimmune disease.
In the present study, a proteomic approach using a label-free quantitative MS analysis identified eight differentially expressed proteins in the serum of DM1 patients compared with HCs. All the proteins that were either upregulated (alpha-2-macroglobulin [α2M], apolipoprotein A-II [ApoA-II], β2 glycoprotein I, Ig alpha-2 chain C region [IGHA2],
alpha-1-microglobulin [AMBP], and prothrombin [THRB]) or downregulated (pregnancy zone protein [PZP] and comple-ment C4 [C4]) are discussed below.
α2M belongs to the α-M family of proteins and is the largest major antiproteinase present in the plasma of verte-brates.22 In the present study, α2M expression levels were upregulated in the DM1 group compared with HCs. In sup-port of our data, Takada et al also showed that serum levels of α2M were clearly upregulated in many individuals with DM1 and type 2 diabetes mellitus (DM2).23 Interestingly, upregula-tion of α2M has been suggested as a potential biomarker for diabetic retinopathy and nephropathy,23–25 and studies have indicated that α2M can also act as a binding and carrier pro-tein for cytokines, including IL-Iβ and IL-6, among others,26 leading to the induction of several defense reactions, such as immune response, acute phase reaction, and hematopoiesis.22 Therefore, acting as a carrier and binding protein could be the mechanism by which α2M performs its immune func-tions, acting in inflammatory processes, and could explain its enhanced expression in the serum of people with DM1.
Proteomic analysis has shown upregulated expression lev-els of IGHA2 in DM1 patients. IGHA2 is an immunoglobulin that is a membrane-bound or secreted glycoprotein produced by B lymphocytes.27 This immunoglobulin has an important Table 1 Demographic, anthropometric, and clinical characteristics of participants in study
Parameters Patients with DM1 HC p-value
Subjects (n) 30 30 –
Age (years) 35.03 (8.60) 31.50 (10.67) 0.163a
BMI (kg/m2) 24.76 (3.10) 24.74 (4.03) 0.982a
DM1 duration (years) 15.63 (10.47) – –
HbA1c (%) 7.5 (1.2) – –
Blood glucose (mg/dL) 145.44 (56.96) 89.93 (6.02) <0.001b
Peptide C (ng/mL) 0.14 (0.17) 3.92 (0.56) <0.001b
Total cholesterol (mg/dL) 179.68 (39.12) 192.56 (36.59) 0.193a
LDL (mg/dL) 87.88 (36.34) 88.90 (31.73) 0.907a
HDL (mg/dL) 73.70 (25.65) 76.83 (22.86) 0.619a
TG (mg/dL) 141.80 (34.80) 95.11 (26.01) <0.001b
Total proteins (mg/dL) 7.24 (1.01) 7.24 (1.26) 0.564b
Creatinine (mg/dL) 0.91 (0.21) 0.92 (0.23) 0.863a
Urea (mg/dL) 33.03 (11.47) 25.97 (7.72) 0.007a
Gender
Male n (%) 12 (63.16) 7 (36.84) 0.165a
Female n (%) 18 (43.90) 23 (56.10)
Smoking n (%)
Yes 2 (66.67) 1 (33.33) 1. 000b
No 28 (49.12) 29 (50.88)
Drinking n (%)
Yes 0 (0.00) 1 (100.00) 1. 000b
No 30 (50.85) 29 (49.15)
Notes: Values are expressed as mean (SD) and number (percentage). aStudent’s t-test; bMann–Whitney test; p-values <0.05 are considered significant.
Abbreviations: BMI, body mass index; DM1, type 1 diabetes mellitus; HbA1c, glycated hemoglobin; HC, healthy controls; HDL, high-density lipoprotein; LDL, low-density lipoprotein; TG, triglycerides.
Diabetes, Metabolic Syndrome and Obesity: Targets and Therapy downloaded from https://www.dovepress.com/ by 118.70.13.36 on 21-Aug-2020
Dovepress
do Nascimento de Oliveira et al
role in immune defense, especially at the mucosal surfaces.28 In our study, the high levels of IGHA2 identified are in keeping with previous reports that have shown increased concentrations of circulating IgHA2 in DM1 and DM2 patients.29–31 In DM1 patients, the increased expression in the serum of IGHA2 could be triggered in response to antigenic stimuli, forming continuous stimulation of antibody produc-tion.29 Moreover, the literature shows that the relationship between diabetes and IGHA2 has been described as involv-ing advanced glycation products. Some studies reported a significant increase in the glycation of IGHA2 in the plasma of patients with DM1 and with complications of diabetes, especially in retinopathy, nephropathy, and neuropathy.32,33 In addition, a cross-sectional study reported that increased levels of IgA tended to be associated with hyperglycemia.34 In this context, it was suggested that high levels of IGHA2 result from an immune response to advanced glycosylation end products that increase and accumulate with persistent high blood glucose in patients with diabetes.31
ApoA-II expression levels were upregulated in the DM1 group compared with the HC group. APOA-II is the second
most abundant apolipoprotein constituent of HDL, and the increased expression of APOA-II has been associated with several aspects of HDL, triglycerides, obesity, and insulin resistance.35,36 DM1 patients often show lipid disorders, such as abnormalities in the regulation of plasma lipid metabo-lism,37 in different amounts of classes of lipoproteins, and in the transfer of lipids.38 Lipoprotein abnormalities might contribute to the development of atherogenesis and diabetic nephropathy.39,40 In fact, Soedamah-Muthu et al reported that a lower APOA-I to APO-II ratio in patients with microalbu-minuria or macroalbumicroalbu-minuria could contribute to an increased risk of cardiovascular disease.41 Increased expression of APOA-II in transgenic mice showed enhanced HDL levels and increased size of HDL particles. Larger HDL observed is caused, in part, by the inhibition of the ability of hepatic lipase (HL) to hydrolyze phospholipids and triglycerides by APOA-II as well as an increased ratio of APOA-I to APOA-II. Therefore, interactions of APOA-II and APOA-I and HL influence the HDL structure and antiatherogenic properties.42,43 Furthermore, an excess of APOA-II in HDL may contribute to hypertriglyceridemia by inhibiting the
Figure 2 Percentage of serum proteins identified from albumin and immunoglobulin G depleted serum by LC–MSE for patients with type 1 diabetes and healthy controls
based on their molecular function, biological process, and cellular components.
Abbreviations: ER, endoplasmic reticulum; LC–MSE, liquid chromatography––data-independent label-free mass spectrometry.
Molecular function Biological process
Cellular components
Interaction with cells
and organisms
7.48% Immune
system process 9.75% Developmental
process 5.25%
Cellular process 19.81%
Other 6.72%
Response to stimulus 9.58% Regulation
19.81% Metabolic
process 19.81% Localization
14.12%
Binding 48%
Antioxidant activity 4.16%
Plasma membrane
11.45% Nucleus
3.88% Mitochondria
0.97%
ER 10.67%
Endosoma 7.66%
Other
3.88% Cytoplasm5.73% Components macrocellulares 1.94%
Other intracellular
organelles 17.87% Extracellular
30.22% Cellular
surface 5.73% Other 31.73% Molecular transducer activity 4.16% Catalytic
activity 12.35%
Diabetes, Metabolic Syndrome and Obesity: Targets and Therapy downloaded from https://www.dovepress.com/ by 118.70.13.36 on 21-Aug-2020
Dovepress Candidate biomarkers for type 1 diabetes
lipolysis of triglyceride-rich lipoproteins and by modifying the lipoprotein lipase activity.44 In diabetes, deficient function of insulin-dependent lipoprotein lipase may lead to hyper-triglyceridemia as well as decreased HDL cholesterol levels due to increased lipid exchanges between triglyceride-rich lipoproteins and HDL.37 Nevertheless, studies using various approaches have described APOA-II as both proatherogenic and antiatherogenic; however, the role of this protein in lipid metabolism and atherogenesis is not well understood. Nevertheless, evidence supports the hypothesis that APOA-II is antiatherogenic, and further studies are required.45 Taken together, these data indicate that APOA-II plays an impor-tant role in regulating lipid and β-cell metabolism. Thus, in the current study, our observation supports previous reports that show an association between apolipoproteins and DM1.
β2 glycoprotein I, also known as apolipoprotein H (APOH), is involved in the inhibition of the intrinsic pathway of the activation of blood coagulation. There is evidence to support the association between APOH and lipid metabo-lism, inflammation, thrombosis, autoimmune disease, and atherosclerosis.46,47 Here, expression levels of APOH were upregulated in DM1 patients. The analysis of plasma levels of APOH from people with DM2 showed that patients with hypertriglyceridemia had significantly higher APOH values.46 Others studies have shown an association between APOH and diabetic retinopathy and found increased levels of APOH in
the vitreous fluid of DM1 patients with proliferative diabetic retinopathy.48,49 However, to our knowledge, no study has yet shown increased levels of APOH in the serum of DM1 patients. Interestingly, APOH binds apoptotic cells in vivo, and this might trigger or enhance complement activation, thus facilitating the recognition and clearance of apoptotic cells.50 The role of APOH in the pathogenesis of diabetic retinopathy remains to be elucidated, but it could be related to complement activation or its potential role in the recogni-tion of dying cells.49 Although the relationship between cell apoptosis and autoimmunity remains to be fully established, there is evidence that T-cell-induced apoptosis is a mechanism in DM1.51 Here, we show for the first time the upregulation of APOH in the serum of patients with DM1.
C4 was downregulated in the serum from patients with DM1. The complement system plays an important role in innate and acquired immunity, and evidence suggests that relevant target regulation of the complement system might be efficient in controlling autoimmune diseases.52 Abnormalities in complement proteins in DM1 patients have been reported, and reduced levels of C4 were attributed to hypercatabolism or reduction in protein synthesis.53 Moreover, decreased levels of C4 in children and adolescents with DM1 were related to impaired metabolic control.54 High glucose interferes with the innate function of the complement system and impairs the ability of the host to combat infection.55 Deficiencies in C4 Table 2 Characterization of differentially expressed proteins in serum of DM1 patients compared with HCs as identified by LC–MSE Accession
number
Protein name Molecular weight
Matched peptides
Coverage (%)
Score DM1/HCa Expression Function
P01023 Alpha-2-macroglobulin
163,291 66/95 69.54 11,454.35 1.64 Up Cellular process/regulation
P02760 Protein AMBP 38,999 10/26 37.78 2,146.99 1.58 Up Cellular process/process
metabolic/immune system P02652 Apolipoprotein
A II
11,175 6/11 72.00 9,656.85 1.84 Up Cellular process/developmental
process/response to stimulus/ metabolic process
P02749 Beta-2-glycoprotein 1
38,298 14/22 62.03 4,930.08 1.72 Up Cellular process/localization/
metabolic process/regulation P01877 Ig alpha-2 chain C
region
36,526 15/22 37.58 11,700.44 2.14 Up Cellular process/regulation/
immune system
P00734 Prothrombin 70,037 14/47 35.69 1,449.93 1.60 Up Cellular process/developmental
and metabolic process/regulation/ response to stimulus
P0C0L4 Complement C4 A
192,785 52/118 54.59 5,352.24 0.54 Down Immune system/regulation/
response to stimulus P20742 Pregnancy zone
protein
163,863 16/87 21.52 1,774.43 0.41 Down Interaction with cells and
organisms
Notes:aAverage differences of replicate samples run to type 1 diabetes patients compared with healthy control. Proteins are shown as 1.5-fold differences either upregulated
or downregulated (p<0.05). Functions were assigned according to the String databases and literature search.
Abbreviations: AMBP, alpha-1-microglobulin; DM1, type 1 diabetes mellitus; HC, healthy control; LC–MSE, liquid chromatography–data-independent label-free mass
spectrometry.
Diabetes, Metabolic Syndrome and Obesity: Targets and Therapy downloaded from https://www.dovepress.com/ by 118.70.13.36 on 21-Aug-2020
Dovepress
do Nascimento de Oliveira et al
are strongly associated with autoimmunity humoral and lead to impaired humoral responses.52 Thus, the upregulation of C4 observed in this study is suggestive of loss of some func-tions of the complement system and thus increased risk of infectious processes and impaired metabolic control in DM1.
AMBP is a serum protein filtered by the glomerular membrane in the proximal tubule.56,57 Increased urinary excretion of this protein was observed in DM1 patients in the presence of microalbuminuria and normoalbuminuria.57 In this sense, new research has indicated some biomarkers that precede albuminuria and have been detected in both DM1 and DM2 patients with early renal dysfunction.58 AMBP has been proposed as a biomarker of tubular dysfunction in the early stages of diabetic nephropathy and in the late stages of chronic kidney disease.59–62 Increased excretion urinary of AMBP has been frequently identified in patients with diabetes, compared with the control group.57 Increased levels of AMBP suggest that serum AMBP may play a role in the regulation of inflammatory processes,62 such as that occurs in diabetes. Interestingly, our study also showed that increased levels of AMBP occur in the serum proteome of DM1 patients, and to the best of our knowledge, this is the first study to observe this protein in serum from DM1 patients.
THRB is the protein precursor of thrombin, which plays a key role in thrombosis by converting fibrinogen to fibrin.63
Diabetes is associated with a number of changes in thrombotic and fibrinolytic coagulation factor level/activity, which collectively increase the risk of thrombus forma-tion.63 Thrombin generation is enhanced in both DM1 and DM2 individuals, secondary to low-grade activation of the coagulation system.64 It has been suggested that elevated THRB levels can contribute both to thrombotic risk and to shortened clotting times in patients with diabetes.65 In this sense, hyperglycemia has been associated with enhanced thrombin production, and controlling glucose levels results in reduced thrombin generation, suggesting that hyperglycemia is prothrombotic.64 Conversely, hypoglycemia is also associ-ated with enhanced clot formation.63 Here, we identified that THRB was upregulated in the serum of DM1 patients, which is an important component in the pathway of coagulation. This is in accordance with previous studies showing that this protein is suggestive of poorly controlled diabetes.
PZP was shown to be downregulated in the serum of DM1 patients compared with HCs. PZP is one of the most abundant pregnancy glycoprotein-associated plasma proteins with described immune inhibitory activities and is remark-ably homologous to α2M.66,67 Several studies have suggested that PZP has immunosuppressive properties in pregnancy,
indicating a role for this protein in maintaining immune tolerance to the fetus and equilibrating the maternal immune response.66,68 In fact, serum levels increase during gestation (up to 1,000 mg/L).69 Furthermore, high serum levels of PZP have been observed in relation to some diseases, including inflammatory conditions, such as rheumatoid arthritis and also in people who later developed Alzheimer’s disease.70,71 In the current study, we observed downregulation of PZP expression in the DM1 group compared with HCs. This finding is very relevant because, to our knowledge, this is the first report of low levels of PZP in the serum of DM1 patients. The reduction of this protein in DM1 patients suggests that there could be a suppression mechanism of it, thereby avoiding inhibition of the activation of T lymphocytes against the pancreatic β-cells. It has been suggested that PZP contributes to immune regula-tion by noncovalently sequestering a variety of other ligands such tumor necrosis factor-α, IL-2, and IL-6.72 In addition, Skornicka et al demonstrated that both native and activated PZP isoforms inhibited the activation of T-cell growth and IL-2 production.66 DM1 is thought to involve chronic inflam-mation, leading to the release and increased activity of vari-ous immune system cells with a central role for T cells and macrophages.73 Studies have shown that some inflammatory markers are enhanced in individuals with DM1 compared with those without.74,75 Taken together, our results suggest that PZP could be a target for a potential DM1 therapy.
Conclusion
In conclusion, we used a proteomic approach with label-free MSE analysis as a strategy to discover differential protein profiles between the serum of patients with DM1 and HCs.
We identified proteins that were expressed in differential levels in the serum of patients with DM1 compared with HCs. In addition, to our knowledge, we described the first evidence for changes in expression levels of PZP and APOH in the serum of DM1 patients.
Our results showed differential expression of proteins related to immune system, lipid metabolism, and coagulation pathways, which may be correlated to the development and progression of DM1. Accordingly, these findings need to be fully investigated and validated in future studies.
Acknowledgments
This work was supported by funding from Biotechnology and Molecular Biology Laboratory from Ceará State University and the National Research Council for graduate student scholarships. The authors thank the scholars of scientific initiation: PS, LT, JC, and MH.
Diabetes, Metabolic Syndrome and Obesity: Targets and Therapy downloaded from https://www.dovepress.com/ by 118.70.13.36 on 21-Aug-2020
Dovepress Candidate biomarkers for type 1 diabetes
Author contributions
All authors contributed toward data analysis, drafting and revising the paper and agree to be accountable for all aspects of the work.
Disclosure
The authors report no conflicts of interest in this work.
References
1. Milech A, Angelucci AP, Golbert A, et al. Diretrizes Da Sociedade Brasileira de Diabetes. 2015–2016th ed. Oliveira JEP de, Vencio S, edi-tors. São Paulo: AC Farmacêutica; 2016. Available from: http://www.dia-betes.org.br/profissionais/images/docs/DIRETRIZES-SBD-2015-2016. pdf.
2. Petersen KF, Shulman GI. Etiology of insulin resistance. Am J Med. 2006;119(5 Suppl 1):S10–S16.
3. Atkinson MA, Eisenbarth GS, Michels AW. Type 1 diabetes. Lancet. 2014;383(9911):69–82.
4. International Diabetes Federation. IDF Diabetes Atlas; 7th ed. 2015. Available from: http:/www.diabetesatlas.org. Accessed February 1, 2018. 5. World Health Organization. Global Report on Diabetes. 2016. Available in http://www.who.int/iris/handle/10665/204871. Accessed February 1, 2018.
6. American Diabetes Association (ADA). Standard of medical care in diabetes - 2017. Diabetes Care. 2017;40(Suppl 1):s4–s5.
7. Purohit S, She JX. Biomarkers for type 1 diabetes. Int J Clin Exp Med. 2008;1(2):98–116.
8. Sosenko JM, Krischer JP, Palmer JP, et al. A risk score for type 1 dia-betes derived from autoantibody-positive participants in the diadia-betes prevention trial-type 1. Diabetes Care. 2008;31(3):528–533. 9. Chen CC, Lu YC, Chen YW, et al. Hemopexin is up-regulated in plasma
from type 1 diabetes mellitus patients: role of glucose-induced ROS.
J Proteomics. 2012;75(12):3760–3777.
10. Zhi W, Sharma A, Purohit S, et al. Discovery and validation of serum protein changes in type 1 diabetes patients using high throughput two dimensional liquid chromatography-mass spectrometry and immunoas-says. Mol Cell Proteomics. 2011;10(11):M111.012203.
11. Sundsten T, Ortsater H. Proteomics in diabetes research. Mol Cell Endocrinol. 2009;297(1–2):93–103.
12. Neilson KA, Ali NA, Muralidharan S, et al. Less label, more free: approaches in label-free quantitative mass spectrometry. Proteomics. 2011;11(4):535–553.
13. Silva JC, Gorenstein MV, Li GZ, Vissers JP, Geromanos SJ. Absolute quantification of proteins by LCMSE: a virtue of parallel MS acquisition.
Mol Cell Proteomics. 2006;5(1):144–156.
14. SISVAN. Orientações Básicas Para a Coleta, Processamento, Análise de Dados E Informação Em Serviços de Saúde; 2004.
15. WHO Expert Committee on Physical Status: the use and pretation of anthropmetry. Physical status: the use of and inter-pretation of anthropometry: report of a WHO expert committee. 1995;854:1–4520.
16. World Health Organization. Global Status Report on Alcohol. Depart-ment of Mental Health and Substance Abuse. 2004.
17. Schoenborn CA, Adams PE. Health behaviors of adults: United States, 2005-2007. Vital Health Stat 10. 2010;(245):1–132.
18. Friedewald WT, Levy RI, Fredrickson DS. Estimation of the con-centration of low-density lipoprotein cholesterol in plasma, without use of the preparative ultracentrifuge. Clin Chem. 1972;18(6): 499–502.
19. Bradford MM. A rapid and sensitive method for the quantitation of microgram quantities of protein utilizing the principle of protein-dye binding. Anal Biochem. 1976;72:248–254.
20. Li GZ, Vissers JP, Silva JC, Golick D, Gorenstein MV, Geromanos SJ. Database searching and accounting of multiplexed precursor and product ion spectra from the data independent analysis of simple and complex peptide mixtures. Proteomics. 2009;9(6):1696–1719.
21. Sparre T, Larsen MR, Heding PE, Karlsen AE, Jensen ON, Pociot F. Unraveling the pathogenesis of type 1 diabetes with proteomics: present and future directions. Mol Cell Proteomics. 2005;4(4):441–457. 22. Rehman AA, Ahsan H, Khan FH. Alpha-2-macroglobulin: a
physiologi-cal guardian. J Cell Physiol. 2013;228(8):1665–1675.
23. Takada T, Kodera Y, Matsubara M, et al. Serum monomeric
α2-macroglobulin as a clinical biomarker in diabetes. Atherosclerosis. 2013;228(1):270–276.
24. Caseiro A, Barros A, Ferreira R, et al. Pursuing type 1 diabetes mel-litus and related complications through urinary proteomics. Transl Res. 2014;163(3):188–199.
25. Lu CH, Lin ST, Chou HC, Lee YR, Chan HL. Proteomic analysis of retinopathy-related plasma biomarkers in diabetic patients. Arch Bio-chem Biophys. 2013;529(2):146–156.
26. Athippozhy A, Huang L, Wooton-Kee CR, et al. Differential gene expression in liver and small intestine from lactating rats compared to age-matched virgin controls detects increased mRNA of cholesterol biosynthetic genes. BMC Genomics. 2011;12:95.
27. Schroeder HW, Cavacini L. Structure and function of immunoglobulins.
J Allergy Clin Immunol. 2010;125(2 Suppl 2):S41–S52.
28. Woof JM, Russell MW. Structure and function relationships in IgA.
Mucosal Immunol. 2011;4(6):590–597.
29. Triolo G, Giardina E, Zarcone MR, Giordano C, Rinaldi A, Bompiani GD. Contribution of secretory IgA, polymeric IgA and IgA/secretory component-containing circulating immune complexes to the serum hyper-IgA in diabetes mellitus. Diabetologia. 1984;27(Suppl):157–159. 30. Figueredo A, Ibarra JL, Rodriguez A, et al. Increased serum levels of IgA antibodies to hsp70 protein in patients with diabetes mellitus: their relationship with vascular complications. Clin Immunol Immunopathol. 1996;79(3):252–255.
31. Rodriguez-Segade S, Camiña MF, Carnero A, et al. High serum IgA con-centrations in patients with diabetes mellitus: agewise distribution and relation to chronic complications. Clin Chem. 1996;42(7):1064–1067. 32. Jaleel A, Halvatsiotis P, Williamson B, Juhasz P, Martin S, Nair KS. Identification of Amadori-modified plasma proteins in type 2 diabetes and the effect of short-term intensive insulin treatment. Diabetes Care. 2005;28(3):645–652.
33. Singh AK, Kingston JJ, Gupta SK, Batra HV. Recombinant bivalent fusion protein rVE induces CD4+ and CD8+ T-cell mediated memory immune response for protection against yersinia enterocolitica infection.
Front Microbiol. 2015;6:1407.
34. Gonzalez-Quintela A, Alende R, Gude F, et al. Serum levels of immu-noglobulins (IgG, IgA, IgM) in a general adult population and their relationship with alcohol consumption, smoking and common metabolic abnormalities. Clin Exp Immunol. 2007;151(1):42–50.
35. Castellani LW, Goto AM, Lusis AJ. Studies with apolipoprotein A-II transgenic mice indicate a role for HDLs in adiposity and insulin resistance. Diabetes. 2001;50(3):643–651.
36. Castellani LW, Nguyen CN, Charugundla S, et al. Apolipoprotein AII is a regulator of very low density lipoprotein metabolism and insulin resistance. J Biol Chem. 2008;283(17):11633–11644.
37. Feitosa AC, Feitosa-Filho GS, Freitas FR, Wajchenberg BL, Maranhão RC. Lipoprotein metabolism in patients with type 1 diabetes under intensive insulin treatment. Lipids Health Dis. 2013;12:15.
38. Pérez A, Caixàs A, Carreras G, et al. Lipoprotein compositional abnormalities in type I diabetes: effect of improved glycaemic control.
Diabetes Res Clin Pract. 1997;36(2):83–90.
39. Vergès B. Lipid disorders in type 1 diabetes. Diabetes Metab. 2009;35(5): 353–360.
40. Overgaard AJ, Hansen HG, Lajer M, et al. Plasma proteome analysis of patients with type 1 diabetes with diabetic nephropathy. Proteome Sci. 2010;8:4.
Diabetes, Metabolic Syndrome and Obesity: Targets and Therapy downloaded from https://www.dovepress.com/ by 118.70.13.36 on 21-Aug-2020
Dovepress
do Nascimento de Oliveira et al
41. Soedamah-Muthu SS, Colhoun HM, Taskinen MR, Idzior-Walus B, Fuller JH; EURODIAB IDDM Complications Study Group. Differ-ences in HDL-cholesterol:apoA-I + apoA-II ratio and apoE phenotype with albuminuric status in Type I diabetic patients. Diabetologia. 2000;43(11):1353–1359.
42. Hedrick CC, Castellani LW, Wong H, Lusis AJ. In vivo interactions of apoA-II, apoA-I, and hepatic lipase contributing to HDL structure and antiatherogenic functions. J Lipid Res. 2001;42(4):563–570. 43. Boucher J, Ramsamy TA, Braschi S, Sahoo D, Neville TA, Sparks DL.
Apolipoprotein A-II regulates HDL stability and affects hepatic lipase association and activity. J Lipid Res. 2004;45(5):849–858.
44. Julve J, Muñoz García C, Santos D, Blanco-Vaca F, Escolà-Gil JC. La apolipoproteína A-II altera la composición apolipoproteica de HDL y su capacidad para activar la lipoproteína lipasa. Clin Investig Arterioscler. 2010;22(5):192–197.
45. Pownall HJ, Gillard BK, Gotto AM. Setting the course for apoAII: a port in sight? Clin Lipidol. 2013;8(5):551–560.
46. Castro A, Lázaro I, Selva DM, et al. APOH is increased in the plasma and liver of type 2 diabetic patients with metabolic syndrome. Athero-sclerosis. 2010;209(1):201–205.
47. Gómez-Cardona EE, Hernández-Domínguez EE, Velarde-Salcedo AJ, et al. 2D-DIGE as a strategy to identify serum biomarkers in Mexican patients with type-2 diabetes with different body mass index. Sci Rep. 2017;7:46536.
48. Ouchi Y, Yoshikawa E, Sekine Y, et al. Microglial activation and dopa-mine terminal loss in early Parkinson’s disease. Ann Neurol. 2005;57(2): 168–175.
49. Simó R, Higuera M, García-Ramírez M, Canals F, García-Arumí J, Hernández C. Elevation of apolipoprotein A-I and apolipoprotein H levels in the vitreous fluid and overexpression in the retina of diabetic patients. Arch Ophthalmol. 2008;126(8):1076.
50. Chonn A, Semple SC, Cullis PR. Beta 2 glycoprotein I is a major protein associated with very rapidly cleared liposomes in vivo, suggesting a significant role in the immune clearance of “non-self ” particles. J Biol Chem. 1995;270(43):25845–25849.
51. Lee SC, Pervaiz S. Apoptosis in the pathophysiology of diabetes mel-litus. Int J Biochem Cell Biol. 2007;39(3):497–504.
52. Mizuno M, Suzuki Y, Ito Y. Complement regulation and kidney diseases: recent knowledge of the double-edged roles of complement activation in nephrology. Clin Exp Nephrol. 2018;22(1):3–14.
53. Charlesworth JA, Timmermans V, Golding J, et al. The complement system in type 1 (insulin-dependent) diabetes. Diabetologia. 1987;30(6): 372–379.
54. Liberatore RR, Barbosa SF, Alkimin Md, et al. Is immunity in diabetic patients influencing the susceptibility to infections? Immunoglobulins, complement and phagocytic function in children and adolescents with type 1 diabetes mellitus. Pediatr Diabetes. 2005;6(4):206–212. 55. Turina M, Fry DE, Polk HC. Acute hyperglycemia and the innate
immune system: clinical, cellular, and molecular aspects. Crit Care Med. 2005;33(7):1624–1633.
56. Ekström B, Peterson PA, Berggárd I. A urinary and plasma
α1-glycoprotein of low molecular weight: Isolation and some proper-ties. Biochem Biophys Res Commun. 1975;65(4):1427–1433. 57. Soggiu A, Piras C, Bonizzi L, Hussein HA, Pisanu S, Roncada P. A
discovery-phase urine proteomics investigation in type 1 diabetes. Acta Diabetol. 2012;49(6):453–464.
58. Gluhovschi C, Gluhovschi G, Petrica L, et al. Urinary biomarkers in the assessment of early diabetic nephropathy. J Diabetes Res. 2016;2016:1–13.
59. Pfleiderer S, Zimmerhackl LB, Kinne R, Manz F, Schuler G, Brandis M. Renal proximal and distal tubular function is attenuated in diabetes mel-litus type 1 as determined by the renal excretion of alpha 1-microglobu-lin and Tamm-Horsfall protein. Clin Investig. 1993;71(12):972–977. 60. Varghese SA, Powell TB, Budisavljevic MN, et al. Urine biomarkers predict
the cause of glomerular disease. J Am Soc Nephrol. 2007;18(3):913–922. 61. Aregger F, Uehlinger DE, Witowski J, et al. Identification of IGFBP-7 by urinary proteomics as a novel prognostic marker in early acute kidney injury. Kidney Int. 2014;85(4):909–919.
62. Korenkova V, Jones A, Hoy WE, Morais C, Cooper MA, Gobe GC. Urinary biomarkers for detection of early and advanced chronic kidney disease – a pilot study. Med Chem (Los Angeles). 2015;5(2):96–103. 63. Alzahrani S, Ajjan R. Review article: coagulation and fibrinolysis in
diabetes. Diabetes Vasc Dis Res. 2010;7(4):260–273.
64. Ceriello A, Esposito K, Ihnat M, Zhang J, Giugliano D. Simulta-neous control of hyperglycemia and oxidative stress normalizes enhanced thrombin generation in type 1 diabetes. J Thromb Haemost. 2009;7(7):1228–1230.
65. Sauls DL, Banini AE, Boyd LC, Hoffman M. Elevated prothrombin level and shortened clotting times in subjects with type 2 diabetes. J Thromb Haemost. 2007;5(3):638–639.
66. Skornicka EL, Kiyatkina N, Weber MC, Tykocinski ML, Koo PH. Preg-nancy zone protein is a carrier and modulator of placental protein-14 in T-cell growth and cytokine production. Cell Immunol. 2004;232(1–2): 144–156.
67. Devriendt K, Van den Berghe H, Cassiman JJ, Marynen P. Primary structure of pregnancy zone protein. Molecular cloning of a full-length PZP cDNA clone by the polymerase chain reaction. Biochim Biophys Acta. 1991;1088(1):95–103.
68. Stimson WH. Studies on the immunosuppressive properties of a pregnancy-associated alpha-macroglobulin. Clin Exp Immunol. 1976;25(2):199–206.
69. Folkersen J, Teisner B, Grunnet N, Grudzinskas JG, Westergaard JG, Hindersson P. Circulating levels of pregnancy zone protein: normal range and the influence of age and gender. Clin Chim Acta. 1981;110(2–3):139–145.
70. Horne CHW, Schoultz B, Towler CM, Damber MG, Stigbrand T, Gibb LM. Serum pregnancy-associated α2-glycoprotein levels in autoimmune diseases. Vox Sang. 1978;34(6):329–334.
71. IJsselstijn L, Dekker LJ, Stingl C, et al. Serum levels of pregnancy zone protein are elevated in presymptomatic Alzheimer’s disease. J Proteome Res. 2011;10(11):4902–4910.
72. Wu SM, Pizzo SV. Mechanism of hypochlorite-mediated inactivation of proteinase inhibition by alpha 2-macroglobulin. Biochemistry. 1999;38(42):13983–13990.
73. Bending D, Zaccone P, Cooke A. Inflammation and type one diabetes.
Int Immunol. 2012;24(6):339–346.
74. Snell-Bergeon JK, West NA, Mayer-Davis EJ, et al. Inflammatory markers are increased in youth with type 1 diabetes: the SEARCH case-control study. J Clin Endocrinol Metab. 2010;95(6):2868–2876. 75. Xiang Y, Zhou P, Li X, et al. Heterogeneity of altered cytokine levels across the clinical spectrum of diabetes in China. Diabetes Care. 2011;34(7): 1639–1641.
Diabetes, Metabolic Syndrome and Obesity: Targets and Therapy downloaded from https://www.dovepress.com/ by 118.70.13.36 on 21-Aug-2020
Dovepress Candidate biomarkers for type 1 diabetes
Supplementary material
Table S1 List of serum proteins between type 1 diabetes patients and healthy controls as identified by LC–MSE analysis Accession
number
Protein name Molecular
weight
Matched peptides
Coverage (%) Score
P43652 Afamin 69,069 4/61 11.52 100.66
P02763 Alpha-1-acid glycoprotein 1 23,512 9/17 53.73 11,680.58
P19652 Alpha-1-acid glycoprotein 2 23,603 8/19 39.80 8,975.25
P01011 Alpha-1-antichymotrypsin 47,651 16/31 45.63 4,340.51
P01009 Alpha-1-antitrypsin 46,737 34/35 62.44 13,832.54
P04217 Alpha-1B-glycoprotein 54,254 8/26 51.31 6,138.02
P08697 Alpha-2-antiplasmin 54,566 7/34 25.46 694.29
P02765 Alpha-2-HS glycoprotein 39,325 4/18 50.68 2,842.23
P01023 Alpha-2-macroglobulin 163,291 66/95 69.54 11,454.35
P01019 Angiotensinogen 53,154 12/25 35.26 4,547.05
Q9UJ72 Annexin A10 37,278 4/35 10.19 134.28
P02647 Apolipoprotein A I 30,778 27/32 68.54 29,954.64
P02652 Apolipoprotein A II 11,175 6/11 72.00 9,656.85
P06727 Apolipoprotein A IV 45,399 12/42 54.55 2,142.37
P02656 Apolipoprotein C III 10,852 3/10 36.36 12,643.42
P05090 Apolipoprotein D 21,276 7/12 30.69 1,265.36
P02649 Apolipoprotein E 36,154 6/30 20.19 350.88
P02749 Beta 2 glycoprotein 1 38,298 14/22 62.03 4,930.08
Q9Y5Z0 Beta secretase 2 56,181 3/23 9.46 140.23
P22792 Carboxy peptidase N subunit 2 60,557 5/30 13.03 334.61
O43866 CD5 antigen like 38,088 8/31 43.80 614.25
Q7L2Z9 Centromere protein Q 30,595 4/28 17.16 121.48
O43303 Centriolar coiled coil protein of 110 kDa 113,424 9/80 10.67 226.74
P00450 Ceruloplasmin 122,205 27/80 57.28 3,369.44
P10909 Clusterin 52,495 12/36 32.96 3,176.77
P00748 Coagulation factor XII 67,792 4/40 5.37 96.90
P13671 Complement component C6 104,787 10/65 9.31 159.79
P01024 Complement C3 187,149 61/136 51.41 8,628.71
P0C0L4 Complement C4 A 192,785 52/118 54.59 5,352.24
P0C0L5 Complement C4 B 192,752 44/117 48.57 5,333.65
P00751 Complement factor B 85,533 23/64 38.09 1,924.60
P08603 Complement factor H 139,097 33/96 40.70 1,155.49
P05156 Complement factor I 65,751 2/42 5.49 117.71
P08185 Corticosteroid binding globulin 45,141 6/23 27.90 371.10
P04003 C4b binding protein alpha chain 67,033 13/45 30.82 1,198.61
A6NLW8 Double homeobox protein A 23,817 1/21 13.24 142.05
O43543 DNA repair protein XRCC2 31,957 2/19 10.36 182.94
Q9NPG1 Frizzled 3 76,263 2/54 6.16 148.64
P06396 Gelsolin 85,968 17/51 32.86 661.02
Q969I3 Glycine N-acyltransferase like protein1 35,101 3/17 11.26 149.87
Q13588 GRB2 related adapter protein 25,337 2/20 26.27 389.12
O96020 G1 S specific cyclin E2 46,757 4/29 11.88 105.55
P00738 Haptoglobin 45,205 27/28 70.94 17,966.31
P00739 Haptoglobin related protein 3,903 20/25 46.26 7,405.70
P69905 Hemoglobin subunit alpha 15,256 6/9 76.76 3,268.27
P68871 Hemoglobin subunit beta 15,998 7/13 57.82 4,909.04
P02042 Hemoglobin subunit delta 16,056 5/13 29.25 4,275.18
P02100 Hemoglobin subunit epsilon 16,203 2/14 21.77 4,275.18
P69891 Hemoglobin subunit gamma 1 16,140 5/13 40.82 4,306.96
P69892 Hemoglobin subunit gamma 2 16,126 4/13 38.10 4,295.91
P02790 Hemopexin 51,677 21/34 50.87 16,740.46
(Continued)
Diabetes, Metabolic Syndrome and Obesity: Targets and Therapy downloaded from https://www.dovepress.com/ by 118.70.13.36 on 21-Aug-2020
Dovepress
do Nascimento de Oliveira et al
Accession number
Protein name Molecular
weight
Matched peptides
Coverage (%) Score
P05546 Heparin cofactor 2 57,071 7/36 11.62 295.97
P04196 Histidine rich glycoprotein 59,578 12/33 24.95 1,886.61
P17482 Homeobox protein Hox B9 28,059 1/23 15.20 155.80
P01876 Ig alpha-1-chain C region 37,655 20/23 67.42 19,361.04
P01877 Ig alpha-2-chain C region 36,526 15/22 69.41 11,700.44
P01857 Ig gamma 1 chain C region 36,106 9/21 37.58 1,570.00
P01859 Ig gamma 2 chain C region 35,901 4/20 17.18 300.21
P01860 Ig gamma 3 chain C region 41,287 4/24 12.20 702.83
P01861 Ig gamma 4 chain C region 35,941 7/20 33.94 1,236.51
P01766 Ig heavy chain VIII region BRO 13,227 4/6 40.83 4,324.36
P01767 Ig heavy chain VIII region BUT 11,906 1/8 9.57 976.53
P01774 Ig heavy chain VIII region POM 12,710 1/8 15.97 2,043.78
P01777 Ig heavy chain VIII region TEI 12,559 2/6 36.13 4,324.36
P01765 Ig heavy chain VIII region TIL 11,612 2/6 33.04 2,043.78
P01779 Ig heavy chain VIII region TUR 12,188 1/7 16.38 2,043.78
P01776 Ig heavy chain VIII region WAS 12,847 2/7 29.91 2,043.78
P01763 Ig heavy chain VIII region WEA 12,142 1/6 9.65 976.53
P01764 Ig heavy chain VIII region 23 12,582 2/8 18.80 965.64
P01871 Ig mu chain C region 49,307 25/38 63.94 8,892.79
P04220 Ig mu heavy chain disease protein 43,057 22/35 52.94 12,444.26
P01834 Ig kappa chain C region 11,609 7/7 80.19 26,627.65
P01614 Ig kappa chain VII region Cum 12,676 1/7 11.30 787.52
P06309 Ig kappa chain VII region GM607 Fragment 12,664 2/5 31.62 567.77
P06310 Ig kappa chain VII region RPMI 6410 14,707 2/7 29.32 622.24
P06617 Ig kappa chain V II region TEW 2,059 2/5 32.74 571.31
P04206 Ig kappa chain VIII region GOL 11,830 2/8 31.19 1,520.77
P18135 Ig kappa chain VIII region HAH 14,073 2/8 26.36 1,260.29
P18136 Ig kappa chain VIII region HIC 14,089 2/7 26.36 1,260.29
P01621 Ig kappa chain VIII region NG9 Fragment 10,729 2/6 56.00 590.59
P01620 Ig kappa chain VIII region SIE 11,775 4/6 66.06 1,600.43
P01623 Ig kappa chain VIII region WOL 11,746 3/7 51.38 1,622.15
P01622 Ig kappa chain VIII region TI 11,778 3/6 51.38 1,520.77
P04206 Ig kappa chain VIII region GOL 11,830 2/8 31.19 1,520.77
P0CG04 Ig lambda 1 chain C region 11,348 5/7 65.09 38,924.68
P0CG05 Ig lambda 2 chain C region 11,294 6/7 77.36 39,000.63
P0CG06 Ig lambda 3 chain C region 11,238 5/7 76.42 39,000.63
P0CF74 Ig lambda 6 chain C region 11,277 5/6 77.36 24,818.13
A0M8Q6 Ig lambda 7 chain C region 11,303 4/7 46.23 24,610.28
P01591 Immunoglobulin J chain 18,099 4/11 34.59 1,818.20
P35858 Insulin like growth factor binding protein complex acid labile subunit
66,035 6/35 12.56 119.96
B9A064 Immunoglobulin lambda like polypeptide 5 23,063 6/12 42.99 38,934.43
P19827 Inter-alpha trypsin inhibitor heavy chain H1 101,389 19/56 31.61 1,735.56
P19823 Inter-alpha trypsin inhibitor heavy chain H2 106,464 21/70 32.77 1,415.98
Q14624 Inter-alpha trypsin inhibitor heavy chain H4 103,358 22/64 40.00 1,410.90
Q5T749 Keratinocyte proline rich protein 64,136 1/29 9.33 133.79
P01042 Kininogen 1 71,958 13/61 39.13 1,470.83
P02750 Leucine-rich alpha-2-glycoprotein 38,178 6/24 26.80 925.55
O15165 Low-density lipoprotein receptor class A domain containing protein
33,900 2/19 12.42 142.67
Q96PD5 N acetylmuramoyl L alanine amidase 62,217 7/36 23.61 381.10
Q13516 Oligodendrocytetranscriptionfactor2 32,385 2/16 20.74 356.38
P05155 Plasma protease C1 inhibitor 55,154 7/29 21.60 1,325.77
P00747 Plasminogen 90,569 15/63 26.91 318.40
P02775 Platelet basic protein 13,894 3/9 46.09 801.19
Table S1 (Continued)
(Continued)
Diabetes, Metabolic Syndrome and Obesity: Targets and Therapy downloaded from https://www.dovepress.com/ by 118.70.13.36 on 21-Aug-2020
Dovepress
Diabetes, Metabolic Syndrome and Obesity: Targets and Therapy
Publish your work in this journal
Submit your manuscript here: https://www.dovepress.com/diabetes-metabolic-syndrome-and-obesity-targets-and-therapy-journal
Diabetes, Metabolic Syndrome and Obesity: Targets and Therapy is an international, peer-reviewed open-access journal committed to the rapid publication of the latest laboratory and clinical findings in the fields of diabetes, metabolic syndrome and obesity research. Original research, review, case reports, hypothesis formation, expert
opinion and commentaries are all considered for publication. The manuscript management system is completely online and includes a very quick and fair peer-review system, which is all easy to use. Visit http://www.dovepress.com/testimonials.php to read real quotes from published authors.
Dove
press
Candidate biomarkers for type 1 diabetes
Accession number
Protein name Molecular
weight
Matched peptides
Coverage (%) Score
P20742 Pregnancy zone protein 163,863 16/87 21.52 1,774.43
P02760 Protein AMBP 38,999 10/26 37.78 2,146.99
Q9UJC3 Protein Hook homolog 1 84,648 8/69 13.87 65.59
P00734 Prothrombin 70,037 14/47 35.69 1,449.93
Q9H5L9 Putative uncharacterized protein C5orf66 1,557 1/8 24.83 115.20
O00472 RNA polymerase II elongation factor ELL2 7,232 5/74 9.69 163.86
Q9NP77 RNA polymerase II subunit A C terminal domain phosphatase SSU72
22,575 7/17 43.30 179.28
Q96HS1 Serine threonine protein phosphatase PGAM5 mitochondrial
32,005 3/23 11.76 229.10
P02787 Serotransferrin 77,064 42/76 72.78 42,299.91
P02768 Serum albumin 69,367 54/55 38.92 4,317.47
P27169 Serum paraoxonase arylesterase 1 39,731 7/18 50.99 2,611.12
P04278 Sex hormone binding globulin 43,779 4/29 25.62 210.35
O00337 Sodium nucleoside cotransporter 71,584 3/35 3.39 102.95
Q13596 Sortingnexin1 5,907 3/40 11.88 178.19
O60235 Transmembrane protease serine 11D 46,264 2/20 11.48 122.25
P02766 Transthyretin 15,887 4/9 50.34 302.37
Q9NZQ9 Tropomodulin 4 39,336 3/32 26.09 192.01
Q5SQH8 Uncharacterized protein C6orf 136 35,794 2/16 29.84 122.10
Q8N865 Uncharacterized protein C7orf 31 68,465 4/49 12.03 47.34
Q6UXV3 Uncharacterized protein UNQ6126 16,883 1/8 36.31 161.41
P02774 Vitamin D binding protein 52,964 24/45 67.93 3,508.70
P04004 Vitronectin 54,306 10/28 38.49 2,808.10
P25311 Zinc alpha-2-glycoprotein 34,259 9/27 48.66 2,246.30
P21506 Zinc finger protein 10 66,455 4/45 9.60 220.02
Q86UK7 Zinc finger protein 598 98,637 6/71 10.18 161.99
Abbreviations: AMBP, alpha-1-microglobulin; LC–MSE, liquid chromatography–data-independent label-free mass spectrometry.
Table S1 (Continued)
Diabetes, Metabolic Syndrome and Obesity: Targets and Therapy downloaded from https://www.dovepress.com/ by 118.70.13.36 on 21-Aug-2020