Article
1
Removal of Copper Ions in Wastewater by
2
Adsorption onto a Green Adsorbent from
3
Winemaking Wastes
4
Lorena Alcaraz 1, Irena García-Díaz 1, Francisco J. Alguacil 1 and Félix A. López 1,*
5
1 National Center for Metallurgical Research (CENIM). Spanish National Research Council (CSIC). Avda.
6
Gregorio del Amo, 8. 28040 Madrid, Spain; alcaraz@cenim.csic.es (L.A.); irenegd@cenim.csic.es (I.G.-D.);
7
fjalgua@cenim.csic.es (F.J.A.); f.lopez@cenim.csic.es (F.A.L.)
8
* Correspondence: f.lopez@cenim.csic.es (F.A.L.)
9
10
Abstract: This article presents the copper ions adsorption process using an activated carbon from
11
winemaking wastes. The pH, temperature, activated carbon amount and initial copper
12
concentration were varied based on a full factorial 2k experimental design. Kinetic and
13
thermodynamic studies were also carried out. The adsorption kinetics was found follow a
14
pseudo-second-order model. The adsorption data fit better to the Langmuir isotherm. The ANOVA
15
demonstrated that both pH of the solution and activated carbon dosage had the greatest influence
16
on copper adsorption. The activation energy was -32 kJ·mol-1 suggesting that the copper adsorption
17
is a physic-sorption process. The best fit to a linear correlation was the moving boundary equation
18
that controls the kinetics for the adsorption copper ions onto the activated carbon. The X-ray
19
photoelectron spectroscopy (XPS) results reveal the existence of different copper species (Cu2+, Cu+
20
and or Cu0) on the surface of the carbonaceous adsorbent after the adsorption, which could suggest
21
a simultaneous reduction process.
22
Keywords: activated carbon; adsorption; copper; winemaking wastes.
23
24
1. Introduction
25
The contamination of water by toxic heavy metals is a worldwide environmental problem that
26
has increasingly focused the attention of the scientific community [1]. Heavy metals such as Cu, Cd,
27
Pb and Zn, among others, are present in the water through the discharge of industrial wastewater
28
and are toxic to human beings and other living species when their concentrations exceed certain
29
values [2]. In humans, the poisoning by copper ingestion may show systemic effects such as
30
hemolysis or liver and kidney damage. In addition, other local effects have been reported such as
31
irritation of upper respiratory tract, gastrointestinal disturbance with vomiting and diarrhea and a
32
form of contact dermatitis [1]. All of these effects contribute to a necessary treatment of the
33
wastewater that containing copper [3]. The U.S. Environmental Protection Agency (EPA) has set a
34
guidance level for copper in drinking water at 1.3 mg·L-1 [4].
35
Copper ions may be present in waters through several sources such as mining operations,
36
machinery, electric power, chemical industry, electroplating processes, petroleum refining or
37
pesticides industries [5]. To copper removal, different methods have been studied such as
38
precipitation [6], on exchange [7], membrane filtration [8] or ionic flocculation [9]. Nevertheless,
39
these remove methods are usually expensive being the adsorption process a highly effective and
40
economical method [3]. Therefore, the adsorption method to remove heavy metal ions from aqueous
41
solutions by a low-cost adsorbent (which is defined as a material that is abundant in nature, or is a
42
by-product or waste material from industry) is a constant research development [2].
43
In this sense, activated carbons are known as very effective adsorbents. This type of the
44
materials is characterized by have highly porosity, great surface area, variable characteristics of
45
surface chemistry, and high degree of surface reactivity [10,11]. However, active carbons have high
46
production costs and are usually more expensive than other types of adsorbents. For this reason,
47
nowadays, the production of activated carbons from renewable and cheaper precursors have led a
48
growing attention to the researchers [12,13].
49
In recent years, activated carbons from different wastes such as barley straw [14], pistachio
50
wood [15], coconut shells [16], wild olive cores [17] or winewastes [18] have been tested as effective
51
candidates to carried out metal removal by the adsorption method.
52
This research describes the obtaining and characterization of activated carbon from a
53
winemaking waste, bagasse. Different experiments were assessed modified the pH value, copper
54
concentration, adsorbent dosage and temperature in order to investigate the adsorbent capacity of
55
copper ions onto AC.
56
The results were analyzed by a statistical experimental design and the influence of three factors
57
were considered: pH of the solution, metal concentration and adsorbent dosage.
58
2. Results and discussion
59
2.1. Adsorption experiment
60
2.1.1. Influence of the pH of the solution
61
The pH is a variable that have a great effect on the adsorption process [19]. To evaluate the
62
surface charge of the AC the zeta potential measurements were assessed. The value of PZC for the
63
obtained activated carbon is 3.4. The AC surface is positively charged between 0 to the PZC pH. For
64
pH values higher than 3.4, the AC surface exhibit a negative charge.
65
The effect of the pH on the Cu adsorption was studied by different experiments. The
66
experimental conditions were 25 mg of activated carbon was added to 100 mL solution containing
67
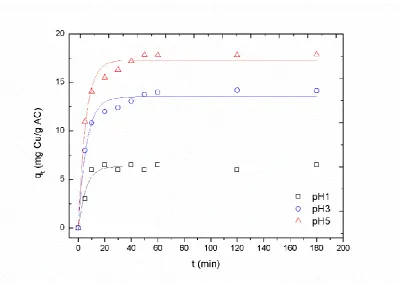
0.01 g·L-1 of copper ions. The pH of the solutions was adjusted at 1, 3 and 5 using 0.1 M HCl. Figure 1
68
exhibits the adsorbed copper amount onto the activated carbon versus the contact time.
69
70
71
Figure 1. Copper uptake onto the carbon at different pH values as a function of the contact time
The adsorption capacity increases with the solution pH. The Cu2+ removal is quite low at pH 1
73
and 3, this could be due that at these pH values, the surface of the AC is positively charged, so there
74
is electrostatic repulsion between the surface and the metal charge. When the pH increasing pH
75
beyond PZC (i.e., pH 5 value experiment), the negative charge on the AC surface increases, leading
76
to an enhancing the metal adsorption [20]. Thereby, the subsequently experiments were carried out
77
at the pH value where the observed adsorption was maximum.
78
2.1.2. Effect of Cu2+ concentration
79
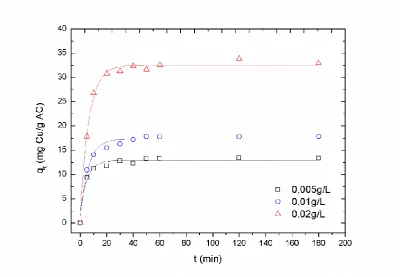
The adsorption of different copper concentration (0.005-0.02 g·L-1) with an amount of 25 mg of
80
the activated carbon at pH 5 were analyzed (Figure 2). As expected, the removed Cu2+ amount
81
decrease with the increase of the initial concentration. However, even in the highest concentration
82
studied, the copper adsorption is nearly to 36 mg Cu/g AC, probably due to the fact of the rapid
83
saturation of the activated sites with a certain metal concentration [21].
84
85
86
Figure 2. Effect of copper concentration as a function of the contact time.
87
2.1.3. Effect of activated carbon dosage
88
In order to evaluate the effect of the adsorbent dosage for Cu2+ adsorption, solutions of 0.01g·L-1
89
Cu2+ were put in contact with different masses (12.5-75 mg) of the activated carbon at pH 5. Figure 3
90
shows the obtained results. As can be appreciated the Cu amount adsorbed onto the AC increase
91
with the adsorbent dosage.
94
Figure 3. Effect of the adsorbent dosage on metal uptake.
95
2.1.4. Effect of the temperature
96
The copper adsorption was analyzed at different temperatures. Figure 4 exhibits copper uptake
97
as a function of time for the different temperatures studied. The amount of copper adsorbed
98
increases when so did the temperature.
99
100
101
Figure 4. Copper uptake at different temperatures.
2.1.5. Equilibrium isotherms
103
The study of equilibrium isotherms was carried out using the Langmuir, Freundlich and
104
Temkin equations. The calculated constant parameters and correlation coefficients are given in Table
105
1.
106
Table 1. Calculated parameters values for the different linear models.
107
Langmuir Freundlich Temkin
qm (mg·g-1) b (L·mg-1) RL R2 KF (L·g-1) 1/n R2 AT bT R2
16.95 3.94 0.03 0.998 5.91 0.92 0.967 0.82 104.92 0.981
108
The greater correlation coefficient was obtained for Langmuir isotherm. The maximum
109
adsorption capacity (qm) calculated from this model is similar to the experimental one 22 mg·g-1. In
110
addition, the Langmuir non-dimensional factor (separation factor, RL) of 0.03 indicates a favorable
111
adsorption process [4,22].
112
2.1.6. Kinetic study
113
The results derived from Figure 4 were used to fit various kinetics models and, the calculated
114
results from these fits are summarized in Table 2.
115
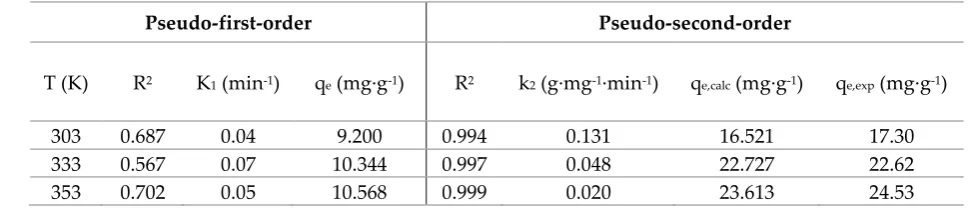
In all cases, pseudo-second-order model showed significantly higher correlation coefficients
116
than the pseudo-first-order model. The calculated qe values are in good agreement with the obtained
117
experimental qe values. In addition, K2 constant decreased with temperature which indicates that the
118
metal adsorption to occur easily at high temperatures.
119
Table 2. Kinetic parameters for copper adsorption at different temperatures.
120
Pseudo-first-order Pseudo-second-order
T (K) R2 K1 (min-1) qe (mg·g-1) R2 k2 (g·mg-1·min-1) qe,calc (mg·g-1) qe,exp (mg·g-1)
303 0.687 0.04 9.200 0.994 0.131 16.521 17.30
333 0.567 0.07 10.344 0.997 0.048 22.727 22.62
353 0.702 0.05 10.568 0.999 0.020 23.613 24.53
121
In order to estimate the adsorption type, the kinetics rate constants (ln k2,obs) were fitted versus
122
1/T, with slope −Ea/R [23]. The activation energy is frequently used for differentiating between
123
physical and chemical adsorption. In the case of the physical adsorption, the reactions are readily
124
reversible, equilibrium attained rapidly and thus energy requirements are small (between the range
125
of 5 to 40 kJ·mol-1). However, the chemical adsorption is specific, involves stronger forces and thus
126
requires larger activation energies (40 to 800 kJ·mol-1) [23]. In the present case, the calculated
127
activation was -32 kJ·mol-1 which suggested a physic-sorption process.
128
Table 3 summarized the obtained results of the thermodynamic parameters. The calculated
129
values for enthalpy change (-13.9 kJ·mol-1) and free energy change (-16.53, -32.10 and -33.19 kJ·mol-1)
130
indicate that the copper adsorption by the activated carbon is an exothermic, spontaneous and
131
favorable process.
Table 3. Thermodynamic parameters at different temperatures.
139
T (K) -ΔH0(kJ·mol−1) ΔS0 (J·mol−1·K−1) -ΔG0 (kJ·mol−1)
303
13.93 54.55
16.53
333 32.10
353 33.19
140
2.2. Characterization of the AC and AC-Cu
141
2.2.1. Scanning electron microscopy (SEM)
142
SEM micrographs of the initial AC and AC-Cu are exhibit in Figure 5. A clear change can be
143
appreciated when the copper is adsorbed onto the AC surface. Initially, a porous structure was
144
observed characteristic of an active carbon. After the Cu adsorption, the pores structure changes
145
where a different contrast was appreciated. In addition, microanalysis carried out which indicates
146
the presence of peak at 1 keV characteristics of Cu k in the sample.
147
148
149
Figure 5. SEM images of the AC (a) before and (b) after the Cu adsorption and (c) EDS microanalysis of the
150
AC-Cu sample.
151
2.2.2. X-ray photoelectron spectroscopy (XPS) analysis
152
XPS spectrum of C 1s regions for both AC and AC-Cu samples are depicted in Figure 6a and b.
153
Registered spectra are similar in terms of the shape and position of the bands. A broad and
154
asymmetric band is observed in both cases suggested the existence of different carbon species. The
deconvolution of the bands exhibited four peaks around 285 (C-C bond), 286 (C-OH bond), 288 (C=O
156
bond), and 290 (COOH bond) [24–26].
157
On the other hand, XPS spectrum for AC-Cu sample concerning Cu 2p core level excitation is
158
shown in Figure 6c in order to understand the electronic structure of copper species at superficial
159
level. The obtained spectrum shows two main peaks centered at around 933 eV and 953 eV which
160
can be attributed with Cu 2p3/2 and 2p1/2, respectively. In addition, Cu 2p3/2 peak exhibits a shoulder
161
band that could be indicating that the Cu2+ components are different in chemical environment [27,28]
162
as a previously reported. These observed peaks appeared at ∼934.3 eV and ∼932.6 eV and can be
163
assigned to octa-coordinated of Cu2+ ions and tetra-coordinated of Cu+-Cu0 species [27,28]. It should
164
be noted it is difficult to distinguish between Cu+ and Cu0 peaks, since the Cu 2p binding energies of
165
both species are very close [29]. So, the obtained results suggested that Cu2+ could be reduced to Cu+
166
even Cu0. Despite of the kinetic studies shown that the adsorption process is a physic-sorption
167
process, the obtained results from XPS analyses could be suggest a chemisorption process. Finally,
168
the band at 945 eV can be assigned at satellite bands. This band is generated by an electron transfer
169
from a ligand orbital to a 3d orbital of Cu. Therefore, since Cu0 or Cu+ species have completely filled
170
d level, the observed satellite band confirms that the Cu2+ specie are present in the surface of the
171
material [28,30,31].
172
173
174
Figure 6. XPS spectra of the activated carbon and AC-Cu activated carbon.
175
2.3. Post-treatment of the adsorption process
176
2.3.1. Scanning electron microscopy (SEM)
177
To investigate about the possibilities to recover copper from the Cu(II)-bearing solutions, and as
178
a first approach, these were precipitated with sodium borohydride. As a result of this precipitation a
179
near black solid is yielded, which apparently is formed by cuprite and zero valent copper.
The overall reaction responsible for such precipitation could be written as:
181
6Cu
2++ 6H
2O + BH
4−→ 2Cu
2O + 2Cu
0+ 12H
++ B(OH)
4−(Eq. 1)
182
The subsequent SEM study carried out indicate that the solid is formed by nanoparticles
183
agglomerates having various shapes: nanoplates and octahedral, characteristics of the Cu2O/Cu
184
phases nanostructures [32,33].
185
2.4. Adsorption mechanisms
186
Adsorption process mechanism can be controlled by a several diffusion steps: (a) film diffusion
187
(bulk diffusion and external film diffusion; (b) particle diffusion (intraparticle or internal diffusion);
188
(c) moving boundary process, proper sorption reaction between sorbent and active sites, mass
189
action; apart of chemical reaction that may contribute to the control of mass transfer [34].
190
The calculated parameters for each of the different studied models [35] are summarized in
191
Table 4. The obtained correlation coefficients show that the copper adsorption can be best explained
192
by the moving boundary process.
193
Table 4. Kinetic constants of the different adsorption mechanism.
194
Model R2 k
film-diffusion 0.946 0.058
particle-diffusion 0.951 0.050
moving boundary 0.982 0.012
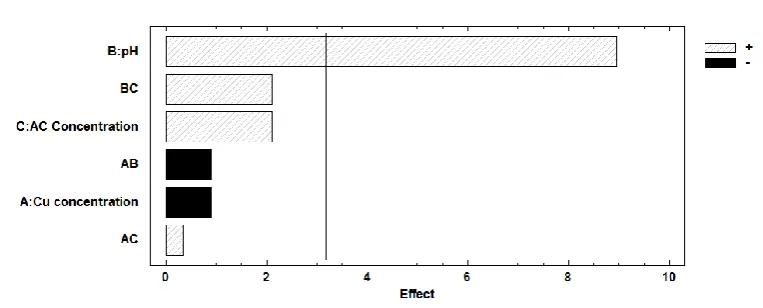
2.4. Statistical analysis
195
In order to know the influence of various variables, copper concentration (A), pH (B) and
196
carbon dosage (C) in the adsorption of Cu(II) onto AC a full factorial design of 23 were done [36,37].
197
By means of the statistical analysis of the factor considered, the Pareto chart allows to detect the
198
factor and interaction effects that are considered statically significant with a p-values <0.05 [38,39].
199
The only statically significant factor is the pH see Figure 7, the positive sign indicates a positive
200
effect between an increase in the pH and the percentage of copper adsorbed.
201
202
Figure 7. Pareto chart diagram.
203
The mathematical model obtained for this design was:
Elimination (%) = 37.52 - 3.553·[Cu(II)] + 34.595·pH + 8.183·[AC] - 3.553·[Cu(II)]·pH +
205
1.33·[Cu(II)]·[AC] + 8.183·pH·[AC] (Eq. 2)
206
207
where R2 were 96.81.
208
Figure 8 shows the response surface as a function of two factor keeping the other factor at
209
certain level, this is the best way to evaluate the relationship between the factor and response [40].
210
The graph a), shows an increases in Cu2+ adsorption with the increases of the pH, this rise looks like
211
slightly higher for the lower copper concentration. In the case of pH and AC concentration, graph b),
212
the behavior is similar an increases in the pH arise the copper removal percentage, this effect is more
213
remarkable for the higher level of AC concentration.
214
215
216
217
Figure 8. Response surface plot for cupper metal removal (%). a) Cu concentration-pH effect; b) pH-AC
218
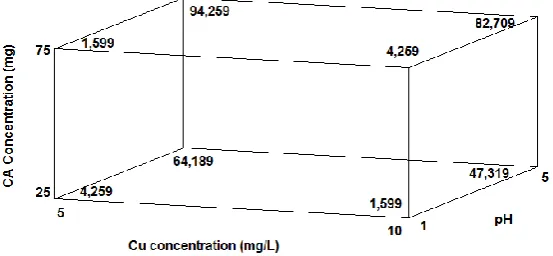
concentration; c) Cu concentration-AC concentration.
Figure 9 shows the cube graph to the copper removal percentage, the optimum recovery
220
percentage of Cu(II) obtained with the model is 94.26% according to the conditions A: Cu
221
Concentration of 5 mg·L-1, B: pH 5 and C: AC dosage 75 mg.
222
223
Figure 9. The cube graph of copper removal percentage.
224
3. Materials and Methods
225
3.1. Obtention of the activated carbon
226
Activated carbon (AC) from a winemaking waste, bagasse, were obtained as described [10,18]:
227
an aqueous suspension of bagasse waste (75 g·L-1) of the production of Albariño wine
228
(Denomination of Origin 'Rías Baixas', Galicia) and supplied by the Misión Biológica de Galicia
229
(CSIC), was introduced into a Berghof BR300 high pressure reactor at 523 K and 30 bars for 3 h. The
230
obtained mixture was filtered to separate the generated hydrothermal carbon (HTC), which was
231
dried. A mixture HTC/KOH (weight ratio 1:2) was introduced at 1073 K for 2 h in a Carbolite STF 15
232
tubular furnace under a N2 atmosphere (150 mL·min-1) in order to generated the AC. After cooling
233
down to room temperature, the AC was washed with MilliQ water until pH~5. Finally, the AC was
234
dried at 353 K.
235
3.2. Characterization of the activated carbon
236
Zeta potential measurements were carried out using a Zetasizer Malvern Nano ZS (Malvern
237
Panalytical Ltd., Worcestershire, UK) at 298 K. Aqueous suspensions were prepared between the pH
238
range of 1 and 7 using HCl 0.1 M. All solutions were dispersed with a sonicator Bandelin Electronic
239
Sonopuls HD 3100, (Bandelin electronic GmbH & Co. KG, Berlin, Germany) with amplitude of 80%
240
for 300 s.
241
The porous structure of the activated carbon was characterized by N2 adsorption at 77 K using
242
the Micromeritics ASAP, 2020 Accelerated Surface Area and Porosimetry System. The sample was
243
partially degassed at 623 K for 16 h. The specific surface was determined by analyzing the
244
adsorption isotherm via the BET equation and DFT models, employing Micromeritics and
245
Quantachrome software. The obtained results exhibit that the microporous surface (Smi) of the AC
246
was 1111 m2·g-1 and the SBET 2662 m2·g-1. In addition, the size of the pores were <2 nm (Average
247
micropore size, Lo = 1.71). So, the AC show a microporous structure indicating that the material is
248
suitable for metal adsorption.
249
3.3. Batch adsorption experiments
250
The metal adsorption by the activated carbon was carried out via batch experiments performed
251
in Erlenmeyer flasks. The control of the temperature was performed using a Selecta Termotronic
252
thermostat-controlled bath equipped with multiple Lab Companion MS-52M stirrers until
253
equilibrium was reached. The stirring speed was constant for all adsorption experiment at 500
revolutions per minute (rpm). 1 mL of sample were collected at 0, 5, 10, 20, 30, 40, 50, 60, 120 and 180
255
min and filtered through a syringe filters with a 0.22 µ m pore and 13 mm diameter.
256
Copper content in the solution was analyzed by AAS spectrometry and the copper content in
257
the carbon was estimated by the mass balance. The pH of the solutions was adjusted using a pH
258
meter and adding HCl (0.1 M). The adsorption capacity (qe (mg·g-1)) was calculated by following
259
equations:
260
261
𝑞
𝑒=
(𝐶0−𝐶𝑒)·𝑉𝑚 (Eq. 3)
262
263
where C0 (mg·L-1) is the initial concentration of copper in solution, Ce (mg·L-1) is the copper
264
concentration at equilibrium, qe (mg·g-1) is the amount of copper adsorbed on the activated carbon at
265
equilibrium, V (L) is the volume of the solution and m (g) is the mass of the activated carbon.
266
The equilibrium adsorption isotherm data were plotted using the Langmuir, Freundlich and
267
Temkin linear forms models [41]:
268
269
Langmuir: Ce
qe=
1 qm·b+
1
qm· ce (Eq. 4)
270
Freundlich: ln qe= ln KF+ 1
n· ln Ce (Eq. 5)
271
Temkin: qe= 𝐵 · ln AT+ B · ln ce (Eq. 6)
272
273
where qe (mg·g-1) is adsorbed metal amount by mass of activated carbon in the equilibrium; KF (L·g-1)
274
is the Freundlich constant; 1/n is indicative of the intensity of adsorption; qm (mg·g-1) is the
275
maximum adsorption capacity of the adsorbent per unit mass of adsorbate; b (L·mg-1) is the
276
Langmuir constant related with the adsorption energy; Ce (mg·L-1) is the metal concentration in the
277
equilibrium; AT Temkin isotherm equilibrium binding constant (L·g-1); B (R·T/bT) constant related to
278
heat of sorption (J·mol-1); bT Temkin isotherm constant; R universal gas constant (8.314·103
279
kJ·K-1·mol-1) and RL is the adimensional Langmuir constant or the equilibrium parameter and
280
indicates if the isotherm is reversible (RL=0), favorable (0<RL<1), lineal (RL=1) or unfavorable (RL>1)
281
where RL=1/(1+b·Co).
282
The Batch kinetics experiments for copper adsorption on AC were carried out at different
283
temperatures and were analyzed using the pseudo-first and pseudo-second order kinetics models:
284
285
pseudo-first order: ln(qe− qt) = ln qe− K1· t (Eq. 7) [42]
286
287
pseudo-second order: qt
t=
1 K2·qe2+
1
qe· t (Eq. 8) [43]
288
289
where qt (mg·g-1) is the adsorbed metal amount per mass of the activated carbon at different contact
290
time (t) and at equilibrium qe (mg·g-1); K1 (L·min-1) and K2 (g·min·mg-1) are the first and second order
291
adsorption constant, respectively.
292
Thermal parameters were calculated from (Eq. 9) and (Eq. 10). Enthalpy change (ΔH0) and
293
entropy change (ΔS0) were calculated from slope and intercept of a plot of log (qe/ce) versus 1/T
294
according (Eq. 9) [44]:
295
296
log𝑞𝑒
𝑐𝑒=
∆𝑆0 2.303𝑅+
∆𝐻0
2.303𝑅𝑇 (Eq. 9)
297
298
∆𝐺0= ∆𝐻0− 𝑇∆𝑆0 (Eq. 10)
299
300
where R is the universal gas constant (8.314 J·mol-1·K-1); T the absolute temperature (K).
The rate law that govern the copper adsorption by the activated carbon were assessed. Three
302
possible adsorption mechanisms have been evaluated: the diffusion of Cu species from the aqueous
303
solution to the AC surface (Eq. 11) [45], the diffusion of ions within the AC (Eq. 12) [46] and the
304
moving boundary process (Eq. 13) [47]:
305
306
film-diffusion controlled mechanism: 𝑙𝑛(1 − 𝐹) = −𝑘 · 𝑡 (Eq. 11)
307
particle-diffusion controlled mechanism: 𝑙𝑛(1 − 𝐹2) = −𝑘 · 𝑡 (Eq. 12)
308
moving boundary mechanism: 3 − 3 · (1 − 𝐹)23− 2 · 𝐹 = 𝑘 · 𝑡 (Eq. 13)
309
310
where k is the corresponding constant and F is defined to (Eq. 14):
311
312
𝐹 =[𝐴𝑀]𝑡
[𝐴𝑀]𝑒 (Eq. 14)
313
314
where [AM]t and [AM]e are the concentrations of metal adsorbed after a time (t) and in equilibrium
315
(e), respectively.
316
The surface of the AC and the AC loaded with Cu (AC-Cu) was examined by field emission
317
scanning electron microscope (FE-SEM) using a JEOL JSM 7600 microscope and X-ray photoelectron
318
spectroscopy (XPS). Spectra were recorded using a Fisons MT500 spectrometer equipped with a
319
hemispherical electron analyzer (CLAM2) and a non-monochromatic Mg K X-Ray source operated
320
at 300 W. Spectra were collected at a pass energy of 20 eV (typical for high-resolution conditions).
321
The area under each peak was calculated after subtraction of the S-shaped background and fitting
322
the experimental curve to a combination of Lorentzian and Gaussian lines of variable proportions.
323
Binding energies were calibrated to the C 1s peak at 285.0 eV. The atomic ratios were computed from
324
the peak intensity ratios and reported atomic sensitivity factors.
325
The structural characterization was carried out through X-ray diffraction (XRD) using a
326
Siemens D5000 diffractometer equipped with a Cu anode (Cu K radiation) and a LiF
327
monochromator.
328
3.4. Experimental design
329
In order to estimate the major effect and higher-order interaction a full factorial 2k design was
330
used. Three parameters and two levels for each parameter were analyzed 23. Where the three factors
331
pH, metal concentration and AC amount were selected as independent variables and the response
332
variable was the Cu(II) removal percentage. The independent variables were varied at two levels,
333
upper and lower limits for each one. Area total of 10 experiments were carried out 23=8 and 2 central
334
point. The experiments were done at 500 rpm and room temperature. The design of experiment was
335
constructed and analyzed using Statgraphics centrurion XVI version, 13.2.04. The significant factor
336
where studied according to Pareto charts and analysis of variance (ANOVA) testing at 95%
337
confidence.
338
4. Conclusions
339
Activated carbon from winemaking wastes was used to copper removed in aqueous solutions.
340
In addition, competitive adsorption with other metal was also investigated. Different parameters
341
which affect to the metal adsorption were assessed. Kinetic studies show that the Cu adsorption is
342
better adjusted to a second-order kinetic. The experimental results fit a Langmuir isotherm.
343
Thermodynamic studies have shown that the copper adsorption is an exothermic, spontaneous and
344
favorable process. Also, the law that govern the adsorption was the moving boundary process. In
345
addition, it is possible the recovery of zero valent copper from the eluates, thought this step must be
346
investigated more deeply. The full factorial experimental design showed that the pH and the pH-AC
347
dosage interaction have a great effect in the Cu removed process. The optimal conditions obtained
348
by the design of the experiments was 5 mg·L-1 Cu concentration, pH 5 and 10 mg AC dosage.
Therefore, the active carbon obtained from winemaking wastes is useful for Cu2+ removal from
350
wastewater.
351
352
353
Author Contributions: For research articles with several authors, a short paragraph specifying their individual
354
contributions must be provided. The following statements should be used “conceptualization, F.J.A. and F.A.L.;
355
methodology, L.A. and F.A.L.; validation, F.J.A. and F.A.L. formal analysis, I.G.-D.; investigation, L.A., F.A.L.
356
and F.J.A.; resources, F.A.L.; writing—original draft preparation, L.A. and F.J.A.; writing—review and editing,
357
L.A. and F.A.L.
358
Funding: “This research was funded by ESTANNIO Programme, grant number RTC-2017-6629-5 (Spanish
359
Ministry of Science, Innovation and Universities”. We acknowledge support of the publication fee by the CSIC
360
Open Access Publication Support. Initiative through its Unit of Information Resources for Research (URICI).
361
362
Acknowledgments: The authors would like the Dr. Irene Llorente (CENIM-CSIC) for performing the XPS
363
measurements.
364
Conflicts of Interest: The authors declare no conflict of interest.
365
366
367
368
References
369
1. Demiral, H.; Güngör, C. Adsorption of copper(II) from aqueous solutions on activated carbon prepared
370
from grape bagasse. J. Clean. Prod. 2016, 124, 103–113.
371
2. Aydın, H.; Bulut, Y.; Yerlikaya, Ç. Removal of copper (II) from aqueous solution by adsorption onto
372
low-cost adsorbents. J. Environ. Manage. 2008, 87, 37–45.
373
3. Feng, N.; Guo, X.; Liang, S. Adsorption study of copper (II) by chemically modified orange peel. J.
374
Hazard. Mater. 2009, 164, 1286–1292.
375
4. Sudha Rani, K.; Srinivas, B.; Gourunaidu, K.; Ramesh, K. V. Removal of copper by adsorption on
376
treated laterite. Mater. Today Proc. 2018, 5, 463–469.
377
5. Ferreira da Silva, A.J.; Paiva de Alencar Moura, M.C.; da Silva Santos, E.; Saraiva Pereira, J.E.; Lins de
378
Barros Neto, E. Copper removal using carnauba straw powder: Equilibrium, kinetics, and
379
thermodynamic studies. J. Environ. Chem. Eng. 2018, 6, 6828–6835.
380
6. Coudert, L.; Blais, J.-F.; Mercier, G.; Cooper, P.; Gastonguay, L.; Morris, P.; Janin, A.; Reynier, N.
381
Pilot-scale investigation of the robustness and efficiency of a copper-based treated wood wastes
382
recycling process. J. Hazard. Mater. 2013, 261, 277–285.
383
7. Ntimbani, R.N.; Simate, G.S.; Ndlovu, S. Removal of copper ions from dilute synthetic solution using
384
staple ion exchange fibres: Equilibrium and kinetic studies. J. Environ. Chem. Eng. 2015, 3, 1258–1266.
385
8. Kalaiselvi, G.; Maheswari, P.; Mohan, D.; Balasubramanian, S. Synthesis and characterization of poly
386
3-methyl 2-vinyl pyridinium nitrate incorporated polyvinylidine fluoride ultrafiltration membrane for
387
metal ion removal. Sep. Purif. Technol. 2015, 143, 105–114.
388
9. Carvalho Barros, G.K.G.; Melo, R.P.F.; Barros Neto, E.L. de Removal of copper ions using sodium
389
hexadecanoate by ionic flocculation. Sep. Purif. Technol. 2018, 200, 294–299.
390
10. Alcaraz, L.; López Fernández, A.; García-Díaz, I.; López, F.A. Preparation and characterization of
391
activated carbons from winemaking wastes and their adsorption of methylene blue. Adsorpt. Sci.
392
Technol. 2018, 36, 1331–1351.
393
11. Hu, Z.; Srinivasan, M.. Preparation of high-surface-area activated carbons from coconut shell.
394
Microporous Mesoporous Mater. 1999, 27, 11–18.
12. Liew, R.K.; Chai, C.; Yek, P.N.Y.; Phang, X.Y.; Chong, M.Y.; Nam, W.L.; Su, M.H.; Lam, W.H.; Ma, N.L.;
396
Lam, S.S. Innovative production of highly porous carbon for industrial effluent remediation via
397
microwave vacuum pyrolysis plus sodium-potassium hydroxide mixture activation. J. Clean. Prod. 2019,
398
208, 1436–1445.
399
13. Yek, P.N.Y.; Liew, R.K.; Osman, M.S.; Lee, C.L.; Chuah, J.H.; Park, Y.K.; Lam, S.S. Microwave steam
400
activation, an innovative pyrolysis approach to convert waste palm shell into highly microporous
401
activated carbon. J. Environ. Manage. 2019, 236, 245–253.
402
14. Pallarés, J.; González-Cencerrado, A.; Arauzo, I. Production and characterization of activated carbon
403
from barley straw by physical activation with carbon dioxide and steam. Biomass and Bioenergy 2018,
404
115, 64–73.
405
15. Sajjadi, S.A.; Mohammadzadeh, A.; Tran, H.N.; Anastopoulos, I.; Dotto, G.L.; Lopičić, Z.R.; Sivamani,
406
S.; Rahmani-Sani, A.; Ivanets, A.; Hosseini-Bandegharaei, A. Efficient mercury removal from
407
wastewater by pistachio wood wastes-derived activated carbon prepared by chemical activation using
408
a novel activating agent. J. Environ. Manage. 2018, 223, 1001–1009.
409
16. Duan, X. Preparation of High Surface Area Activated Carbon from Coconut Shells Using Microwave
410
Heating. Bioresour. Technol. 2010, 101, 6163–6169.
411
17. Kaouah, F.; Boumaza, S.; Berrama, T.; Trari, M.; Bendjama, Z. Preparation and characterization of
412
activated carbon from wild olive cores (oleaster) by H3PO4 for the removal of Basic Red 46. J. Clean.
413
Prod. 2013, 54, 296–306.
414
18. Alguacil, F.J.; Alcaraz, L.; García-Díaz, I.; López, F.A. metals Removal of Pb 2+ in Wastewater via
415
Adsorption onto an Activated Carbon Produced from Winemaking Waste. 2018.
416
19. Burakov, A.E.; Galunin, E. V.; Burakova, I. V.; Kucherova, A.E.; Agarwal, S.; Tkachev, A.G.; Gupta, V.K.
417
Adsorption of heavy metals on conventional and nanostructured materials for wastewater treatment
418
purposes: A review. Ecotoxicol. Environ. Saf. 2018, 148, 702–712.
419
20. Madhavarao, M.; Ramesh, A.; Purnachandrarao, G.; Seshaiah, K. Removal of copper and cadmium
420
from the aqueous solutions by activated carbon derived from Ceiba pentandra hulls. J. Hazard. Mater.
421
2006, 129, 123–129.
422
21. Al-Homaidan, A.A.; Al-Houri, H.J.; Al-Hazzani, A.A.; Elgaaly, G.; Moubayed, N.M.S. Biosorption of
423
copper ions from aqueous solutions by Spirulina platensis biomass. Arab. J. Chem. 2014, 7, 57–62.
424
22. Deihimi, N.; Irannajad, M.; Rezai, B. Equilibrium and kinetic studies of ferricyanide adsorption from
425
aqueous solution by activated red mud. J. Environ. Manage. 2018, 227, 277–285.
426
23. Boparai, H.K.; Joseph, M.; O’Carroll, D.M. Kinetics and thermodynamics of cadmium ion removal by
427
adsorption onto nano zerovalent iron particles. J. Hazard. Mater. 2011, 186, 458–465.
428
24. Oh, J.-Y.; You, Y.-W.; Park, J.; Hong, J.-S.; Heo, I.; Lee, C.-H.; Suh, J.-K. Adsorption characteristics of
429
benzene on resin-based activated carbon under humid conditions. J. Ind. Eng. Chem. 2018.
430
25. Ko, T.J.; Her, E.K.; Shin, B.; Kim, H.Y.; Lee, K.R.; Hong, B.K.; Kim, S.H.; Oh, K.H.; Moon, M.W. Water
431
condensation behavior on the surface of a network of superhydrophobic carbon fibers with
432
high-aspect-ratio nanostructures. Carbon N. Y. 2012, 50, 5085–5092.
433
26. Farzana, R.; Rajarao, R.; Bhat, B.R.; Sahajwalla, V. Performance of an activated carbon supercapacitor
434
electrode synthesised from waste Compact Discs (CDs). J. Ind. Eng. Chem. 2018, 65, 387–396.
435
27. Choong, C.E.; Lee, G.; Jang, M.; Park, C.M.; Ibrahim, S. One step hydrothermal synthesis of magnesium
436
silicate impregnated palm shell waste activated carbon for copper ion removal. Metals (Basel). 2018, 8.
437
28. Li, B.; Luo, X.; Zhu, Y.; Wang, X. Immobilization of Cu(II) in KIT-6 supported Co3O4 and catalytic
performance for epoxidation of styrene. Appl. Surf. Sci. 2015, 359, 609–620.
439
29. Liu, L.; Li, W.; Xiong, Z.; Xia, D.; Yang, C.; Wang, W.; Sun, Y. Synergistic effect of iron and copper
440
oxides on the formation of persistent chlorinated aromatics in iron ore sintering based on in situ XPS
441
analysis. J. Hazard. Mater. 2018.
442
30. Espinós, J.P.; Morales, J.; Barranco, A.; Caballero, A.; Holgado, J.P.; González-Elipe, A.R. Interface
443
Effects for Cu, CuO, and Cu2O Deposited on SiO2 and ZrO2 . XPS Determination of the Valence State of
444
Copper in Cu/SiO2 and Cu/ZrO2 Catalysts. J. Phys. Chem. B 2002, 106, 6921–6929.
445
31. Chanquía, C.M.; Sapag, K.; Rodríguez-Castellón, E.; Herrero, E.R.; Eimer, G.A. Nature and Location of
446
Copper Nanospecies in Mesoporous Molecular Sieves. J. Phys. Chem. C 2010, 114, 1481–1490.
447
32. Wei, W. Controllable Synthesis and Catalytic Property of Novel Copper Oxides (CuO and
448
Cu<sub>2</sub>O) Nanostructures. Int. J. Mater. Sci. Appl. 2016, 5, 18.
449
33. Won, Y.H.; Stanciu, L.A. Cu2O and Au/Cu2O particles: Surface properties and applications in glucose
450
sensing. Sensors (Switzerland) 2012, 12, 13019–13033.
451
34. Krys, P.; Testa, F.; Trochimczuk, A.; Pin, C.; Taulemesse, J.M.; Vincent, T.; Guibal, E. Encapsulation of
452
ammonium molybdophosphate and zirconium phosphate in alginate matrix for the sorption of
453
rubidium(I). J. Colloid Interface Sci. 2013, 409, 141–150.
454
35. Qiu, H.; Zhang, Q.; Lv, L.; Pan, B.; Zhang, W.; Zhang, Q. Critical review in adsorption kinetic models. J.
455
Zhejiang Univ. A 2009, 10, 716–724.
456
36. Ghaedi, A.M.; Panahimehr, M.; Nejad, A.R.S.; Hosseini, S.J.; Vafaei, A.; Baneshi, M.M. Factorial
457
experimental design for the optimization of highly selective adsorption removal of lead and copper
458
ions using metal organic framework MOF-2 (Cd). J. Mol. Liq. 2018, 272, 15–26.
459
37. Maneechakr, P.; Samerjit, J.; Uppakarnrod, S.; Karnjanakom, S. Experimental design and kinetic study
460
of ultrasonic assisted transesterification of waste cooking oil over sulfonated carbon catalyst derived
461
from cyclodextrin. J. Ind. Eng. Chem. 2015, 32, 128–136.
462
38. Saleh, T.A.; Adio, S.O.; Asif, M.; Dafalla, H. Statistical analysis of phenols adsorption on
463
diethylenetriamine-modified activated carbon. J. Clean. Prod. 2018, 182, 960–968.
464
39. Adio, S.O.; Omar, M.H.; Asif, M.; Saleh, T.A. Arsenic and selenium removal from water using
465
biosynthesized nanoscale zero-valent iron: A factorial design analysis. Process Saf. Environ. Prot. 2017,
466
107, 518–527.
467
40. Mourabet, M.; El Rhilassi, A.; El Boujaady, H.; Bennani-Ziatni, M.; El Hamri, R.; Taitai, A. Removal of
468
fluoride from aqueous solution by adsorption on Apatitic tricalcium phosphate using Box–Behnken
469
design and desirability function. Appl. Surf. Sci. 2012, 258, 4402–4410.
470
41. Aljeboree, A.M.; Alshirifi, A.N.; Alkaim, A.F. Kinetics and equilibrium study for the adsorption of
471
textile dyes on coconut shell activated carbon. Arab. J. Chem. 2017, 10, S3381–S3393.
472
42. S. Lagergren Zur Theorie der sogenannten Adsorption gelöster Stoffe. Handlingar 1898, 24, 1–39.
473
43. Ho, Y..; McKay, G. Pseudo-second order model for sorption processes. Process Biochem. 1999, 34, 451–
474
465.
475
44. Fouodjouo, M.; Fotouo-Nkaffo, H.; Laminsi, S.; Cassini, F.A.; de Brito-Benetoli, L.O.; Debacher, N.A.
476
Adsorption of copper (II) onto cameroonian clay modified by non-thermal plasma: Characterization,
477
chemical equilibrium and thermodynamic studies. Appl. Clay Sci. 2017, 142, 136–144.
478
45. Chiarizia, R.; Horwitz, E.P.; Alexandratos, S.D. Uptake of metal ions by a new chalating ion-exchange
479
resin. Part 4: Kinetics. Solvent Extr. Ion Exch. 1994, 12, 211–237.
480
46. Saha, B.; Iglesias, M.; Dimming, I.W.; Streat, M. Sorption of trace heavy metals by thiol containing
chelating resins. Solvent Extr. Ion Exch. 2000, 18, 133–167.
482
47. Chanda, M.; Rempel, G.L. Quaternized Poly(4-vinylpyridine) Gel-Coated on Silica.Fast Kinetics of
483
Diffusion-Controlled Sorption of Organic Sulfonates. Ind. Eng. Chem. Res. 1994, 33, 623–630.
484
485
Sample Availability: Not available.


![trans Dichloridobis{dicyclohexyl[4 (dimethylamino)phenyl]phosphane κP}platinum(II) dichloromethane disolvate](data:image/gif;base64,R0lGODlhAQABAIAAAP///wAAACH5BAEAAAAALAAAAAABAAEAAAICRAEAOw==)