Hippocampal
1
H-MRSI correlates
with severity of depression symptoms
in temporal lobe epilepsy
F.G. Gilliam, MD, MPH; B.M. Maton, MD; R.C. Martin, PhD; S.M. Sawrie, PhD; R.E. Faught, MD;
J.W. Hugg, PhD; M. Viikinsalo, BS; and R.I. Kuzniecky, MD
Abstract—Objective:
To investigate the association of an indicator of hippocampal function with severity of depression
symptoms in temporal lobe epilepsy.
Methods:
We evaluated 31 patients with video/EEG-confirmed temporal lobe epilepsy
using creatine/
N
-acetylaspartate ratio maps derived from a previously validated
1H magnetic resonance spectroscopic
imaging (
1H-MRSI) technique at 4.1 T. We also assessed depression symptoms, epilepsy-related factors, and self-perceived
social and vocational disability. We used conservative nonparametric bivariate procedures to determine the correlation of
severity of depression symptoms with imaging and clinical variables.
Results:
The extent of hippocampal
1H-MRSI
abnormalities correlated with severity of depression (Spearman rho
⫽
0.65,
p
value
⬍
0.001), but other clinical factors did
not.
Conclusion:
The extent of hippocampal dysfunction is associated with depression symptoms in temporal lobe epilepsy
and may be a more important factor than seizure frequency or degree of disability.
NEUROLOGY 2007;68:364–368
Depression is a common comorbid condition in many
neurologic disorders and appears to have an
in-creased prevalence in community
1and tertiary
2sam-ples of persons with epilepsy. Depression contributes
to poor health outcomes
2-5and increased health care
costs in epilepsy.
6,7Although few studies have
evalu-ated the association of depression with specific
epi-lepsy
syndromes,
temporal
lobe
epilepsy
is
frequently implicated.
3Involvement of the limbic
8-10or ventral prefrontal
11,12structures is a possible
ex-planation of the increased prevalence of depression
in temporal lobe epilepsy, but the influence of
re-gional brain dysfunction as opposed to social and
psychological factors is not known.
13To evaluate the
contribution of potential neuronal and psychosocial
factors to depression in temporal lobe epilepsy, we
determined the association of severity of depression
symptoms with the extent of
1H magnetic resonance
spectroscopic imaging (
1H-MRSI) hippocampal
ab-normalities, clinical variables, and self-perceived
disability.
Methods.
Patients.
We studied a sample of adult patients who
met the following criteria: 1) having had a diagnosis of temporal
lobe epilepsy confirmed by recorded seizures during video/EEG
monitoring, 2) capable of completing self-report questionnaires, 3)
agreeing with and signing an informed consent document
ap-proved by our institutional review board (IRB), and 6) age 17
years or older. This lower age limit was used because the mood
and health outcome variables had not been tested for reliability
and validity in children and adolescents. Study questionnaires
were administered by the study coordinator (M.V.) and were
com-pleted by patients in a private setting, usually in the outpatient
neurology clinic.
Magnetic resonance spectroscopic imaging acquisition and
analysis.
All adult patients undergoing presurgical evaluation
for refractory temporal lobe epilepsy at the University of Alabama
at Birmingham during the study period were offered
1H-MRSI
through a National Institute of Neurologic Disorders and Stroke–
supported protocol (NS033919).
14Details of the imaging protocol
and examples of subject
1H-MRSI maps can be found in earlier
publications.
14-17The subjects in the current study were a
conve-nience sample who agreed to undergo
1H-MRSI and were able to
obtain transportation at a time when the MR scanner was
avail-able. Briefly, all studies were performed in the interictal state,
using a 4.1-T whole-body imaging/spectroscopy system and a
quadrature-driven, tunable, matchable head coil. Sagittal and
transverse scout images were acquired using inversion recovery
gradient echo sequence (TR [repetition time]/inversion recovery
time [TIR]/echo time [TE] 2,500/1,000/15). The transverse
im-ages were angulated to be parallel to the long axis of the
hip-pocampi and used to select a rectangular region of interest
(ROI) in the temporal lobes that included both hippocampal
regions. Water- and lipid-suppressed spectroscopic images were
acquired using a TR of 2,000, TE of 50 msec, a field of view of
240
⫻
240 mm, and 32
⫻
32 phase encodes with a slice
thick-ness of 1 cm. Nominal voxed size was 0.5 cc. Scanning was not
performed in the immediate postictal state.
Data from the subjects’
1H-MRSI were analyzed by a MR
phys-icist (J.H.) without knowledge of the clinical, mood, or EEG data.
The creatine (Cr)/
N
-acetylaspartate (NAA) metabolite ratio maps
were produced by automated NMR1 (Tripos, Syracuse, NY) fitting
of spectra. The normal hippocampal Cr/NAA value acquired in 20
normal healthy volunteers was 0.72
⫾
0.14. Approximately five to
six pixels were placed along the length of the hippocampus and
two to three across the width. We compared the Cr/NAA ratio in
From the Department of Neurology (F.G.G.), Columbia University, New York, NY; Department of Neurology (R.C.M., S.M.S., R.E.F., M.V.), University of Alabama at Birmingham; Department of Neurology (R.I.K.), New York University, New York, NY; GE Global Research Center (J.W.H.), Niskayuna, NY; The Brain Institute (B.M.M.), Miami Children’s Hospital, Miami, FL.
Supported by National Institutes of Health grants NS01794, NS033919, NS40808, NS047551, and a grant from the Epilepsy Foundation of America. Disclosure: The authors report no conflicts of interest.
Received December 12, 2005. Accepted in final form October 9, 2006.
every voxel within the hippocampi, and those that were 2 SDs
higher than normal were tagged as abnormal. The extent of
ab-normal voxels is a surface measurement (square millimeters),
ex-cluding voxels containing the cerebellar vermis, using software
developed by our group.
15An individual patient ratio map image is
presented in figure 1.
Clinical and mood assessments.
All mood, seizure, clinical,
and social and vocational disability assessments were
per-formed as part of a protocol supported by the National Institute
of Neurological Disorders and Stroke (NS001794), and
ap-proved by our IRB.
18Onset of epilepsy was defined as the age at
the second unprovoked, nonfebrile seizure. For the purpose of
the logistic regression analysis, employment was defined as
working for a salary more than 20 hours per week; homemakers
and students were also included in this category. Education
was classified as years in a formal educational program of any
type.
We used the method of seizure classification recommended by
the International League Against Epilepsy.
19Subjects used
monthly calendars to record seizure occurrences. After each type
of seizure was identified and classified through interviews by the
epileptologists, a letter was used to designate each seizure type
(i.e., simple partial, complex partial, or generalized tonic-clonic)
for the patient calendars. The seizure variable was coded and
analyzed as a continuous variable based on the number of each
seizure type per month.
The Work/Driving/Social scale of the Quality of Life in
Epi-lepsy Inventory-89 (QOLIE-89) was designed to assess the
nega-tive impact of vocational disability, driving restrictions, and social
isolation from the patients’ perspective. The test-retest reliability
was 0.86 and Cronbach’s
␣
was also 0.86 for the scale, as defined
in a large (n
⫽
304), prospective multicenter study of
psychomet-ric characteristics.
20Factor analysis of the 18 subscales showed
that the Work/Driving/Social scale was one of four scales in the
epilepsy-targeted composite factor, as opposed to mental health,
cognition, or physical health factors. The scale score ranges from 0
to 100, with higher scores indicating better self-perceived
functioning.
Mood status was determined by the Depression scale of the
Profile of Mood States (POMS). The POMS is a checklist of
adjec-tives describing six mood conditions. The instrument has
under-gone extensive reliability and validity testing in a variety of
samples of patients with chronic illness and healthy subjects
21,22and including previous studies of epilepsy patients.
18,23-25The
de-pression subscale has been validated through extensive
psycho-metric testing and is scored 5-point Likert scale for which higher
values indicate greater mood disturbance.
21-23Statistical analysis.
We used Spearman
rho
correlations to
determine the bivariate association of the
1H-MRSI variable and
each clinical variable with the POMS Depression scale. After
Bon-ferroni adjustment for multiple comparisons in the bivariate
anal-yses, significance was set at
p
⬍
0.01. We also applied linear
regression analysis to evaluate the independent associations of
the predictive variables with severity of depression symptoms. All
analyses were performed using SPSS version 10.0 (www.SPSS.
com; Chicago, IL).
Results.
Patient characteristics.
Demographic and
sei-zure characteristics of the 31 subjects are shown in table 1.
All subjects had at least one complex partial or generalized
tonic-clonic seizure in the previous 3 months at the time of
evaluation. Ten (32%) patients were on one antiepileptic
medication, 17 (55%) were on two medications, and four
(13%) were on three medications.
Correlation of depressive symptoms,
1H-MRSI, and
clin-ical variables.
The scatterplot comparing POMS
De-pression scale scores with the extent of the abnormal
1
H-MRSI Cr/NAA ratio maps is shown in figure 2. The
results of bivariate nonparametric correlation analyses
are presented in table 2. No association with laterality
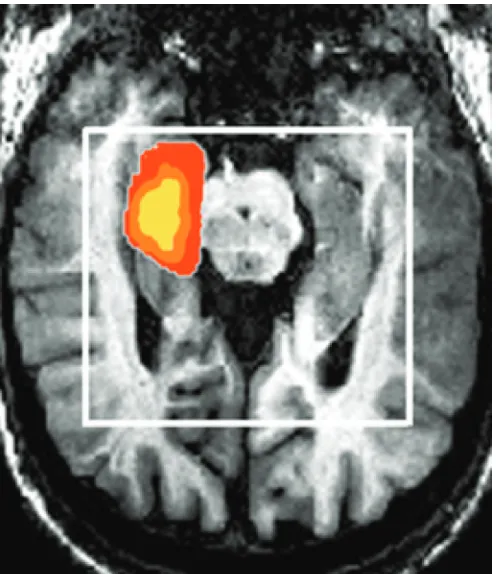
Figure 1. An example of a
1H magnetic resonance
spectro-scopic imaging ratio map in a patient with mesial
tempo-ral lobe epilepsy. The map of the region of abnormality
was determined by inclusion of all voxels within the
hip-pocampi that had an abnormal creatine/N-acetylaspartate
ratio defined as
⬎
2 SDs beyond normal. The degree of
ele-vation of Cr/NA is color coded and corresponds to the
ab-normal ratios; values of 1.3 to 1.6 by increments of 0.1.
Table 1
Demographic and clinical characteristics of the study
sample of patients with video/EEG confirmed temporal lobe
epilepsy
Clinical characteristics (n
⫽
31)
Gender, F/M, %
55/45
Race (white/black/other), %
90/10/0
Mean (SD) age, y, at evaluation, y
35.4 (10.8)
Mean (SD) age at epilepsy onset, y
15.0 (12.0)
Mean (SD) years of education
13.1 (2.1)
Employment
Employed (
⬎
20 hr/wk, includes
homemaker or student), no. (%)
15 (49)
Unemployed (0–20 hr/wk), no. (%)
16 (51)
No. (%) of antiepileptic drugs
1
10 (33)
2
17 (55)
3
4 (12)
Mean (SD) no. of seizures/mo
14.7 (17.0)
Patients with simple partial
seizures, no. (%)
15 (48)
Patients with complex partial
seizures, no. (%)
27 (87.5)
Patients with generalized
tonic-clonic seizures, no. (%)
of
1H-MRSI results and depression symptoms was found,
but the study was not powered to determine less than a
strong association. The extent of
1H-MRSI abnormality
(Spearman rho
⫽
0.65;
p
⬍
0.001), but no other
vari-ables, was significantly associated with the POMS
De-pression
scale
scores.
Linear
regression
analysis
confirmed the independent association of
1H-MRSI
re-sults (
 ⫽
0.63;
p
⬍
0.001) with POMS Depression scale
scores, and the absence of association with other seizure
or self-perceived disability variables. The model
ex-plained 57% of the variance (adjusted R
2⫽
0.57) in the
depression symptoms.
Discussion.
The hippocampus is a critical
compo-nent of the temporolimbic-frontal-subcortical
net-work involved in major depressive disorders.
26,27Although hippocampal dysfunction in temporal lobe
epilepsy might be anticipated to be associated with
depression, few clinical studies have directly
sup-ported this plausible relationship. Depression
symp-toms are reported to be greater in temporal lobe
epilepsy patients with MRI-identified mesial
tempo-ral sclerosis vs those with normal hippocampi,
inde-pendent of lateralization,
10but correlation of volume
reduction with severity of depression symptoms was
not determined. One previous study
9observed that
reduced hippocampal serotonin 1A receptor binding
correlated with elevated depression scores, but
an-other
12found association only with the cingulate
gy-rus using a similar ligand; these differences may be
explained by dissimilar analytic techniques and
partial-volume effects. Two earlier investigations
8,11using
18F-fluorodeoxyglucose (FDG)-PET scans in
temporal lobe epilepsy did not demonstrate an
asso-ciation of depression with glucose metabolism
defi-cits within the hippocampi.
We found a significant correlation of severity of
depression symptoms with extent of voxels
contain-ing an abnormal Cr/NAA ratio in the hippocampi of
persons with temporal lobe epilepsy. To our
knowl-edge, this is the first description of a correlation of
severity of depression symptoms with spatial
in-volvement of a biomarker of neuronal dysfunction
within a limbic structure. The strength of this
corre-lation may be in part due to the high signal-to-noise
ratio provided by the 4.1-T magnet, which allows
smaller voxel size and precise identification of
hip-pocampal gray matter to minimize partial-volume
ef-fects.
28Also, compared to other methods of metabolic
imaging, NAA may be more closely associated with
the mechanisms of hippocampal dysfunction that
contribute to limbic system– dependent mood
distur-bance. However, we could not identify other studies
of hippocampal NAA using
1H-MRSI in unipolar
de-pression to further support this supposition.
29-31Be-cause sampling of
1H-MRSI was limited to the
temporal lobes in our study, correlation of
dysfunc-tion in other brain regions with depression
symp-toms cannot be determined; involvement of other
components of the limbic-frontal-subcortical network
in temporal lobe epilepsy remains a plausible
hypothesis.
The discrepancy of our
1H-MRSI findings with the
previous reports of the lack of association of
FDG-PET results with depression in temporal lobe
epi-lepsy may be of relevance for understanding clinical
correlates of metabolic deficits in the hippocampus.
In a detailed comparison of
1H-MRSI to FDG-PET in
temporal lobe epilepsy, hippocampal Cr/NAA
mea-sures did not correlate with glucose metabolism;
in-dicating that alterations in glucose uptake and NAA
concentrations represent different mechanisms of
cellular metabolic dysfunction.
28Rate of brain
glu-cose metabolism is largely dependent on pyramidal
neuron activation and subsequent glutamate release,
and recent studies indicate that glucose utilization is
directly related to glia uptake of glutamate
32The
wide variability of hippocampal neuron/glia ratios
commonly described in temporal lobe epilepsy
17may
explain previous observations of extremes of
interic-tal hyper- and hypometabolism in different regions
in mesial temporal sclerosis.
33This variability may
also explain the lack of correlation of hippocampal
Figure 2. Correlation of severity of depression symptoms
with spatial extent of hippocampal dysfunction defined by
1H magnetic resonance spectroscopic imaging
creatine/N-acetylaspartate ratio maps (n
⫽
31).
Table 2
Spearman rho correlations of severity of depression
symptoms with clinical variables in 31 patients with temporal
lobe epilepsy
Variables
Spearman rho
p
1
H-MRSI
0.65
⬍
0.001
Duration of epilepsy
0.17
0.37
Work/driving/social scale*
⫺
0.23
0.22
GTC seizure rate
⫺
0.05
0.23
Gender
⫺
0.17
0.37
Complex partial seizure rate
⫺
0.12
0.52
No. of antiepileptic drugs
⫺
0.11
0.57
* From the Quality of Life in Epilepsy Inventory (QOLIE)-89.
1
H-MRSI
⫽
1H magnetic resonance spectroscopic imaging;
glucose metabolism with symptoms of depression.
Al-ternatively,
NAA
synthesis
is
dependent
on
mitochondrial
enzymes,
including
L-aspartate
N
-acetyltransferase, and coenzyme A, which may be
more sensitive to clinically significant limbic
dys-function in temporal lobe epilepsy than is
glucose-dependent basal energy maintenance. It should be
recognized that postictal effects of seizures and
chronic effects of antiepileptic drugs could confound
the results of imaging of metabolic variables in
epi-lepsy patients.
Previous investigations suggest that increased Cr/
NAA ratios in temporal lobe epilepsy are not due
solely to cell loss in the hippocampus.
17Atrophy is an
unlikely explanation of our findings because we
eval-uated the extent of abnormal Cr/NAA ratios in
vox-els within the hippocampi. Decreased NAA is
associated with cerebral regions of interictal spiking
and seizure onset,
34,35which in combination with our
results suggests the plausible hypothesis that
de-pression symptoms in temporal lobe epilepsy may be
due to the influence of hyperexcitable hippocampal
neurons on the limbic network.
The role of the hippocampus in depression is not
clearly defined, although recent investigations have
identified hippocampal abnormalities.
26Hippocam-pal volumes are found in most studies to be smaller
in neurologically normal patients with a history of
depression compared to euthymic controls.
27Results
of functional imaging studies, predominantly
FDG-PET, are less consistent in the hippocampus during
major depressive episodes, but the hippocampus has
been less thoroughly investigated than the amygdala
and ventromedial frontal cortex.
26,36Putative
mechanisms of injury include chronic exposure to
cellular stressors, including corticotropin-releasing
factor and cortisol. An investigation of 17 patients
receiving long-term corticosteroid therapy found
abnormal Cr/NAA ratios in the medial temporal
region as well as greater depression rating scores
vs normal controls; these findings suggest that
chronic exposure to elevated corticosteroid levels
could induce dysfunction in limbic structures and
subsequent depression.
37Additional data are
nec-essary to more fully understand the role of the
hippocampus in the genesis and maintenance of
clinical depression, especially in specific neurologic
disorders such as epilepsy.
References
1. Ettinger A, Reed M, Cramer J. Depression and comorbidity in community-based patients with epilepsy or asthma. Neurology 2004;63: 1008–1014.
2. Boylan LS, Flint LA, Labovitz DL, Jackson SC, Starner K, Devinsky O. Depression but not seizure frequency predicts quality of life in treatment-resistant epilepsy. Neurology 2004;62:258–261.
3. Wiegartz P, Seidenberg M, Woodard A, Gidal B, Hermann B. Co-morbid psychiatric disorder in chronic epilepsy: recognition and etiology of de-pression. Neurology 1999;53:S3–S8.
4. Gilliam F. Optimizing health outcomes in active epilepsy. Neurology 2002;58:S9–S19.
5. Gilliam FG, Barry JJ, Hermann BP, Meador KJ, Vahle V, Kanner AM. Rapid detection of major depression in epilepsy: a multicentre study. Lancet Neurol 2006;5:399–405.
6. Lee WC, Arcona S, Thomas SK, Wang Q, Hoffmann MS, Pashos CL. Effect of comorbidities on medical care use and cost among refractory patients with partial seizure disorder. Epilepsy Behav 2005;7:123– 126.
7. Cramer JA, Blum D, Fanning K, Reed M. The impact of comorbid depression on health resource utilization in a community sample of people with epilepsy. Epilepsy Behav 2004;5:337–342.
8. Victoroff JI, Benson F, Grafton ST, Engel J Jr, Mazziotta JC. Depres-sion in complex partial seizures. Electroencephalography and cerebral metabolic correlates. Arch Neurol 1994;51:155–163.
9. Giovacchini G, Toczek MT, Bonwetsch R, et al. 5-HT1A receptors are reduced in temporal lobe epilepsy after partial-volume correction. J Nucl Med 2005;46:1128–1135.
10. Quiske A, Helmstaedter C, Lux S, Elger CE. Depression in patients with temporal lobe epilepsy is related to mesial temporal sclerosis. Epilepsy Res 2000;39:121–125.
11. Bromfield EB, Altshuler L, Leiderman DB, et al. Cerebral metabolism and depression in patients with complex partial seizures [published erratum appears in Arch Neurol 1992;49:976]. Arch Neurol 1992;49: 617–623.
12. Savic I, Lindstrom P, Gulyas B, Halldin C, Andree B, Farde L. Limbic reductions of 5-HT1A receptor binding in human temporal lobe epi-lepsy. Neurology 2004;62:1343–1351.
13. Hermann BP, Trenerry MR, Colligan RC. Learned helplessness, attri-butional style, and depression in epilepsy. Bozeman Epilepsy Surgery Consortium. Epilepsia 1996;37:680–686.
14. Kuzniecky R, Hugg J, Hetherington H, et al. Predictive value of 1H MRSI for outcome in temporal lobectomy. Neurology 1999;53:694– 698.
15. Hugg JW, Kuzniecky RI, Gilliam FG, Morawetz RB, Fraught RE, Heth-erington HP. Normalization of contralateral metabolic function follow-ing temporal lobectomy demonstrated by 1H magnetic resonance spectroscopic imaging. Ann Neurol 1996;40:236–239.
16. Martin RC, Sawrie S, Hugg J, Gilliam F, Faught E, Kuzniecky R. Cognitive correlates of 1H MRSI-detected hippocampal abnormalities in temporal lobe epilepsy. Neurology 1999;53:2052–2058.
17. Kuzniecky R, Palmer C, Hugg J, et al. Magnetic resonance spectro-scopic imaging in temporal lobe epilepsy: neuronal dysfunction or cell loss? Arch Neurol 2001;58:2048–2053.
18. Gilliam F, Kuzniecky R, Meador K, et al. Patient-oriented outcome assessment after temporal lobectomy for refractory epilepsy. Neurology 1999;53:687–694.
19. Commission on the classification and terminology of the International League Against Epilepsy: a revised proposal for the classification of epilepsy and epileptic syndromes. Epilepsia 1989;30:268–278. 20. Devinsky O, Vickrey BG, Cramer J, et al. Development of the quality of
life in epilepsy inventory. Epilepsia 1995;36:1089–1104.
21. McNair DM, Lorr M, Droppleman LF. Manual: Profile of Mood States-Revised. San Diego, CA: Educational and Industrial Testing Service, 1992.
22. Grote CL, Kooker EK, Garron DC, Nyenhuis DL, Smith CA, Mattingly ML. Performance of compensation seeking and non-compensation seek-ing samples on the Victoria symptom validity test: cross-validation and extension of a standardization study. J Clin Exp Neuropsychol 2000;22: 709–719.
23. Griffith NM, Szaflarski JP, Szaflarski M, et al. Measuring depressive symptoms among treatment-resistant seizure disorder patients: POMS Depression Scale as an alternative to the BDI-II. Epilepsy Behav 2005; 7:266–272.
24. Pulliainen V, Kuikka P, Kalska H. Are negative mood states associated with cognitive function in newly diagnosed patients with epilepsy? Epi-lepsia 2000;41:421–425.
25. Sawrie SM, Martin RC, Kuzniecky R, et al. Subjective versus objective memory change after temporal lobe epilepsy surgery. Neurology 1999; 53:1511–1517.
26. Campbell S, Macqueen G. The role of the hippocampus in the patho-physiology of major depression. J Psychiatry Neurosci 2004;29:417–426. 27. Sheline YI. Neuroimaging studies of mood disorder effects on the brain.
Biol Psychiatry 2003;54:338–352.
28. Knowlton RC, Abou-Khalil B, Sawrie SM, Martin RC, Faught RE, Kuzniecky RI. In vivo hippocampal metabolic dysfunction in human temporal lobe epilepsy. Arch Neurol 2002;59:1882–1886.
29. Binesh N, Kumar A, Hwang S, Mintz J, Thomas MA .Neurochemistry of late-life major depression: a pilot two-dimensional MR spectroscopic study. J Magn Reson Imaging 2004;20:1039–1045.
30. Mervaala E, Fohr J, Kononen M, et al. Quantitative MRI of the hip-pocampus and amygdala in severe depression. Psychol Med 2000;30: 117–125.
31. Kato T, Inubushi T, Kato N. Magnetic resonance spectroscopy in affec-tive disorders. J Neuropsychiatry Clin Neurosci 1998;10:133–147. 32. Kasischke KA, Vishwasrao HD, Fisher PJ, Zipfel WR, Webb WW.
33. Rubin E, Dhawan V, Moeller JR, et al. Cerebral metabolic topography in unilateral temporal lobe epilepsy. Neurology 1995;45:2212–2223. 34. Shih JJ, Weisend MP, Lewine J, Sanders J, Dermon J, Lee R. Areas of
interictal spiking are associated with metabolic dysfunction in MRI-negative temporal lobe epilepsy. Epilepsia 2004;45:223–229.
35. Garcia PA, Laxer KD, van der Grond J, Hugg JW, Matson GB, Weiner MW. Correlation of seizure frequency with N-acetyl-aspartate levels
determined by 1H magnetic resonance spectroscopic imaging. Magn Reson Imaging 1997;15:475–478.
36. Parsey RV, Mann JJ. Applications of positron emission tomography in psychiatry. Semin Nucl Med 2003;33:129–135.
37. Brown ES J, Woolston D, Frol A, et al. Hippocampal volume, spectros-copy, cognition, and mood in patients receiving corticosteroid therapy. Biol Psychiatry 2004;55:538–545.
Neuro
Images
Reversible Kernohan notch
J.M. Oster, MD; H.R. Jones, Jr., MD; P. Hildenbrand, MD;
B. Tronic, MD; and G.R. Cosgrove, MD, FRCSC, Burlington, MA
A 55-year-old patient experienced episodic headaches, left
fa-cial twitching, and increasing falls over 2 years. Multiple yearly
brain MRs (figure 1, top panels) revealed a large right frontal
arachnoid cyst with evolving contralateral brainstem notching
against the left tentorium
1,2(tentorial arrows, figure 1, top
pan-els). The lesion was marsupialized into the Sylvian fissure.
Histol-ogy confirmed an arachnoid cyst (figure 2). Postoperatively, the
patient’s symptoms abated, remaining asymptomatic after 1 year.
MRI follow-up at 7 months demonstrated mild residual left
pedun-cle gliosis with resolution of the Kernohan notch (figure 1, bottom
panels).
Copyright © 2007 by AAN Enterprises, Inc.
1. Kernohan JW, Woltman HW. Incisura of the crus due to contralateral brain tumor. Arch Neurol Psychiatry 1929;21:274–287.
2. Maramattom BV, Wijdicks EFM. Uncal herniation. Arch Neurol 2005;62: 1932–1935.
Disclosure: The authors report no conflicts of interest.
Address correspondence and reprint requests to Dr. J.M. Oster, Depart-ment of Neurology, Lahey Clinic, 41 Mall Rd., Burlington, MA 01805; e-mail: [email protected]