Optimization of the output of a solar cell per theoretical and
experimental study of the models to one and two
exponential
I. Sari-Ali1, B. Chikh-Bled and B. Benyoucef
University of Abou Bakr Belkaïd, Faculty of Science, Unit of Search Materials and Energies Renewable (URMER), B.P 119, 13000 Tlemcen, Algeria
Abstract. The production of electricity based on the conversion of the sunlight by photovoltaic cells containing crystalline silicon is the way most used on the technological and industrial level Consequently, the development of the terrestrial applications for the energy production requires high-output cells and low cost.The aim of our work is to present a comparative study between both theoretical and experimental models of a solar cell based silicon type PHYWE (connecting four cells in series of 80 mm diameter) to improve photovoltaic performance.This study led to the determination of the parameters of the cell starting from the current-voltage characteristic, the influence of luminous flow on this characteristic as well as the effect of the incidental photons on the solar cell. We justify the interest to use the model with two exponential for the optimization of the output by underlining the insufficiency of the model to one exponential.
Keywords. Silicon,modeling, simulation, output, solar cell.
1 Introduction
The realization of solar cells containing crystalline silicon remains the most advanced die on the technological and industrial level. Indeed, silicon is one of the most abundant elements on ground in the form of silica, perfectly stable and not poison.
In the pure state, silicon is an intrinsic semiconductor, it is manufactured starting from sand, but it is also necessary to resort to chlorine to obtain pure ultra silicon which will be used primarily for manufacture of solar cells and of microchips with which industry in full expansion requires, it also, of the increasing quantities.
The model with exponential is most current and is used by many authors to obtain the values of certain elements by methods of approximation, a first representation will be given by this model (figure 3), where the exponential one represents the diffusion current with, ideally, a factor of quality equal to the unit.In experiments, for a good description, it is necessary to consider a factor of quality different from 1, then a more complete description will be obtained starting from the model with two exponential (figure 4), and for which the exponential ones separately represent the diffusion current and the current due to the recombination by centers of traps in the zone of space charge. The results so obtained will be confronted with those obtained by numerical methods of analysis.
1
e-mail : [email protected]
DOI: 10.1051/ C
The evaluation of the effectiveness of the two models makes it possible to select that which is most suitable.
A numerical program will be developed to determine the parameters of the solar cell (tension and current maxima, factor of form and output) and this for various solar flows [1].
2 Principle of operation of a photovoltaic cell containing silicon
The principle is represented by figure 1
Fig. 1. Principle of operation of a solar cell
With :
P: Doped semiconductor of type P covered with a doped very mean zone N J: Intermediate junction enters the two zones.
a: Metal plate covering the second face with the semiconductor, playing the role of anode PH: Luminous ray.
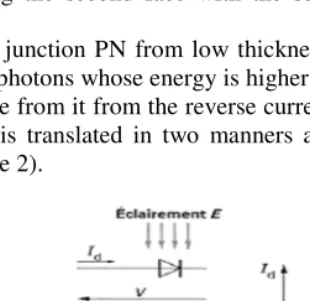
If it one subjects a junction PN from low thickness to a luminous flow, pairs electron-positron pair are created by the photons whose energy is higher than the prohibited bandwidth of material.
It results an increase from it from the reverse current of saturation proportional to luminous flow physically, this effect is translated in two manners according to the quadrant of operation of the following device (figure 2).
Fig. 2. Characteristics of a junction PN under illumination
- In the 4th quadrant, the system functions out of generator whose current of short-circuit is proportional to the illumination and whose no-load voltage is equal to that of the diode in direct polarization (0,5 to 0,8 V for If).
Under illumination, a photovoltaic cell behaves like a generator of power, characteristic Iv is described for an illumination and a temperature given by the following implicit equation [2]:
] 1 ) ) ( [exp( ] 1 ) ) ( [exp( 02
01 + − − + −
− + − = nKT I R V q I KT I R V q I R I R V I
I S S
Sh S
ph (1)
With:
n: the factor of quality of the diode,q: The charge of electrons ,K: Boltzmann constant ,T: The temperature ,Iph: The photocurrent , I: The electrical current ,V: The tension ,RS: Resistance series ,
RSh: Resistance Shunt.
3 Models with one and two exponential of the characteristic voltage of
a solar cell
A first representation is given by the model to exponential (SEM) which is illustrated by figure 3.This model is deduced starting from the theory from diffusion where the exponential one represents the diffusion current in the areas quasi-neutrals: the transmitter and the base.
Fig. 3. Circuit equivalent of the model with exponential under illumination
In experiments this model is corrected by the introduction of the factor of quality N, its mathematical expression is given by the following equation, with I02 = 0 :
(
)
− + − + − = 1 nKT I s R V q exp 01 I sh R I s R V ph I I (2)- A more complete description is obtained starting from the model with two exponential (DEM)
Fig. 4. Circuit are equivalent of the model to two exponential under illumination
The characteristic voltage of a solar cell for this model is described by the following equation [3]:
]
1
)
)
(
[exp(
]
1
)
)
(
[exp(
0201
+
−
−
+
−
−
+
−
=
nKT
I
R
V
q
I
KT
I
R
V
q
I
R
I
R
V
I
I
S SSh S
ph (3)
Where I01 is the current one of diffusion, and I02 the current due to the recombination by center of
4 Comparison of the experimental and theoretical results
To compare our results with those of the theory, we carried out in our laboratory of measurements on a solar cell of type "PHYWE" (connection of 4 cells in series in diameter 80 mm).
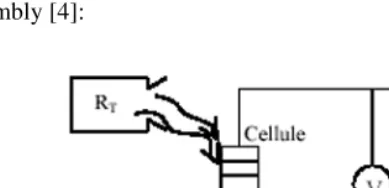
To measure the current and the tension induced by the cell according to the intensity of the light, one applies a load R at the boundaries of the photovoltaic cell exposed to the light (figure 5)
In order to analyze the pace of the characteristic voltage according to illumination, we carry out the following assembly [4]:
Fig. 5. Diagram of the assembly of the cell
We developed a program allowing to determine starting from experimental measurements the four parameters (I01, Rs, Rsh, Iph) defined by the equation characteristic of the solar cell.
4.1 Calculation of I01For various values of N of flow, we determine I01 by using the following
relations for the two models:
♦ Model with exponential : its expression is given by the following equation [5]:
(
)
∑ − =
N exp(wVcoN) 1 ccN I N
1 01
I (4)
♦ Model with two exponential: By fixing the current of I02 recombination, the calculation of the
current of I01 saturation is given by the following expression [6]:
1) ) coN (exp(wV Sh /R coN V 1) ) coN (exp(wV 1) /n) coN (exp(wV 02 I 1) ) coN (exp(wV ccN I 01 I − − − − − −
= (5)
4.2 Calculation of Rs and Rsh
Resistance serie Rs is obtained in the vicinity of Vco (resistance of significant load) while parallel
resistance Rsh is obtained in the vicinity of Icc (very low resistance of load). Their expressions are
given by the following equations [6]:
co V V exp I id I exp V id V co V V ∆I ∆V S R ≈ − − = ≈ = , cc I I exp I id I exp V id V co I I ∆I ∆V Sh R ≈ − − = ≈ =
(6)
Vexp and Iexp are respectively the experimental values of the tension and the current.
Vid and Iid are respectively the ideal values of tension and current correspondents in Vexp and Iexp.
They are obtained starting from the equation characteristic of the solar cell for the Rs= 0 and Rsh =∞.
Iid=Icc−I0
(
exp(wVexp)−1)
, + − = 1 0 I exp I cc I wlog id
4.3 Calculation of Iph
The photocurrent is in experiments given starting from the equation characteristic of the cell (for I=0 and V=Vco), its mathematical expression is given by:
(
)
sh R
co V 1
) co exp(wV 0 I ph
I = − + (8)
5 Results of simulation
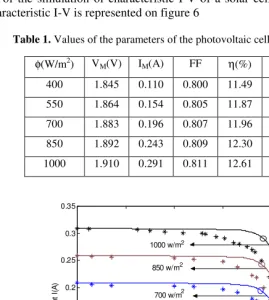
Our results of the simulation of characteristic I-V of a solar cell for various flows are gathered in table 1. Characteristic I-V is represented on figure 6
Table 1. Values of the parameters of the photovoltaic cell for various solar flows
φ(W/m2) VM(V) IM(A) FF η(%) FFexp ηexp(%)
400 1.845 0.110 0.800 11.49 0.691 9.92 550 1.864 0.154 0.805 11.87 0.679 10.01 700 1.883 0.196 0.807 11.96 0.680 10.07 850 1.892 0.243 0.809 12.30 0.711 10.80 1000 1.910 0.291 0.811 12.61 0.709 11.02
0 0.5 1 1.5 2 2.5
0 0.05 0.1 0.15 0.2 0.25 0.3 0.35
Tension V (Volt)
C
o
u
ra
n
t
I(
A
)
1000 w/m 2
850 w/m
700 w/m
550 w/m
400 w/m
2
2
2
2
Fig. 6. Influence luminous flow on characteristic I-V of a solar cell
The Figure 6 illustrates the variations of current I according to the tension V of the cell.We note that for each value of flow a maximum electric output provided by the cell corresponds.
5.1 Model with exponential (SEM)
We notice according to figure 7 that the solar cell characterized by a factor of quality definitely higher than the unit (n=1.8), can have an output similar to the experimental outputs.
It results from it from this model, which if the value of the factor of quality exceeds 1.8; this model is not competitive any more.
Consequently, we will call upon a second type of model, which is the model with two exponential relating to the improvement of this factor of quality as well as current I01 the diffusion of
the cell.
400 500 600 700 800 900 1000 9,8
10,0 10,2 10,4 10,6 10,8 11,0 11,2 11,4 11,6 11,8 12,0 12,2 12,4
Experimental n=1 n=1.6 n=1.8 n=2
O
u
tp
u
t
(%)
Flow (w/m2)
Fig. 7. Variation of the output according to solar flow (I01=10-10 A)
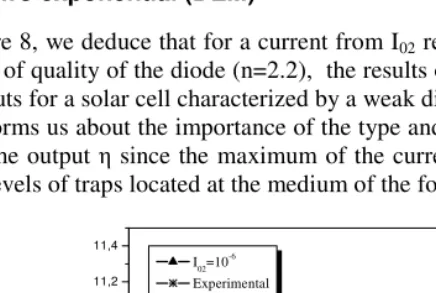
5.2 Model with two exponential (DEM)
According to figure 8, we deduce that for a current from I02 recombination = 10-5 A; and for a great
value of the factor of quality of the diode (n=2.2), the results of the theoretical yield are close to the experimental outputs for a solar cell characterized by a weak diffusion current of about 10-10 A (I01).
This result informs us about the importance of the type and the position of the levels traps in the determination of the output η since the maximum of the current of recombination in zone of space charge arises for levels of traps located at the medium of the forbidden band (n=2).
400 500 600 700 800 900 1000 9,8
10,0 10,2 10,4 10,6 10,8 11,0 11,2 11,4
I02=10-6
Experimental I02=10-5
I02=10-4
O
u
tp
u
t
(%
)
Flow (W/m2
)
6 Conclusion
The objective of our work was the development of a simulation program allowing the determination of the parameters of a photovoltaic cell.
We note that the results obtained by the model with two exponential are more significant than those obtained by the model with exponential.Indeed, the model with two exponential makes it possible to distinguish the contributions to the current from opposite saturation, of the phenomena of recombination in zone of diffusion and space charge in the areas quasi-neutrals of the transmitter and the base.
On the other hand the model with exponential leads to results incompatible with the experiment, for particular values of the factor of quality and current of saturation with the current structures of the solar cells to silicon.
References
1. P. Smestad, C. Krebs, M. Lampert, G. Granqvist, K.L. Chopra, X. Mathew, H. Takakura, Solar Energy Materials and Solar Cells, 92, 371-373(2008).
2. M. Vivar, I. Skryabin, V. Everett, A. Blakers, Solar Energy Materials and Solar Cells, 94, 1772-1782 (2010).
3. J. P. Charles, I. Mekkaoui and G. Bordure, Solid-State Electronics, 28 (1985).
4. E. Mellikov, D. Meissner, T. Varema, M. Altosaar, M. Kauk, O. Volobujeva, J. Raudoja, K. Timmo, M. Danilson, Solar Energy Materials and Solar Cells, 93, 65-68 (2009).
5. I. Tsuda, K. Kurokawa and K. Nozaki, Solar Energy Materials and Solar Cells, 35 (1994). 6. Lin Chen, Ligong Yang, M. Shi, H. Chen,Solar Energy Materials and Solar Cells, 94, 2244-2250