A Comparison of the Loop and Point
Methods of Analyzing Vegetation
C. WAYNE COOK AND THADIS W. BOX
Research Professor and Assistant Professor, Department of Range Management, Utah State University
During recent years much con- torversy has existed among tech- nicians concerning the use of dif- ferent methods in analyzing veg- etation cover. These methods have been developed to minimize personal error and cost of appli- cation . However, it appears that many have minimized cost of op- eration at the expense of accu- racy and others have over-em- phasized accuracy. A method suitable to measure some char- acteristics of vegetation may be totally inadequate to measure others. Therefore, the method must frequently be modified to obtain maximum accuracy with reasonable cost.
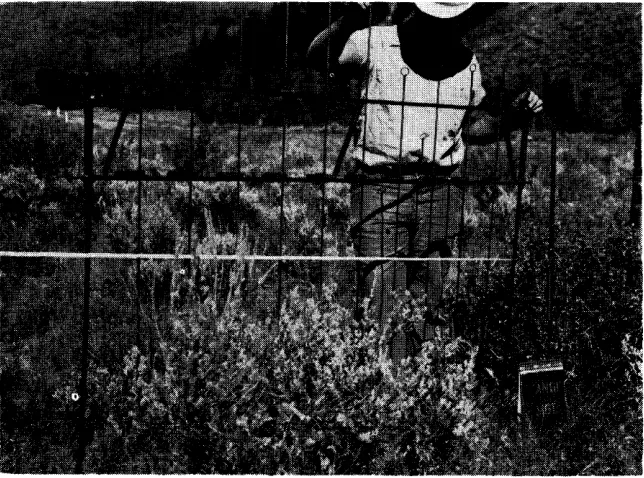
In the present study, vegeta- tion analysis was made by 3 methods including the line loop transect, the line point transect, and the point frame transect. The purpose of the study was to determine the relative merits of the 3 methods in detemining per- cent canopy cover, surface ground cover, and floral com- position of a mountain brush type. The study area was a mountain brush type in northern Utah consisting mainly of sage- brush (Artemisia tridentata) and snowberry (Symphoricarpos uaccinoides) with an understory of numerous grasses and forbes
(Figure 1).
Review of Literature Several studies have been made comparing the variations in use of the point contact method. Winkworth (1955) in Australia found that errors caused by thickness of points were significant only in certain types of vegetation. However, he found in general the thicker the point, the higher the apparent
percent plant cover. Parker (1951) in working with the loop method found that enlarging the point contact area to as much as 3/4 of an inch reduced personal error compared to smaller points. Johnston (1957) in Canada com- pared the line intercept, the point frame, and the loop method for determining cover. He con- cluded that the loop method was most rapid but detected fewer species and gave the most vari- able results. The point frame method gave the least variable data and in general was the most satisfactory.
In a study in Idaho on desert vegetation, sharp (1954) reported close agreement among men using the loop transect to deter- mine plant cover. From 61 to 79 percent of the hits were identical when resets were made on the same transects.
In Nevada, Kinsinger, et al. (1959) studied the reliability of the line intercept, the variable plot, and the loop methods in measuring shrub crown cover. They found that the loop method indicated a significantly larger percentage crown cover than the actual amount present. A sim- ilar study in California (Heady et al. 1959) showed that the line point method (in this study the point of a 3/4 inch diameter plumb bob) sampled dominant species satisfactorily but was in- ferior to the line intercept in sampling minor species.
Hutchings et al. (1959) used the % inch loop to represent a plot with area and recorded the presence or absence of a plant when any portion appeared within the loop. The authors stated that a positive bias was introduced because the s/4 inch
22
a point at the center of the loop.
Procedure
During August of 1959, data were collected by the three methods to determine percent canopy cover, percent surf ace ground cover, and percent veg- etation composition. The study area was 1300 feet long and 500 feet wide. Across the length of the area were located 12 possible grid lines 100 feet apart. Six of these were selected at random for sampling. Along each of these grid lines, two lOO-foot sampling transects were chosen at random. The line point transect method consisted of a pointed rod pro- jected downward at each l-foot interval along a transect line. The actual point was the tapered end of a l/s-inch welding rod 36 inches long. The point frame con- sisted of 10 points mounted on a frame with the points 6 inches apart (Figure 1). The frame was read at lo-foot intervals along a lOO-foot tape, making 100 point readings along the transect line. The line loop method is sometimes referred to as a mod- ified line point transect because the small loop may be considered a point. In the present study, a hit was recorded only when Ya or more of a %-inch loop was filled. This has been termed a rated loop procedure by Hutch- ings et al. (1959). This procedure reduces the number of hits com- pared to one which records a species when any of its growth appears within the circle.
FIGURE 1. Point frame method being used in a sagebrush-snowberry type to determine canopy and surface ground cover.
of the loop. Herbage on the ground surface was recorded as litter. From these recordings, surface ground cover was deter- mined.
Resulfs and Discussion Comparison of Methods The line loop transect was
The line loop readings were made at each l-foot interval along each of 12, lOO-foot tran- sect lines. The line point read- ings were made on only the first 50 feet of each transect to com- pare with the first 50 readings on the line loop transects and the point frame. The point frame readings were made on alternate 5-foot intervals along all 12 of the transects making a total of 100 points, 6 inches apart, on each lOO-foot transect.
compared to the line point tran- sect by reading the first 50 feet on each of 12 transects by both methods by two recorders. As noted in Table 1, recorder “A” obtained a higher percentage canopy cover than recorder “B” by the line point transect but recorder “B” obtained a higher canopy cover by the line loop transect than recorder “A”. This interaction between recorders and methods for canopy cover
Table 1. A comparison of fwo observers using two methods fo determine percent canopy and ground cover on twelve 50-fooi transects.
On each of the 12 transect lines. a reset or a replacement of the line was made about 3 days after the original readings were made. The first 20, l-foot intervals and the last 20, l-foot intervals were re-read on each transect to com- pare with the original readings. The line was reset by use of plumb bobs over steel stakes set at 1% feet and 98% feet at the time of the original reading. No reference was made of the re- corded first reading during the process of recording the second reading.
__~___~_
Recorder A Recorder B, <-
~_____ _____
Line loop ~~______ Line point _ Line loop Line point Transects Canopy Ground Canopy Ground Canopy Ground Canopy Ground
1 2 3 4 5 6 7 8 9 10 11 12 Averages
___._ --
52 92 82 96
26 74 52 78
40 88 76 92
42 7,6 60 78
46 74 60 76
30 70‘ 58 72
44 90 58 92
42 88 68 96
36 88 62 90
48 88 80 88
40 86 64 90
60 94 72 88
42 84 66 86
was significant (P> .05) . The average percent canopy cover was 44.5 by the line loop transect and 61.4 by the line point method (Table 1). This difference was highly significant (P>.Ol) . Re- corder “A” had 71 percent iden- tical hits by both methods and recorder “B” had 78 percent. Thus the two methods were in agreement only about 75 percent of the time. Therefore the 25 per- cent disagreement contributed to error between the methods.
There were no significant dif- ferences between recorders or methods for surface ground cover determinations.
The individual recorders each had several years experience at reading line loop transects in numerous modifications but it was the first attempt for both
at interpreting the line point transect. Inexperience could have contributed to the error among methods but recorders checked before and during the study for uniformity of interpre- tation. At no time was vegeta- tion along the line disturbed by the recorders and therefore this was not believed a factor caus- ing differences between methods or recorders. Some methods were read first on some transects and last on others. Likewise re- corder “A” read some transects first and on others recorder “B” read them first.
56 84 74 90
36 76 28 74
60 86 76 92
36 80 56 90
30 66 32 8’0
28 68 38 86
48 90 58 90
64 72
:: 62
98
46 92
54 90 58 88
52 92 60 94
52 94 66 98
A comparison between
the
point frame and the line loop
methods, using 1200 hits from
the 12 transects, showed that the
point frame gave a significantly
higher percentage canopy cover
(P>.O5) than the line loop tran-
sects. These readings were 70.7
and 56.2, respectively.
cernible difference was observed
between men when using the
point frame method.
The point
frame
gave a
slightly higher
estimate
of
ground cover (89 percent) than
the line loop transect (84 per-
cent). This difference was not
statistically significant. No dis-
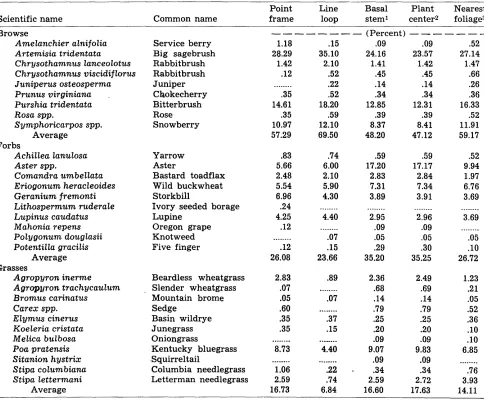
The percent floral composition
measured by the point frame
and the line loop transect dif-
fered widely. The point frame
gave considerably higher per-
centages of most grass species
whereas the line loop method
gave somewhat higher percent-
ages of most browse
species
(Table 2) . No consistent differ-
ence was observed for forbs be-
tween the two methods. The
Table 2. Percent composifion based upon point hifs by 5 different procedures.
higher figures for browse for the
line loop method are understand-
able since the browse foliage was
considerably
more dense and
taller and when it was hit, it was
more apt to cover one-half or
more of the 3/4 inch lop whereas,
in the case of grasses, a greater
number of leaves and stems were
required to fill one-half of the
loop for a hit. The broad leaved
forbs, for the most part, were
not densely foliated hence the
foliage appearing under the loop
did not yield any more hits by
Scientific name Common name
Browse
Amelanchier alnifolia Artemisia tridentata Chrysothamnus Zanceolotus Chrysothamnus viscidiflorus Juniperus osteosperma Prunus virginiana . Purshia tridentata Rosa spp.
S ymphoricarpos spp. Average
Forbs
AchiZZea Zanulosa Aster spp.
Comandra umbellata Eriogonum heracleoides Geranium fremonti Lithospermum ruderale Lupinus caudatus Mahonia repens Polygonurn douglasii PotentiZZa gracilis
Average Grasses
Agrop yron inerme Agropyron trachgcaulum Bromus carinatus Carex spp. E Zymus cinerus Koeleria cristata Melica bulbosa Poa pratensis Sitanion hystrix Stipa columbiana Stipa lettermani
Average
Service berry Big sagebrush Rabbitbrush Rabbitbrush Juniper Chokecherry Bitterbrush Rose Snowberry
Y arrow Aster
Bastard toadflax Wild buckwheat Storkbill
Ivory seeded borage Lupine
Oregon grape Knotweed Five finger
Beardless wheatgrass Slender wheatgrass Mountain brome Sedge
Basin wildrye Junegrass Oniongrass
Kentucky bluegrass Squirreltail
Columbia needlegrass Letterman needlegrass
Point Line Basal Plant Nearest
frame loop stem1 center2 foliages
---_---- (Percent) - - - - 1.18
28.29 1.42 .12 _ _ _ _. _ _ _ .35 14.61 .35 10.97 57.29
.15 .09 .09 .52
35.10 24.16 23.57 27.14
2.10 1.41 1.42 1.47
.52 .45 .45 .66
.22 .14 .14 .26
.52 .34 .34 .36
18.20 12.85 12.31 16.33
.59 .39 .39 .52
12.10 8.37 8.41 11.91
69.50 48.20 47.12 59.17
.83 5.66 2.48 5.54 6.96 .24 4.25 .12
.74 .59 .59 .52
6.00 17.20 17.17 9.94
2.10 2.83 2.84 1.97
5.90 7.31 7.34 6.76
4.30 3.89 3.91 3.69
_...-.-_ .12 26.08
- . _ _ _ _ _ . ---.__._
4.40 2.95
- . _ _. . . . .09
.07 .05
.15 .29
23.66 35.20
__ ______ 2.96
.09 .05 .30 35.25
._-._--_ 3.69 _ _ . _ _ . . _ .05 .lO 26.72
2.83 .07 .05 .60 .35 .35
.89 . . . __
.07 -..._.._
.37 .15 ._._--_. ..____._
8.73 4.40
1.23 .21 .05 .52 .36 .lO .lO 6.85 ___..._- -.__....
1.06 .22
2.59 .74
16.73 6.84
2.36 2.49
.68 .69
.14 .14
.79 .79
,25 .25
.20 .20
.09 .09
9.07 9.83
.09 .09
.34 .34
2.59 2.72
16.60 17.63
_._.-_._ .76 3.93 14.11 1 Composition based upon
on the line.
2 Composition based upon occurred on the line. 3 Composition based upon
on the line.
line loop and measuring nearest
line loop and measuring nearest
line loop and measuring nearest
plant located by nearest basal stem when no hit occurred
plant located by nearest center of plant when no hit
the line loop than by the point
frame. The same differences
were noted when comparing the
line point transect with the line
loop transect.
The line point
transect analysis of floral com-
position was not included in
Table 2 because only one-half of
each transect or one-half the
total number of possible points
were recorded by this method.
Nearest Planf in Line Loop Transect
To obtain a better estimate of
floral composition from a given
number of transects, it has been
suggested that, when no direct
herbage hit occurs on the line,
the nearest plant be recorded
(Parker 1953). In the present
study, the nearest plant in the
forward right-hand quadrant or
quarter of a circle was recorded.
This entailed considering an im-
aginary line at right angles and
to the right side of the tape at
the foot interval mark where no
hit occurred, thus, outlining the
area where the nearest plant
must appear. By moving a rod
projected downward near the
ground level in a quarter circle
motion with increased
radii
lengths from the line the near-
est plant was located.
The nearest plant was selected
by 3 different procedures; (1)
by locating the nearest basal
stem of an individual plant about
1 inch above ground level, (2)
by locating the plant with its
basal crown centered nearest the
line, and (3) by locating the
plant with the neartest foliage
anywhere in the quadrant.
’The percent floral composi-
tions based upon canopy hits by
the point frame and the line loop
transects were compared to the
line loop transect supplemented
by nearest plant selections by
each of the 3 procedures previ-
ously described (Table 2). Each
of two recorders measured one-
half of each transect by each
method.
The percent species composi-
tion varied widely among the 3
procedures
for selecting the
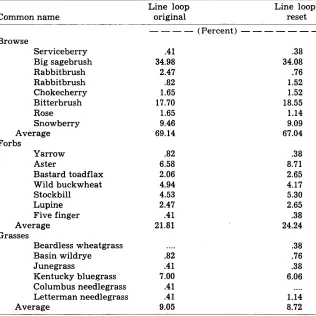
Table 3. Perceni floral composition from the original transect and a reset 3 days later based upon 40 readings in each of 11 iransecfs.
Line loop Line loop1
Common name original reset
Browse
Serviceberry Big sagebrush Rabbitbrush Rabbitbrush Chokecherry Bitterbrush Rose Snowberry Average Forbs
Yarrow Aster
Bastard toadflax Wild buckwheat Stockbill Lupine Five finger Average Grasses
Beardless wheatgrass Basin wildrye Junegrass
Kentucky bluegrass Columbus needlegrass Letterman needlegrass Average
---- (Percent) - - -
.41 .38
34.98 34.08
2.47 .76
.82 1.52
1.65 1.52
17.70 18.55
1.65 1.14
9.46 9.09
69.14 67.04
.82 .38
6.58 8.71
2.06 2.65
4.94 4.17
4.53 5.30
2.47 2.65
.41 .38
21.81 24.24
..__ .82 .41 7.00 .41 .41 9.05
.38 .76 .38 6.06 .._. 1.14 8.72 131.6 percent of the total canpoy hits on the line loop resets were not ident-
ical species hits. By an analysis of variance, this difference was highly significant.
nearest plant. When the nearest
plant was selected on the basis
of the nearest basal stem or the
nearest plant center, the forbs
and grasses that grew under-
neath the shrubs were more fre-
quently
recorded
than the
browse overstory. The cover of
grasses and forbs increased about
10 and 11 percent, respectively,
over the original loop method
and shrubs decreased about 21
percent (Table 2).
The selection of the nearest
plant by means of the nearest
foliage compared favorably with
the composition obtained by the
point frame method, however,
the variability was greater than
the point frame. The coefficient
of variation for the 5 procedures
of determining percent composi-
tion of the dominant species was
smallest for the point frame
method.
Thus, the percent
Line Loop Transect Resets In each of 12 transects, the lOO-foot steel tape was replaced and re-read by the line loop pro- cedure used in the original read- ing. One reset recording was lost, therefore Table 3 represents averages from only 11 transects. Canopy cover, gr.ound cover, and percent floral composition based upon canopy cover varied only slightly between the original reading and the reading on the reset. The difference in canopy cover was only 2.5 percent and in ground cover only 1.8 percent.
It should be stated, however, that 31.6 percent of the total can- opy hits on the reset line were not identical hits compared to the original readings. Even though about one-third of the hits were not identified with the same plants previously hit on the original transects, the per- cent canopy cover, surface ground cover, or species com- position was not significantly different between the readings. This would be expected since the differences between readings and re-readings were relatively small compared to the variabil- ity among all transects in the study.
If each point on each transect is considered a paired reading with the same point on the reset transect, identical hits are of seemingly great importance. In this case, each hit that is not identical, even though it is re- corded only a few hours or a few days apart, indicates a change in habitat conditions. The data from this study indicate that a 32 percent change could possibly take place from error in sampl- ing paired points along 11 tran- sects without any actual change in vegetation composition. How- ever, these 32 hits on the reset transect that are not identical with the original hits are still sampling the normal cover of vegetation. Therefore, when a species hit does not agree at one point, it may be compensated for at another point where iden-
tical hits did not occur. There- fore, the 2 readings at each point should not be considered as paired readings but rather as separate single readings on al- most the same transect.
It is generally agreed that use of periodic re-readings on the same plots increases the preci- sion of detecting changes in plant responses compared to in- termittent single readings on separate plots. This is somewhat comparable to the use of paired plots in preference to random plots in experimental designing.
In order to determine the in- creased precision from the use of re-readings on the same tran- sects compared to 2 readings on separate sets of random transect, comparable variances can be cal- culated. In the latter case, the variance for the original loop reading and the variance for the re-readings are averaged. This average variance can be com- pared to one-half the variance calculated from differences be- tween the original loop readings and the re-readings.
In the present study, two sep- arate random samples would re- quire 3 times as many transects for each reading compared to re- readings on the same plot to de- tect changes in canopy cover with the same precision. In like manner, it would require from 8 to 10 times as many samples to detect changes in percent com- position of the dominant species
and twice as many to determine changes in surface ground cover.
In the present study, it re- quired l/3 longer to establish, read, relocate, and re-read a per- manent transect compared to a single reading on two separate randomized transects. There- fore, 3 random transects could be read twice while 2 permanent transects are being read and re- read. This increased number of random transects compared to permanent transects does not compensate for the increased number required for equal sam- pling efficiency.
This would indicate that at- tempts to re-read the same tran- sect would be desirable unless cost of materials for marking the trassect lines was exorbitant.
Sampling Efficiency
From the standpoint of time required to ‘record the hits on a lOO-foot transect, the point frame was considerably more rapid. After the line was stretched and ready for reading, the point frame required only 14 minutes, whereas the line loop and line point both required about 21 minutes.
Precision of sampling can be measured by the relative size of the standard deviation with re- spect to its mean or by the num- ber of samples required to esti- mate means with the same preci- sion and the same probability.
The line point transect had the
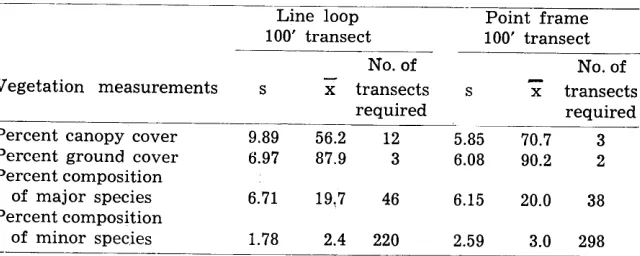
Table 4. Standard deviations averages and number of lOO-foot transects required to measure vegetation and ground cover by the random line loop and fhe point frame transects with equal efficiency.1
Line loop .~ Point frame 100’ transect 100’ transect
No. of No. of
Vegetation measurements s X transects s F transects required required Percent canopy cover 9.89 56.2 12 5.85 70.7 3 Percent ground cover 6.97 87.9 3 6.08 90.2 2 Percent composition
of major species 6.71 19,7 46 6.15 20.0 38 Percent composition
of minor species 1.78 2.4 220 2.59 3.0 298 l(=alculations for number of samples needed was based upon estimating the
largest coefficient of variation for most measurements and therefore was consdired less pre- cise than the point frame or the line loop. Data for precision of the line loop transects compared to the point frame transects are presented in Table 4. The num- ber of lOO-foot transects required to sample with the same preci- sion was considerably higher for the random line lop transect than for random point frame transects for estimates of percent canopy cover, percent surface ground cover, and percent composition of the dominant major species. However, for estimates of the percent composition of minor forage species, the line loop tran- sect required less transects than the point frame. This difference in favor of the line loop transect may be a result of chance since in neither method was the stand- ard deviation considered an ac- curate estimate because of the low occurrence of these species along the 12 transect lines. In either case, it is indicated that minor species cannot be sampled adequately because of the large number of transects required. Even for major species, it re- quires from 38 to 46 lOO-foot transects selected at random to detect a change of 10 percent with a 5 percent probability.
Under conditions of this ex- periment, it would require about 16 hours to sample 38 one hun- dred-foot random transects with the point frame method and about 24.5 hours to sample 46 one hundred-foot random tran- sects with the point loop method.
It is believed that either method would detect changes within vegetation classes or sur- face ground cover with equal precision if the calculated num- ber of samples were taken in each case. If a change in vegeta- tion involves replacement of grasses by shrubs, the line loop would overemphasize the change since the line loop as used in this study overestimates shrubs and underestimates grasses com-
pared to either point method.
Summary and Conclusions During the late summer of 1959, data were collected by the line point, line loop, and point frame transects on a mountain- brush type in northern Utah to determine the efficiency of each method in estimating canopy cover, surface ground cover, and species composition.
Twelve lOO-foot transects were randomly located in an area 1300 by 500 feet. All methods were applied on each transect. Two recorders read the transects by the line loop and the line point methods.
The line point method gave a significantly higher canopy cover than the line loop method, but there was no significant dif- ference between methods or be- tween men for surface ground cover values. The point frame method likewise gave a signifi- cantly higher canopy cover than the line loop method, but the co- efficient of variation for the point frame was considerably smaller than either the line point or the line loop methods.
The line loop method overesti- mated the percent canopy cover for shrubby species and under- estimated it for grasses compared
to the line point or the point frame methods.
All methods appeared to esti- mate the percent canopy cover for forbs about the same.
Use of the nearest plant meas- urement, where direct hits under the line were not recorded, in- dicated that there is likelihood of introducing bias.
Replacing the transect line to measure the accuracy of re-read- ing the same hits by the line loop method showed that canopy cover and surface ground cover were not significantly different from the original reading. How- ever, only about 68 percent of the hits were identical species hits when the reset hits were compared to the original hits.
It is concluded that re-reading
the same transects at intermit- tent periods is preferred to pe- riodic random sampling because of increased precision. It is also concluded that the point frame transect is more precise and re- quires less time than the line loop or the line point.
LITERATURE CITED
HEADY, HAROLD F., ROBERT P. GIB- BENS, AND ROBERT W. POWELL. 1959. A comparison of the charting, line intercept and line point methods of sampling shrub types of vege- tation. Jour. Range Mangt. 12: 180-188.
HUCHINGS, SELAR S. AND RALPH C. HOLMGREN. 19 5 9. Interpretation of loop-frequency data as a meas- ure of plant cover. Ecology 40: 668-677.
JOHNSTON, A. 1957. A comparison of the line interception, vertical point quadrat, and loop methods as used in measuring basal area of grass- land vegetation. Canad. Jour. Plant Sci. 37: 34-42.
KINSINGER, FLOYD E., RICHARD E. ECKERT AND PAT 0. CURRIE. 1960. A comparison of the line intercep- tion, variable plot and loop meth- ods as used to measure shrub crown cover. Jour. Range Mangt. 13: 88-92.
PARKER, K. W. 1951. A method for measuring trend in range condi- tion on national forest ranges. U.S. Forest Service, Washington, DC. 26 pp. (Processed)
PARKER, K. W. 1953. Measurement and observation of vigor and com- position- Supplement 2. “A Method for Measuring Trend in Range Condition on National For- est Ranges.” U.S. Forest Service, Washington, D.C. 9 pages. (Proc- essed)
SHARP, L. A. 1954. Evaluation of the loop procedure of the 3-step method in the salt-desert shrub type in southern Idaho. Jour. Range Mangt. 7: 83-88.
WINKWORTH, R. E. 1955. The use of point quadrats for the analysis of heathland. Austral. Jour. Bot. 3: 68-81.
Longmont
Seed
Co.Field Seeds and Complete Seed Service Buy-Clean-Treat-Sell