Abstract— The measurements of physical parameters of the TRIGA reactor and Nuclear power plant Krško (NEK) reactor cores have been in the past performed on hand of the neutron flux signal obtained from uncompensated ionization cells and by employment of the a digital meter of reactivity (DMR). At the TRIGA reactor only one ionization cell is currently used for flux measurements. During the insertion of one control rod the neutron flux distribution is significantly altered affecting the flux measurements of inserting different control rods. The problem is presently solved by assigning a correction factor to each control rod what introduces an additional uncertainty.
In the present paper the implementation of four fission cells for reactivity measurements is presented. In this way determining the correct gamma background and its subtraction, performed by DMR algorithms, becomes less important as previously by using ionization chambers. The larger number of detectors also reduces the flux redistribution effects on the signal during individual control rod movements.
Keywords—Fission cells, control rod worth measurements, research reactor, combining signals
I. INTRODUCTION
THE control rod worth in research reactors and power plants can be determined by different methods [1 - 7]. In the present work the rod-insertion method, by employing measurement of the neutron flux with fission cells, is studied. This method is particularly convenient because it is very quick and simple to perform. The principle of the rod-insertion method is to start from a critical reactor operating at low power and to measure the time-dependent reactivity change while a control rod is inserted into the core with the drive mechanism at normal speed. By analyzing the flux trace, not only the total rod worth but also the differential and the integral control rod worth curves are obtained.
During the rod-insertion measurement the flux may drop by several orders of magnitude. The analysis is
performed by transferring the data of the neutron flux from nuclear instrumentation to a digital reactivity meter (DMR) consisting of a high-quality electrometer and a computer using special software for analysis of the signal. The DMR software uses point kinetics equations for calculation of the reactivity from the flux trace [3, 7]. The procedure, which will not be repeated here in detail, involves several stages from smoothing of the signal to using a Fourier transform for fitting the reactivity trace during the rod-insertion. The final result are the integral and differential worth curves of the inserted control rod; an example is presented in Figure 3.
During the rod-insertion measurement the flux is, however, redistributed and a flux depression forms at the position of the inserted control rod. Due to this re-distribution the signal at the detector is not necessarily proportional to the average flux in the core. The effect can be compensated by the usage of a neutron flux depression factor, what has been done in the past. Another possibility is to use multiple detectors, symmetrically positioned around the core. Most of the available studies of the described method are performed for NPPs, usually having two sets of detectors, at the top and bottom of the core and with the absorbing control rod clusters distributed around the core [5-7]. The present study was performed on a small research reactor with one set of detectors at the equatorial plane and four localized control rods. The possibility to what extent the axial dependence of the flux depression factor can be omitted is performed, and comparison between the method of using a single detector and the average of four detectors is performed in the scope of this work.
II. REDISTRIBUTION OF NEUTRON FLUX
Control rods are large neutron absorbers and have a large impact on the neutron flux spatial distribution. In the TRIGA research reactor of the “Jožef Stefan” Institute four control rods are employed [3]. The
Usage of multiple fission cells for neutron flux
measurements during rod-insertion method
Igor Lengar*, Sebastjan Rupnik, Andrej Žohar, Vid Merljak, Marjan Kromar, Luka Snoj Jožef Stefan Institute, Ljubljana, Slovenia
EPJ Web of Conferences 225, 04024 (2020) https://doi.org/10.1051/epjconf/202022504024
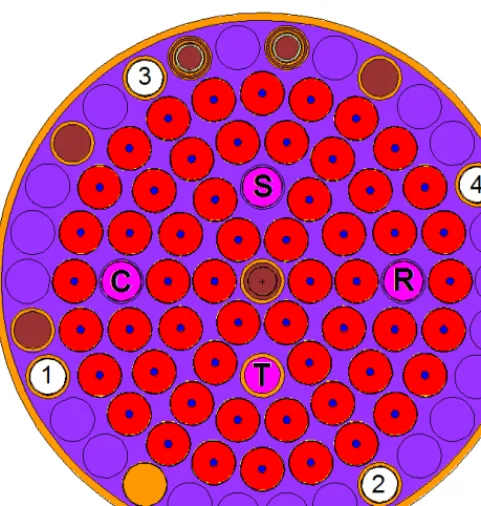
particular core configuration, on which measurements in the scope of this work were performed, is presented in Figure 1.
Figure 1: TRIGA core configuration. The control rods are labeled as (T) transient, (R) regulating, (C) shim, (S) safety. The ionization chamber is located behind the reflector (both are not visible in the figure) on the
left side of the core. The Fission cells are numbered.
The DMR software is based on point-kinetic equations and for this reason a signal, proportional to the core average flux is needed as the input. Since the integral neutron flux in the core Ф(t) [4] cannot be measured directly, we generally measure the neutron flux Ф(r,t)
at one or more points r outside the core. The first approximation is to assume that this signal is proportional to the integral of the flux in the core. This assumption is acceptable if the relative change between
Ф(t) and Ф(r,t) is small during the measurement. Otherwise, a correction due to the flux redistribution is necessary.
The correction depends on the positions of the control rods and of the detector. An ionization chamber neutron detector measures essentially the flux of neutrons thermalized in the vicinity of the detector. The relative thermal flux for a core in which a control rod in the vicinity of the detector is inserted is much lower at the detector location and correspondingly higher at a location far from the inserted rod and the detector, compared to the unrodded core. Such a flux
cell locations 1 and 3, in the vicinity of the control rod, read a lower signal than fission cells 2 and 4 on the opposite side. All of the readings deviate from the signal, which would be proportional to the core integral flux.
This flux redistribution during the insertion of a control rod can be compensated with a numerically determined flux depression factor FY; it represents the required correction of the neutron flux radial redistribution for rod Y [4]. There are several limitations for the usage of
FY, among others it has to be calculated for each combination of control rods and ionization chamber positions.
Figure 2. Graphical presentation of the thermal neutron flux (En < 1eV) distribution (normalized to
n/cm2/fission source neutron) for the case of the full
insertion of the compensating control rod (C); calculation with MCNP6.1.
III. USING SIGNAL FROM MULTIPLE FISSION CELLS As outlined in the previous section one of the drawbacks of using a signal from one ionization chamber is the necessary calculation of the flux depression factors, which can be dependent also on core configuration. For this reason, in the frame of this work, the rod insertion measurements were performed by using four identical fission cells instead, each with 165 mg of 235U fission
material. They were located symmetrically around the core (numbered in Figure 1). The fission cells were operated individually and the signal recording was synchronized and averaged by the computer.
The differential values of the control rods were
fission cells, located symmetrically around the core. Both results were compared in order to evaluate the modified technique.
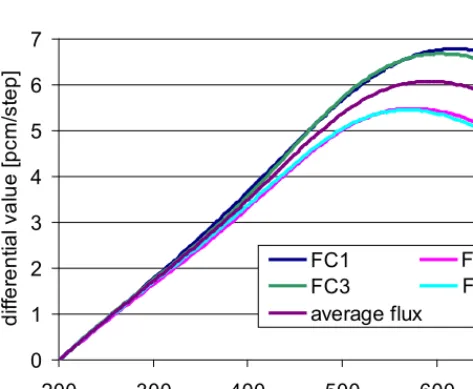
The differential control rod curves for the compensating control rod (C), measured and calculated by the rod insertion method for the four individual fission cells, are presented in Figure 3. On the figure the curve by using the combined signal from all fission cells is also presented. It should be noted that the curve, derived from the average over all signals is not equal to the average of the four curves (i.e. the curve average in Figure 3 is not equal to the average over the curves FC1 – FC4); their calculation is subject to the complex nature of the rod-insertion method.
Figure 3: The differential control rod curves for the compensating control rod (C), measured and calculated
by the rod-insertion method for the four individual fission cells, and the curve calculated from the combined (average) signal from all fission cells.
It is observed that usage of four symmetrically positioned fission cells reduces the need for the flux depression factor employment. The data presented in Figure 3 are compared in Table 1.
Table 1: Integral values for the transient rod as obtained by using individual fission cells and the combined signal from all fission cells. The standard
measurement with one ionization chamber and employment of the flux depression factor is given for
comparison.
The standard method for determination of a control rod worth is by using the ionization chamber, located behind the reflector and with the associated flux depression factor - for the compensating control rod (C) such value amounts to 2707 pcm. The comparison with the control rod worth obtained from the average signal shows a deviation of 3% and is smaller than deviations due to measurements with any single fission cell. It is also on the same order as the uncertainty of the method itself. Introducing multiple fission cells thus enables quick measurements of the integral and differential value without having to calculate the flux form factor, which is configuration specific.
As anticipated and observed also from Figure 3 and Table 1, the location of the fission cell with respect to the measured control rod influences the integral value: without the usage of the flux depression factor the two fission cells which are on the same side of the reactor as the measured compensating rod, experience an excessive large change in neutron flux and hence a too large value of the calculated integral value, whereas for the other two cells, located on the far side of the regulating rod (R), the situation is reversed.
IV. MEASUREMENT BACKGROUND /NOISE In case of rod-insertion measurements with one uncompensated ionization chamber, which has been the practice up to now, the value of the gamma background is substantial; since the reactor becomes highly subcritical during the measurement the background is often a few times larger than the signal due to the neutron flux – hence the background noise and exact determination of the background also become important. In case of measurements with fission cells the gamma background is much less important due to their smaller sensitivity to gammas. Figure 4 displays a typical reactivity trace, calculated with DMR during rod-insertion for the two cases – for obtaining the signal from an ionization chamber or from fission cells. 0 1 2 3 4 5 6 7
200 300 400 500 600
steps inserted di ffer ent ial v al ue [ pc m /s tep] FC1 FC3 average flux
integral value of rod (C)
Fission cell 1 2872
Fission cell 2 2367
Fission cell 3 2869
Fission cell 4 2362
combined (averaged) signal 2627
ionization chamber including
flux depression factor 2707
FC2 FC4 EPJ Web of Conferences 225, 04024 (2020) https://doi.org/10.1051/epjconf/202022504024
fission cells, located symmetrically around the core. Both results were compared in order to evaluate the modified technique.
The differential control rod curves for the compensating control rod (C), measured and calculated by the rod insertion method for the four individual fission cells, are presented in Figure 3. On the figure the curve by using the combined signal from all fission cells is also presented. It should be noted that the curve, derived from the average over all signals is not equal to the average of the four curves (i.e. the curve average in Figure 3 is not equal to the average over the curves FC1 – FC4); their calculation is subject to the complex nature of the rod-insertion method.
Figure 3: The differential control rod curves for the compensating control rod (C), measured and calculated
by the rod-insertion method for the four individual fission cells, and the curve calculated from the combined (average) signal from all fission cells.
It is observed that usage of four symmetrically positioned fission cells reduces the need for the flux depression factor employment. The data presented in Figure 3 are compared in Table 1.
Table 1: Integral values for the transient rod as obtained by using individual fission cells and the combined signal from all fission cells. The standard
measurement with one ionization chamber and employment of the flux depression factor is given for
comparison.
The standard method for determination of a control rod worth is by using the ionization chamber, located behind the reflector and with the associated flux depression factor - for the compensating control rod (C) such value amounts to 2707 pcm. The comparison with the control rod worth obtained from the average signal shows a deviation of 3% and is smaller than deviations due to measurements with any single fission cell. It is also on the same order as the uncertainty of the method itself. Introducing multiple fission cells thus enables quick measurements of the integral and differential value without having to calculate the flux form factor, which is configuration specific.
As anticipated and observed also from Figure 3 and Table 1, the location of the fission cell with respect to the measured control rod influences the integral value: without the usage of the flux depression factor the two fission cells which are on the same side of the reactor as the measured compensating rod, experience an excessive large change in neutron flux and hence a too large value of the calculated integral value, whereas for the other two cells, located on the far side of the regulating rod (R), the situation is reversed.
IV. MEASUREMENT BACKGROUND /NOISE In case of rod-insertion measurements with one uncompensated ionization chamber, which has been the practice up to now, the value of the gamma background is substantial; since the reactor becomes highly subcritical during the measurement the background is often a few times larger than the signal due to the neutron flux – hence the background noise and exact determination of the background also become important. In case of measurements with fission cells the gamma background is much less important due to their smaller sensitivity to gammas. Figure 4 displays a typical reactivity trace, calculated with DMR during rod-insertion for the two cases – for obtaining the signal from an ionization chamber or from fission cells. 0
1 2 3 4 5 6 7
200 300 400 500 600
steps inserted
di
ffer
ent
ial
v
al
ue [
pc
m
/s
tep]
FC1 FC3
average flux
integral value of rod (C)
Fission cell 1 2872
Fission cell 2 2367
Fission cell 3 2869
Fission cell 4 2362
combined (averaged) signal 2627
ionization chamber including
flux depression factor 2707
FC2 FC4
EPJ Web of Conferences 225, 04024 (2020) https://doi.org/10.1051/epjconf/202022504024
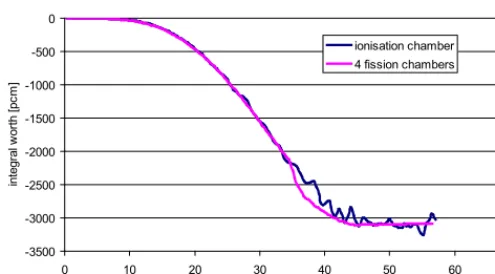
Figure 4: A typical calculation of the reactivity with DMR for the two cases of obtaining the signal from ionization chambers or fission cells. The larger noise
in the former measurement is clearly visible.
As can be observed from Figure 4 the noise due to fluctuations in gamma background is greatly reduced by using the signal from fission cells and it is reflected in a smaller noise in the reactivity signal. A larger noise of the flux signal due to gammas is reflected in the lower accuracy of the rod-in method. Usage of fission instead of ionization chambers thus increases the overall accuracy of the method.
V. CONCLUSIONS
The rod insertion method for measuring integral and differential worth of control rods using a digital meter of reactivity was extended by collecting the signal from four fission cells rather than the usual signal source from a single uncompensated ionization chamber. The larger number of detectors was found to reduce the flux redistribution effects on the signal during individual control rod movements. Four fission cells, symmetrically positioned around the reactor core, were found to be a suitable alternative for control rod measurements using the rod insertion method even without calculation of flux redistribution factors. Additionally due to usage of fission rather than ionization chambers the correct gamma background determination and subtraction, performed by DMR algorithms, became less important.
-3500 -3000 -2500 -2000 -1500 -1000 -500 0
0 10 20 30 40 50 60
time [s]
int
egr
al
w
or
th [
pc
m
]
ionisation chamber 4 fission chambers
70
REFERENCES
[1]
J. Shaw,
Reactor Operation.
Pergamon Press, New York (1969).
[2]
V. Merljak, I. Lengar, A. Trkov, Proc. Int. Conf.
Comparison of Measured and CalculatedIntegral and
Differential Reactivity Worth of Control Rods in a TRIGA Reactor
, Proceedings of the RRFM, 30 March
- 3 April, Ljubljana, Slovenia (2014).
[3]
A. Trkov, M. Ravnik, H. Wirnmer, B. Glumac, H. Böck, H, “Application of the rod-insertion method for
control rod worth measurements in research reactors”,
Kerntechnik
60
, pp 255–261 (1995).
[4]
I. Lengar, A. Trkov, M. Kromar and L. Snoj, “Digital meter of reactivity for use during zero-power
physics tests at the Krško NPP”,
Journal Of Energy Technology - JET
,
vol. 5
, pp. 13-26 (2012).
[5]
E.K. Lee, H.C. Shin, S.M. Bae, Y.K. Lee, “New dynamic method to measure rod worths in zero power
physics test at PWR startup”, Annals of Nuclear Energy
32
pp. 1457–1475 (2005).
[6]
Chao, Y.A. et al, “Dynamic rod worth measurement”, Nucl. Tech.
132
, p. 403(2000).
[7]
B.Glumac, G. Skraba, “Rod Insertion Method for Rod Worth Measurement”, Proc. Technical Committee,
IAEA/TC-650, p. 280, International Atomic Energy Agency (1989).
[8]
J.J. Duderstadt, L.J. Hamilton,
Nuclear Reactor Analysis
, John Wiley & Sons, (1976).
[9]
R. Jeraj, M. Ravnik, “TRIGA Mark II reactor: U(20) - Zirconium Hydride fuel rods in water with graphite
reflector”,
IEU-COMP-THERM-003
,
Nuclear Energy Agency, NEA/NSC/DOC(95)03, Paris
(1999).
[10]
L. Snoj, M. Ravnik,
Calculation of Power Density with MCNP in TRIGA Reactor
, Proc. Int. Conf.
Nuclear Energy for New Europe 2006, Portorož, Slovenia, September 18-2, p.p. 109.1-6 (2006).
[11]
V. Merljak, A. Trkov, M. Kromar, L. Snoj,
Rod insertion method analysis – dynamic vs. static reactivity
,
Proc. this conference
[12]
P. Blaise, F. Mellier, P. Fougeras, “Modified Source Multiplication (MSM) technique”, IEEE
Transactions On Nuclear Science,
58
, No.3 (2011).
EPJ Web of Conferences 225, 04024 (2020) https://doi.org/10.1051/epjconf/202022504024