Available online:
http://edupediapublications.org/journals/index.php/IJR/
P a g e | 674Chinas’ temporal emissions from final demand
of domestic and imported goods.
M. Jawad Sajid
1, Li Xinchun
1, Qingren Cao
1& Jing Xie
11
School of Management, China University of Mining and Technology, Xuzhou, Jiangsu
province, 221116, China.
Abstract:
Final demand is the main culprit for a country’s emissions. In order to curb a country’s emissions it’s essential to develop a deep understanding of final demand and its categories. In this study we have decomposed Chinas’ emissions from final demand of domestic and imported goods in to relevant categories of Household, Government and Capital. We have also argued, to correctly understand final emissions distinction should be made between emissions from intermediate, final and total imported emissions moreover proposed possible accounting treatments for all three. Production and consumption-based emissions from final demand are on rise since 2002 onwards while emissions from final-imports have actually decreased over the years. Capital formation with 39% is the major final demand category for domestic goods. While household with 52% is for final imports. The gap between total and final import emissions has increased resulted from growing demand of intermediate imports and decreased demand of finished (final) imports. Production-based emissions are always greater than consumption-based with an ever increasing split between the two. This further decomposition will be helpful to further understand Chinas’ final emissions which can help managers and policy makers to effectively and efficiently design carbon mitigation policies.
Keywords
Input-output analysis; Embodied carbon emissions; Final demand; Imports
1.
Introduction
2
CO
Emission mitigation is a common global welfare problem, which should be paid close attention to by everyone [1]; [2]. Current rate of global GHG emissions can affect the worldwide environment [3]. Causes of GHG emissions profit people by providing them with consumable goods and services [4]. But pose biggest health problems of current century [5].
Global warming is mainly caused by carbon emissions released from burning of fossil fuel [6]. Pursuing many nations to impose mechanisms for decrease in consumption of fossil fuels [7]. As a matter of fact many nations have achieved reductions
inCO2emissions and some have fulfilled their Kyoto protocol [8]. Which might be owing to the fact that these countries have outsourced their carbon intensive emissions [9]; [7].
Two type of approaches production (similar to IPCC and other international agreements) and consumption-based are extensively employed for calculation of global GHG emissions [10]. The type of accounting approach adopted deeply influence
allocation ofCO2emissions responsibility [11]. Hence there is an international debate on approaches and allocation of responsibility for GHG emissions
[12]; [13]. Calculations under PBA are
uncomplicated but it neglects global transport and carbon leakage problems [14]. On other hand consumption- based approach is much fairer when assigning emissions accountability [15]; [16]. Consumption based policy is objective and cost efficient [17]. And it may be needed for sustainable environment [18]. It can help abate worldwide air contamination [19], stimulate ecological comparative advantages and dispersal of technology [20].
Consumption-based approach would pursue
importers towards mitigation projects in regions from where they import merchandises [21]. Consumption-based approach also have some disadvantages which
may be eliminated by exercising shared
responsibility [14]; [21]; [22].
Available online:
http://edupediapublications.org/journals/index.php/IJR/
P a g e | 675approach [32]; [14]; [7]; [33]; [34] ; [35]; [36]; [37]; [38]; [39] . The distinction between the two is in handling of imports for intermediate usage with former failing to distinguish between imports for intermediate and final use [21], meaning only considering last stop or final supplier of imports on other hand multi-regional approach takes in to consideration import supply chains between all regions [40]. SRIO model calculates embodied emissions from regional industries [39] and treats imports as domestically manufactured goods [41]; [42]. Su & Ang [43] decomposed SRIO in to non-competitive [44]; [45]; [46] and non-competitive [47]; [48]; [49].
The main reason of conducting embodied emissions studies is to split production emissions in to various categories of final emission [43]. Although there is already much literature on Chinas’ embodied emissions specifically temporal emissions see table but most of existing literature fails to provide, carbon emissions from both final demand for domestic and final imported goods in to its respective categories i.e. Household, Government and Capital (see Error! Reference source not found.). As a matter of fact final demand for imported goods has no relation with intermediate processes of a country or region so emissions from final imports should be calculated separately from main IO model (intermediate matrix) i.e. they in no way impact intermediate demand for domestic and imported goods, intermediate imports demand is totally independent of final demand for imported goods. In most of the literature Emissions from total imports (Intermediate plus final) are presented rather than from final imports. As a matter of fact Intermediate imports are considered as domestic inputs which after reprocessing are converted to outputs [41]. So it’s much more appropriate to treat emissions from intermediate imports embodied in to final demand for domestic goods including exports separately from final demand for imported goods.
Existing literature on embodied emissions fails to split final emissions in to relevant categories of both domestic and imported final emissions. It’s much more proper to distinguish between intermediate and final imports and then to treat intermediate imports emissions as embodied in final demand for domestic goods. By distinguishing between embodied emissions from final domestic goods demand and final imports demand we will be in a much better position first to understand real final demands’ embodied emissions i.e. total embodied emissions of final demand for domestic and imported goods. And by developing understanding of these two main heads and their respective categories of final demand policy makers will be in a more comfortable position to tailor made mitigation policies according to
distinction and/or similarities between embodied emissions from main heads of final demand.
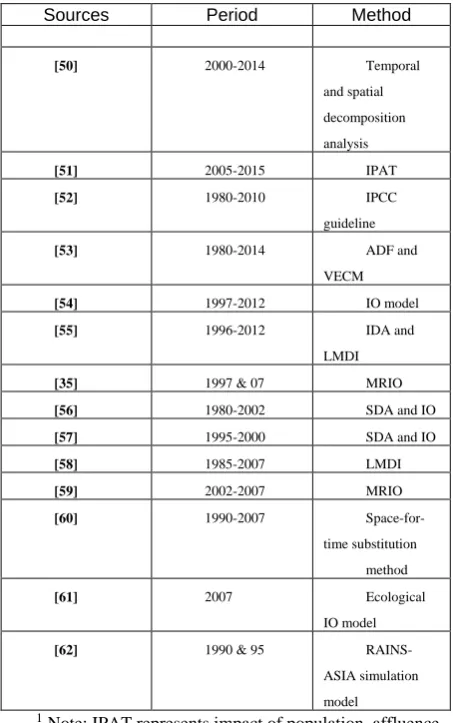
Table 1. Recent literature on temporal emissions of China.
Sources Period Method
[50] 2000-2014 Temporal
and spatial
decomposition
analysis
[51] 2005-2015 IPAT
[52] 1980-2010 IPCC
guideline
[53] 1980-2014 ADF and
VECM
[54] 1997-2012 IO model
[55] 1996-2012 IDA and
LMDI
[35] 1997 & 07 MRIO
[56] 1980-2002 SDA and IO
[57] 1995-2000 SDA and IO
[58] 1985-2007 LMDI
[59] 2002-2007 MRIO
[60] 1990-2007
Space-for-time substitution
method
[61] 2007 Ecological
IO model
[62] 1990 & 95
RAINS-ASIA simulation
model
1Note: IPAT represents impact of population, affluence
and technology, IPCC= Intergovernmental panel on climate change, ADF= Augmented Dickey-Fuller, VECM= Vector error correlation model, IO= Input-output, IDA= Index decomposition analysis, LMDI= Logarithmic mean divisia index, MRIO= Multiple-region input-output and SDA= Structural decomposition analysis.
In this paper we have presented carbon emissions from final domestic demand for domestic goods and final domestic demand for imported goods in to their relevant categories. We have considered temporal emissions of China for the period of 1995-2009 as a case example1.The rest of the paper is organized in the following manner. Section 2 presents Materials and Methods, section 3 is portrays results and in section 4 we have discussed our work.
1 China is world largest carbon emitter under both production and
Available online:
http://edupediapublications.org/journals/index.php/IJR/
P a g e | 6762.
Materials and methods
2.1 Materials
The main source of our data including IO tables and environmental accounts are from world input-output database [68].There are two releases 2013 and 2016, we have utilized 2013 releases’ environmental accounts [69] and national IO tables [70]; [71] for the years1995-2009, Under release 2013 following sub-categories are available: ‘World, national & regional IO tables’, ‘environmental accounts’ and ‘Socio- economic information’. Many scholars have considered WIOD as a reliable source of information for environmental problems [72]; [73]; [74]; [7]; [24]; [10].
2.2 Methods
Wassily W. Leontief [63] is considered to be the author of input-output model presented as:
F AX
X (1)
By isolatingXwe have,
I A
FX 1 (2)
Where Xrepresents total yield or output of an economy, I represents an nnidentity matrix, Ais
technology matrix2 whose element
j ij ij
x x
a equals
total output entailed from sectori for production of
one element at sector j, L
IA
1represents Leontief inverse matrix, Fequals vector of final demand or external demand. WhereAADAM .National input out tables provided by WIOD database uses non-competitive imports assumption meaning intermediate imports are treated separately from intermediate domestic goods. We have to add intermediate imports to the original domestic technology matrix so;
I A A
F EIM
X D M 1 DD (3)
Where,AD is a technology matrix of intermediate demand for domestic goods, AMis a technology matrix of domestic intermediate demand for imported goods, IMis intermediate imports ,FDDdomestic final demand for domestic andEis exports or external demand for domestic goods.
2
A
Matrix is also referred as: intermediate demand [35],technology matrix [47] and direct requirement matrix [41] in related literature.
Final local demand for domestic goodsFDDcan be further decomposed as:
n i DD i n i DD i n i DD i n i DD i DD DD DD DD CF GF HF F CF GF HF F 1 1 1 1 ( 4 )WhereHFDD, GFDDandCFDDrepresent the domestic final demand of household, Government and Capital for domestic goods
Similarly final demand for imported products in to its relevant categories can be further decomposed as: ) 5 ( 1 1 1
1
n i M i n i M i n i M i n i M i M M M M CF GF HF F CF GF HF FWhere FMis the domestic final demand for imported goods andHFM GFMplus CFMrepresent the domestic final demand of households, government and capital for imported goods.
If
1,2,3,,n
is a vector of directsectoral intensities obtained by dividing direct sectoral emission by sectoral output then by multiplying with Xwe can get the total production-based carbon emissions embodied in final demand for domestic goods and services including from domestic final demand and form exports.
I A
F EC 1 ˆDD ˆ (6)
Where Cis a vector of total production-based emissions, sign represents that the vectors ofFˆDD,
Eˆ have been diagonalized.
Similarly non-competitive production based emissions can be presented as:
I A
F EC D 1 ˆDD ˆ (7)
Where Crepresents non-competitive
production based emissions. ADRepresents domestic technology coefficient matrix without intermediate imports.
By multiplying with FMwe can get
Available online:
http://edupediapublications.org/journals/index.php/IJR/
P a g e | 677of imported country not according to the country form where goods are imported from [64]; [65]; [66].In other words exporting country emission intensity is considered same as importing country (domestic) emission intensity [41].
n
i M I n
i i M
M
F F
C
1 1
ˆ
ˆ
(8)
Where CMrepresents emission from final demand of imported goods. Based on our argument that final imports have no relation with intermediate production process (technology matrix). We calculated emissions form final imports directly by multiplying them with direct sectoral intensities.
Below we have calculated imports under
conventional method which in our view represents emissions from total imports rather than form final demand of imported goods.
I A
FMCM M 1 (9)
Where CMrepresents total imports carbon emission andFM represents total quantity of final
demand for imported goods.
Consumption-based emissions are equal to emissions embodied in final demand for domestic goods (production-based emissions) minus emissions from exports (external demand for domestic goods) plus emissions from imports [67] which in our case will be emissions from final imports3.
M E
C C C
C (10)
WhereCis total consumption based emissions and C,CE,CMrepresent production-based emissions from domestic demand, emissions from exports and imports respectively.
Non-competitive consumption-based emissions can be presented by:
C CCECM (11)
Where Crepresents non-competitive
consumption-based emissions, CErepresent non-competitive exports and CMrepresent total imports.
We have not considered direct emissions from households in our paper in line with [67].
3In order to avoid double counting when calculating
consumption-based emissions we have just added emissions from final domestic demand of imported goods instead of emissions from total imports. Because of the fact that embodied emissions from intermediate imports are already been embedded in to final demand categories for domestic goods.
3.
Results
3.1 Emissions from final demand
3.1.1 Category wise emission from final demand of domestic goods
By using equation 6 we can get the embodied emissions from final demand for domestic goods. Final demand for domestic goods can be categorized under two main heads final domestic demand for domestic goods and external demand for domestic goods i.e. exports. Final domestic demand for domestic goods can be further divided in to relevant sub-categories of final demand in our case: Household, Government and Capital formation4. Table 2. Contains the yearly category wise emissions embodied in final demand of domestic goods including both domestic and external demand. Final emissions from government demand of domestic goods is the lowest of all sub-categories from 1995-2009. Embodied final household emissions actually remained greater than embodied exports emissions before exports finally crossed household in 2004 and remained greater until 2009. Meanwhile embodied household emissions moved very closely with embodied capital emissions and actually crossed the capital emissions by small margin during 2000 and 2001. From 2002 onwards the gap between household emissions and capital is ever increasing till 2009. This could be owing to the fact of massive increase in china’s capital formation over the years.
On other hand embodied emissions from exports remained below of that of capital all the time. Overall capital formation with 39% share of all embodied emissions is the biggest contributor towards Chinas emissions from final demand for domestic goods. Followed by embodied emissions from final household demand and final exports with 27% and 26% of all emissions respectively. Least
4 By capital formation we mean capital plus Inventory from
WIOD.
Available online:
http://edupediapublications.org/journals/index.php/IJR/
P a g e | 678share was from government with only 8% of all embodied emissions.
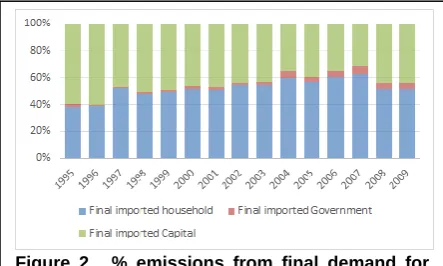
3.1.2 Category wise emission from final demand of imported goods
Author By using equation eight we can get the estimated emissions from final demand for imported goods. China’s emissions from final demand of imported products are actually dropping over the years. Government emissions from final demand of imported goods are the least of all other related sub-categories. Emissions from final capital were greater than final households’ form 1995-1999 with exception of 1997 were embodied emissions from capital fall slightly below of households’ embodied emissions. From 1999 onwards Capital’s embodied emissions became not only less than that of household emissions but also are shrinking overtime. On other hand household emissions are more or less increasing from 1999 onwards with its peak from 2003-2004 at 12020.099, 13071.120 million tons of embodied emissions. Approaching 2009 embodied emissions from household’s final demand for imported goods have declined a bit. Hyped household emissions in first phase could be due to China opening up its markets and the decline (2008-2009) may be related to the fact that more are more foreign companies are now running their operations in mainland China. Household with an average of 52% is the highest contributor towards China’s final imported embodied emissions from 1995-2009. Followed by final capital emissions of 45% while government only contributed 3%.
3.2 Emissions from total and final imports
By using equations eight and nine we can get estimated emissions from final and total imports. China’s emissions from total imports have increased drastically from 1995,s levels. With 1995 emissions at 133.82 million tons, lowest point 1999 at 108.49
million tons and highest point 2008 at 259.73 million tons. From 2004 onwards China’s total imports emission crossed 200 million tons and remained above ever since. On other hand China’s emissions from final imports are constantly decreasing with 1995’s 23.88 million tons to be the highest and 1997 with 14.75 million tons to be the lowest. On other hand emissions from total imports from 2002 onward never fall below 1995 levels and with few exceptions are generally on rise. This has led to ever widening gap between final and total imports. This increasing gap between final and imported goods could be attributed to rapid development of Chinese local industries. Which in return have reduced Chinas’ dependence on finished goods from abroad and increased demand for intermediate imports in the form of raw material and semi-finished goods. Table 2. Contains the details of emissions from total and final imports.
Table 2. Carbon emission from final and total imports (Millions of ton).
Years Final imports Total imports
1995 23.87 133.82
1996 21.06 119.66
1997 14.75 114.66
1998 18.12 115.78
1999 15.83 108.49
2000 14.81 123.84
2001 16.57 117.81
2002 19.70 137.47
2003 22.25 172.99
2004 21.94 210.49
2005 18.40 220.65
2006 17.99 217.97
2007 17.07 226.07
2008 19.53 259.73
2009 19.35 227.48
3.3 Production and consumption-based emissions
By Employment of equations 6,7,10 and 11 will allow us to measure production and consumption-based emissions. Chinas production-consumption-based emissions are always larger than it’s consumption-based. While due to the embodiment of intermediate imports to final demand under our approach production-based emissions are greater than non-competitive production-based and consumption-based emissions are greater than non-competitive consumption-based emissions. It’s obvious that no matter whichever approach is applied for calculating Chinas emissions, production-based emissions are always higher than consumption-based emissions (See figure 1. For details)
Emissions from 1996 to 1997 dropped from 2895.10 million-tons to 2862.13 million-ton for
Available online:
http://edupediapublications.org/journals/index.php/IJR/
P a g e | 679production-based and 2249.07 million-tons to 2358.59 million-ton for consumption based. This decrease in emissions may be triggered by Asian financial crisis which started in 1997 and continued in to 1998 particularly hitting East Asian countries and Hong Kong with minor effects over main land China [75]. With economy stabilizing a bit in 1998 resulted in an increased production and consumption based emissions to 3025.627 and 2447.96 million-tons. Slight reductions in carbon emissions can be observed from 1999-2001, 1999 with the lowest production emissions of 2909.65 million-tons, gradually increasing through years 2000 and 2001 to 2913.89 and 2951.87 respectively but remaining below the levels of 1998.
For consumption based a slightly different pattern can be observed emissions dropped to 2377.04 million-tons during 1999 and keep on declining through year 2000 to 2319.47 million tons this further decline could have been caused due to drop in final imported emissions from 15.83 million-tons (1999) to 14.81 million-million-tons in 2000.Than climbed a bit to 2363.51 million-ton before crossing that of 1998 in 2002 with a total of 2498.14 million-ton. Some scholars partly blame this reduction in emissions from 1997 onwards on Asian financial crisis [76]. But owing to the fact that mainland China was not much affected by Asian financial crisis and it seemed to have back to normal during 1980,s so these reductions are more because of changes in China’s policies towards use of coal and sources of energy [77].After 2002 rapid increase in both production and consumption-based emissions can be observed till 2009. Our results are fairly in line with [54] which shows china’s emissions to be almost constant from 1997- 2002 and a rapid jump in emissions form 2002 onwards. Also almost similar patterns can be observed form the study conducted by [55] and [78]. Production-based emissions though increasing tend to smoothened a bit while approaching 2009.
4.
Discussion
In the wake of growing international pressure its utmost important for China to curb its carbon emissions. For that it has to first fully understand the causes of its carbon emissions and then advise mitigation policies accordingly. If final consumption is the ultimate cause for emissions its utmost vital to fully understand Chinas’ final demand categories and related factors in order to properly device mitigation policies. This paper is an attempt to further understand Chinas’ embodied emissions in to relevant categories of final demand for domestic and imported goods. While China is the main focal point the study was also conducted to point out general lack of splitting embodied emissions into relevant categories i.e. Household, Government and capital for final domestic plus imported goods and services in related literature.
For embodied emissions from final demand for domestic goods. Capital formation was the biggest player with almost 39% of all emissions from 1995-2009 followed by Households, Exports and Government with 27%, 26% and 8% of total emissions. For embodied emissions from final demand of imported goods Household with 52% of total embodied emissions from 1995-2009 was the greatest contributor followed by Capital with 45% while government had almost negligible emission percentage of 3%.
The gap between embodied emissions from final and total imports is ever increasing. The growing gap between embodied final imported and total emissions indicate that China has moved from a primary economy to industrialized economy where it is no longer much dependent on finished products and services instead it will import raw material and/or semi-finished goods and is capable of employing local expertise to convert it in to final product or service as also supported by the constant decrease in Chinas’ emissions from final demand of imported goods. Emissions from final imports actually never have crossed 1995 levels remaining at 88.19%, 61.80%, 75.89%, 66.28%, 62.05%, 69.40%, 82.51%, 93.21%, 91.88%, 77.08%, 75.36%, 71.49%, 81.81% and 81.04% of 1995,s levels from 1996-2009.
Irrespective of the fact which ever approach is adopted China’s production-based emissions are always greater than its consumption based emissions. While emissions from 1995-2002 are fairly constant with few exceptions from 2002 onwards both production and consumption based emissions have drastically increased with ever increasing gap
between production and consumption-based
emissions. This increasing gap between the two approaches could be due to the fact embodied emissions from Chinas exports including both competitive and non-competitive from 1995 onwards
Available online:
http://edupediapublications.org/journals/index.php/IJR/
P a g e | 680have increased much more drastically than that of china’s total imports with an average increase of 172.69%, 164.83% for competitive and non-competitive exports as compared to 126.67% for total imports . While emissions from final demand for imported goods over time actually decreased to 77.00% of 1995,s emission levels. Approaching 2009 this rapid increase trend slowed down a bit for production-based emissions. Production-based embodied emissions are always greater than non-competitive PBA similarly consumption-based are always greater non-competitive CBA.
Future researchers can employ our model to analyze carbon emissions based on final demand at international level, provincial level or city level. Also the historical period studied in our research was from 1995-2009 more current data related to Chinas’ carbon emissions can also be employed.
Acknowledgements
This research was fully supported by the National Social Science Fund Project of China under Grant No. 15BGL175, and Jiangsu Province Social Science Fund under Grant No.15JD038
References
[1] J.-L. Fan, Y.-B. Hou, Q. Wang, C. Wang and Y.-M. Wei, "Exploring the characteristics of production-based and consumption-based carbon emissions of major economies: A multiple-dimension comparison," Applied Energy, p. 790– 799, 2016.
[2] P. Rocchi, M. Serrano, J. Roca and I. Artod, "Border Carbon Adjustments Based on Avoided Emissions: Addressing the Challenge of Its Design," Ecological Economics, vol. 145, p. 126–136, 2018.
[3] M. Jaforullah and A. King, "The econometric consequences of an energy consumption variable in a model of CO2 emissions," Energy Economics, vol. 63, p. 84–91, 2017.
[4] E. G. Hertwitch and G. P. Peters, "Carbon Footprint of Nations: A Global, Trade-Linked Analysis," ENVIRONMENTAL SCIENCE & TECHNOLOGY, vol. 43, p. 6414–6420, 2009.
[5] D. M. Chan, "Cutting carbon, improving health," Lancet, pp. DOI: 10.1016/S01406736 (09)61993-0, 2009.
[6] S. J. Davis and K. Caldeira, "Consumption-based accounting of CO2 emissions," PNAS, vol. 12, p. 5687–5692, 2010.
[7] M. d. P. Pablo-Romero and A. Sánchez-Braza, "The changing of the relationships between carbon footprints and final demand: Panel data evidence for 40 major countries," Energy Economics, vol. 61, p. 8–20, 2017.
[8] K. Kanemoto, D. Moran, M. Lenzen and A. Geschke, "International trade undermines national emission reduction targets: New evidence from air pollution," Global Environmental Change, vol. 24, pp. 52-59, 2014.
[9] L.-S. Lau, C.-K. Choong and Y.-K. Eng, "Investigation of the environmental Kuznets curve for carbon emissions in Malaysia: Do foreign direct investment and trade matter?," Energy Policy, vol. 68, pp. 490-497, 2014.
[10] J. Tian, H. Liao and C. Wang, "Spatial– temporal variations of embodied carbon emission in global trade flows: 41 economies and 35 sectors," Nat Hazards, vol. 78, p. 1125–1144, 2015.
[11] Z. Mi, Y. Zhang, D. Guan, Y. Shan, Z. Liu, R. Cong, X.-C. Yuan and Y.-M. Wei, "Consumption-based emission accounting for Chinese cities," Applied Energy, vol. 184, p. 1073–1081, 2016.
[12] K. Steen-Olsen, J. Weinzettel, G. Cranston, A. E. Ercin and E. Hertwich, "Carbon, Land, and Water Footprint Accounts for the European Union: Consumption, Production, and Displacements through International Trade," Environmental Science & Technology, vol. 46, p. 10883–10891, 2012.
[13] D. Caro, F. M. Pulselli, S. Borghesi and S. Bastianoni, "Mapping the international flows of GHG emissions within a more feasible consumption-based framework," Journal of Cleaner Production, vol. 147, pp. 142-151, 2017.
[14] J.-L. Fan, Y.-B. Hou, Q. Wang, C. Wang and Y.-M. Wei, "Exploring the characteristics of production-based and consumption-based carbon emissions of major economies: A multiple-dimension comparison," Applied Energy, vol. 184, p. 790–799, 2016.
[15] K. Feng, K. Hubacek, L. Sun and Z. Liu, "Consumption-based CO2 accounting of China’s megacities: The case of Beijing, Tianjin, Shanghai and Chongqing," Ecological Indicators, vol. 47, p. 26–31, 2014.
[16] J.-L. Fan, Y.-B. Hou, Q. Wang, C. Wang and Y.-M. Wei, "Exploring the characteristics of production-based and consumption-based carbon emissions of major economies: A multiple-dimension comparison," Applied Energy, p. 790– 799, 2016.
[17] K. Steininger, C. Lininger, S. Droege, D. Roser, L. Tomlinsone and L. Meyerd, "Justice and cost effectiveness of consumption-based versus production-based approaches in the case of unilateral climate policies," Global Environmental Change, vol. 24, pp. 75-87, 2014.
Available online:
http://edupediapublications.org/journals/index.php/IJR/
P a g e | 681[19] D. Guan, J. Lin, S. J. Davis, . D. Pan, K. He, C. Wang, . D. J. Wuebbles, D. G. Streets and Q. Zhang, "Reply to Lopez et al.: Consumption-based accounting helps mitigate global air pollution," PNAS, vol. 111, p. E2631, 2014.
[20] G. P. Peters and E. G. Hertwitch, "CO2 Embodied in International Trade with Implications for Global Climate Policy," Policy analysis, vol. 42, pp. 1401-1407, 2007.
[21] G. P. Peters, "From production-based to
consumption-based national,"
METHODOLOGICAL AND IDEOLOGICAL
OPTIONS, vol. 65, pp. 13-23, 2008.
[22] M. Lenzen, J. Murray, F. Sack and T. Wiedmann, "Shared producer and consumer responsibility — Theory and practice," Ecological Economics, vol. 61, pp. 27-42, 2007.
[23] T. Wiedmann, "A first empirical comparison of energy Footprints embodied in trade — MRIO versus PLUM," Ecological Economics, vol. 68, pp. 1975-1990, 2009.
[24] H. Wang, B. Ang and B. Su, "A Multi-region Structural Decomposition Analysis of Global CO2 Emission Intensity," Ecological Economics, vol. 142, p. 163–176, 2017.
[25] F. Wood, E. Dawkins, A. Bows-Larkin and J. Barrett, "Applying ImPACT: A modelling framework to explore the role of producers and consumers in reducing emissions," Carbon Management, vol. 5, pp. 215-231, 2014.
[26] Y. Yu and F. Chen, "Research on carbon emissions embodied in trade between China and South Korea," Atmospheric Pollution Research, vol. 8, pp. 56-63, 2017.
[27] K. Jayanthakumaran and Y. Liu, "Bi-lateral CO2 emissions embodied in Australia–China trade," Energy Policy, vol. 92, p. 205–213, 2016.
[28] L. Yanmei, F. Jiafeng, M. Zhanyun and B. YANG, "Sources and Flows of Embodied CO2 Emissions in Import and Export Trade of China," Chinese Geographical Science, vol. 24, p. 220–230, 2014.
[29] Z. Zhang, J. Guo and G. J. Hewings, "The effects of direct trade within China on regional and national CO2 emissions," Energy Economics, vol. 46, pp. 161-175, 2014.
[30] L. Huimin and Q. Ye, "Carbon Embodied in International Trade of China and Its Emission Responsibility," Chinese Journal of Population Resources and Environment, vol. 8, pp. 24-31, 2010. [31] X. Jiang and Y. Liu, "Research on the pattern change of carbon emission embodied in international trade and its determinants," Statistical Research, vol. 30, pp. 29-36, 2013.
[32] X. Yang, W. Zhang, J. Fan, J. Yu and H. Zhao, "Transfers of embodied PM2.5 emissions from and to the North China region based on a
multiregional input-output model," Environmental Pollution, vol. 235, p. 381_393, 2018.
[33] Y. Xia and Z. Tang, "The impacts of emissions accounting methods on an imperfect competitive carbon trading market," Energy, vol. 119, p. 67_76, 2017.
[34] R. Xie, G. Hu, Y. Zhang and Y. Liu, "Provincial transfers of enabled carbon emissions in China: A supply-side perspective," Energy Policy, vol. 107, p. 688–697, 2017.
[35] X. Tian, M. Chang, C. Lin and H. Tanikawa, "China’s carbon footprint: A regional perspective on the effect of transitions in consumption and production patterns," Applied Energy, vol. 123, pp. 19-28, 2014.
[36] E. Gemechu, I. Butnar, M. Llop, F. Castells and G. Sonnemann, "CO2 emissions flow due to international trade: multi-regional input–output approach for Spain," Greenhouse Gas Measurement & Management, vol. 4, p. 201–214, 2015.
[37] J.-L. Fan, X. Pan and J.-Q. Li, "Production-based and consumption-"Production-based CO2 transfers among major economies: a flow chart analysis," Energy Procedia, vol. 105, p. 3499 – 3506, 2017.
[38] K. Feng, S. J. Davis, L. Sun, X. Li, D. Guan, W. Liu, Z. Liu and K. Hubacek, "Outsourcing CO2 within China," PNAS, vol. 110, p. 11654– 11659, 2013.
[39] R. Hasegawa, S. Kagawa and M. Tsukui, "Carbon footprint analysis through constructing a multi-region input–output table: a case study of Japan," Hasegawa et al. Journal of Economic Structures, vol. 4, 2015.
[40] T. Wiedmann, M. Lenzen, K. Turner and J. Barrett, "Examining the global environmental impact of regional consumption activities — Part 2: Review of input–output models for the assessment of environmental impacts embodied in trade," Ecological Economics, vol. 61, pp. 15-26, 2007.
[41] B. Lin and C. Sun, "Evaluating carbon dioxide emissions in international trade of China," Energy Policy, vol. 38, pp. 613-621, 2010.
[42] C. L. Weber, G. P. Peters, D. Guan and K. Hubacek, "The contribution of Chinese exports to climate change," Energy Policy, vol. 36, pp. 3572-3577, 2008.
[43] B. Su and B. Ang, "Input–output analysis of CO2 emissions embodied in trade:Competitive versus non-competitive imports," Energy Policy, vol. 56, p. 83–87, 2013.
[44] C. Sun, D. Ding and M. Yang, "Estimating the complete CO2 emissions and the carbon intensity in India: From the carbon transfer perspective," Energy Policy, vol. 109, p. 418–427, 2017.
Available online:
http://edupediapublications.org/journals/index.php/IJR/
P a g e | 682[46] B. Su and B. Ang, "Structural decomposition analysis applied to energy and emissions: some methodological developments," Energy Economics, vol. 34, p. 177–188, 2012.
[47] R. Yuan, T. Zhao and J. Xu, "A subsystem input–output decomposition analysis of CO2 emissions in the service sectors: a case study of Beijing, China," Environment Development Sustainability, vol. 19, p. 2181–2198, 2017.
[48] G. Chen and B. Zhang, "Greenhouse gas emissions in China 2007: Inventory and input–output analysis," Energy Policy, vol. 38, pp. 6180-6193, 2010.
[49] B. Lin and C. Sun, "Evaluating carbon dioxide emissions in international trade of China," Energy Policy, vol. 38, pp. 613-621, 2010.
[50] H. Li, Y. Zhao, X. Qiao, Y. Liu, Y. Cao, Y. Li, S. Wang, Z. Zhang, Y. Zhang and J. Weng, "Identifying the driving forces of national and regional CO2 emissions in China: Based on temporal and spatial decomposition analysis models," Energy Economics, vol. 68, p. 522–538, 2017.
[51] F. Li, Z. Xu and H. Ma, "Can China achieve its CO2 emissions peak by 2030?," Ecological Indicators, vol. 84, pp. 337-344, 2018.
[52] H. Wang, Y. Zhang, X. Lu, C. Nielsen and J. Bi, "Understanding China's carbon dioxide emissions from both production and consumption perspectives," Renewable and Sustainable Energy Reviews, vol. 52, p. 189–200, 2015.
[53] C. Zhou, S. Wang and K. Feng, "Examining the socioeconomic determinants of CO2 emissions in China: A historical and prospective analysis," Resources, Conservation & Recycling, vol. 130, pp. 1-11, 2018.
[54] R. Yuan, P. Behrens and J. F. Rodrigues, "The evolution of inter-sectoral linkages in China's energy-related CO2 emissions from 1997 to 2012," Energy Economics, vol. 69, p. 404–417, 2018.
[55] J. Jiang, B. Ye, D. Xie, J. Li, L. Miao and P. Yang, "Sector decomposition of China’s national economic carbon emissions and its policy implication for national ETS development," Renewable and Sustainable Energy Reviews, vol. 75, p. 855–867, 2017.
[56] D. Guan, K. Hubacek, C. L. Weber, G. P. Peters and D. M. Reiner, "The drivers of Chinese CO2 emissions from1980 to 2030," Global Environmental Change, vol. 18, p. 626–634, 2008.
[57] T.-t. Feng, Y.-s. Yang, S.-y. Xie, J. Dong and L. Ding, "Economic drivers of greenhouse gas emissions in China," Renewable and Sustainable Energy Reviews, vol. 78, p. 996–1006, 2017.
[58] L. Chen, Z. Yang and B. Chen, "Decomposition Analysis of Energy-Related Industrial CO2 Emissions in China," Energies, vol. 6, pp. 2319-2337, 2013.
[59] Y. Zhang, . H. Wang, . S. Liang, . M. Xu, . W. Liu, S. Li, R. Zhang, . P. N. Chris and J. Bi, "Temporal and spatial variations in consumption-based carbon dioxide emissions in China," Renewable and Sustainable Energy Reviews, vol. 40, pp. 60-68, 2014.
[60] D. Zhu, S. Tao, R. Wang, H. Shen, Y. Huang, G. Shen, B. Wang, W. Li, Y. Zhang, H. Chen, Y. Chen, J. Liu, B. Li, X. Wang and W. Liu, "Temporal and spatial trends of residential energy consumption and air pollutant emissions in China," Applied Energy, vol. 106, p. 17–24, 2013.
[61] G. Chen and Z. Chen, "Carbon emissions and resources use by Chinese economy 2007: A 135-sector inventory and input–output embodiment," Commun Nonlinear Sci Numer Simulat, vol. 15, p. 3647–3732, 2010.
[62] D. Streets and S. Waldhoff, "Present and future emissions of air pollutants in China: SO2, NOx, and CO," Atmospheric Environment , vol. 34, pp. 363-374, 2000.
[63] WIOD, "World Input–Output
Database.WIOD, European Commission," 2013.
[Online]. Available:
http://www.wiod.org/database/niots13. [Accessed 10 December 2017].
[64] Aurélien Genty (ed) , "FINAL DATABASE
OF ENVIRONMENTAL SATELLITE
ACCOUNTS: TECHNICAL REPORT ON THEIR COMPILATION," 2012. [Online]. Available: WIOD Deliverable 4.6, Documentation, downloadable at http://www.wiod.org/publications/source_docs/Envir onmental_Sources.pdf. [Accessed 20 December 2017].
[65] M. P. Timmer, E. Dietzenbacher, B. Los, R. Stehrer and G. J. de Vries, "An Illustrated User Guide to the World Input–Output Database: the Case of Global Automotive Production," Review of International Economics, vol. 23, p. 575–605, 2015.
[66] M. Timmer and G. de Vries, "The Construction of World Input-Output Tables in the WIOD Project," Economic Systems Research, vol. 25, pp. 71-98, 2013.
[67] M. Kucukvar, G. Egilmez, N. C. Onat and H. Samadi, "A global, scope-based carbon footprint modeling for effective carbon reduction policies: Lessons from the Turkish manufacturing," Sustainable Production and Consumption, vol. 1, pp. 47-66, 2015.
[68] I. Arto and E. Dietzenbacher, "Drivers of the Growth in Global Greenhouse Gas Emissions," Environmental Science & Technology, vol. 48, p. 5388–5394, 2014.
Available online:
http://edupediapublications.org/journals/index.php/IJR/
P a g e | 683[70] W. W. Leontief , "Quantitative input and output relations in the economic system of the United States," The Review of Economics and Statistics, vol. 18, p. 105–125, 1936.
[71] A. Mattoo, A. Subramanian, D. v. d. Mensbrugghe and J. He, "Trade effects of alternative carbon border-tax schemes," Review of World Economics, vol. 149, p. 587–609, 2013.
[72] J. Elliott, I. Foster, S. Kortum, G. Jush, T. Munson and D. Weisbach, "Unilateral carbon taxes, border tax adjustments and carbon leakage," Theoretical Inquiries in Law, vol. 14, pp. 207-244, 2013.
[73] C. Böhringer, B. Bye, T. Fæhn and K. E. Rosendahl, "Alternative designs for tariffs on embodied carbon: A global cost-effectiveness analysis," Energy Economics, vol. 34 (S2), pp. S143-S153, 2012.
[74] Z. Mi, Y. Zhang, D. Guan, Y. Shan, Z. Liu, R. Cong, X.-C. Yuan and Y.-M. Wei, "Consumption-based emission accounting for Chinese cities," Applied Energy, vol. 184, p. 1073–1081, 2016.
[75] China Daily, "CHINADAILY.com.cn,"
2012. [Online]. Available:
www.chinadaily.com.cn/china/HK15th/2012-06/07/content_15483587.htm. [Accessed 5 February 2018].
[76] D. G. Streets, K. Jiang, X. Hu, J. E. Sinton, X.-Q. Zhang, D. Xu, M. Z. Jacobson and . J. E. Hansen, "Recent Reductions in China’s Greenhouse Gas Emissions," SCIENCE’S COMPASS, vol. 294, pp. 1835-1837, 2001.
[77] J. E. SINTON, "Accuracy and reliability of China’s energy statistics," China Economic Review, vol. 12, p. 373–383, 2001.