Grazing of crested wheatgrass, with particular reference to
effects of pasture size
R.B. HACKER, B.E. NORTON, M.K. OWENS, AND D.O. FRYE
AbStMCt
UtiiiuHon of 8 crested wheatpa pa&Ire wea studied at con- stant docklng rate (3 cattle/ha) in pastures of 1,2,4, and 8 ha, with herd slzea ranging from 3-24 head. Pasture utllizadon on e per- plant basia and estimated forage comumption per bead were signif- icantly lower in the smrllent pestures by the end of the Mal. Complementary trends In overall pesture utiliratlon end llve- weight gain were not significant. V8rl8tlon among replicates for 8 number of pa&we utilization attributes tended to be greatest in l-ha pasturea. Marked difference in animal behaviour were evt- dent among the herds and are hypothesized to account for these dlfferencea. Animal8 selected
l
gahku the smallest plants of crested wheatgress end in favor of trees of higher forage production but no signtficant differences ln unlformlty of utilization among pas- ture sizes were demonstrated.Key Worda: utlltzatlon, herd size
One of the fundamental tenets of range management is that greatest productivity should be achieved when grazing pressure is evenly distributed (Heady 1975, Stoddart et al. 1975, Wilson et al. 1984). On a range with large pastures, more even distribution of use can apparently be achieved by dividing the area into smaller units (Edwards 1981) or by practising rotational grazing (e.g., Booysen and Tainton 1978, Savory 1978, Ogden 1980, Heitschmidt and Walker 1983). However, very few reports have described the differ- ences in level or uniformity of utilization actually achieved with alternative grazing systems. One exception is Hyder and Sawyer (1951), who demonstrated a lower level and more even distribution of use under rotational compared with continuous grazing. We are unaware of any reports which deal explicitly with the effect of pasture size on level or uniformity of utilization.
A very wide range of pasture sizes is evident for grazing studies reported in the literature. The extent to which results may be influenced by such variation is largely unknown. However, when Smoliak (1960) in a 9-year study of deferred-rotation grazing, set stocking rates to obtain a recommended level of use, he found that this level was never achieved, even on the continuously grazed pasture, despite an increase in stocking rate of 60% after the first 2 years.
The objective of the present study was to investigate (1) factors affecting the utilization of crested wheatgrass and (2) animal response over a range of pasture sizes at constant stocking rate.
Materials and Methods
The study was conducted at Utah State University’s research facility on Bureau of Land Management land near Eureka in Juab __ - __ ~_.
Authors arc agricultural adviser, Department of Agriculture, Baron-Hay Court,
South Perth, Western Australia 6151; associate profcrsor, Range Science Dcpart- ment, Utah State University, Logan 84322, current address: Highlands Agriculture Development Project, c/-U..% Embassy, Amman, Jordan,; principal research techni- cian, Range Science Department, Utah State University. Logan 84322, current address is Texas A&M University, Agricultural RncPrch and Extension Cent?, UvaMe 78801; and research technican, Range Science Department, Utah State Um- versity, current address is Department of Forestry and Range, Washington State University, Pullman 99163.
The semor author gratefully acknowledgea study leave support from the Western Australian Department of Agriculture. Appreciation is also expressed to Dr. D. Turner for statistical advice, to Ms. J. Saalfeld and Mr. D. Stockdale for assistance with the computations, and to Dr. D. Ralph for helpful discussions regarding the animal bchavlor observations. The research was supported by the Utah Agricultural Experiment Station, Project 77 I.
Manuscript accepted 21 September 1987.
County, Utah. The site represents a foothill rangeland at an ekva- tion of approximately 1,750 m, normally grazed in spring-early summer. Average annual precipitation is about 320 mm, most of it falling in winter and spring. Soils are loams and sandy loams of the Tintic, Deerlodge, Caiita, Doyce and Juab series. The study site was cleared of native vegetation and seeded with crested wheat- grass (Agropyron desertorum (Fischer ex Link) Schultes and A. cristatum (L.) Gaertner)’ in the early 1950’s. Patches of western wheatgrass (Purcopyrum smithii (Rydb.) A. Love) occur through- out the experimental area of 50 ha but this species made only a minor contribution to total forage production. Big sagebrush (pre- dominantly Artemisia tridentata subspecies tridentata Beetle) occurs in scattered clumps throughout the site while individuals of Utah Juniper (Juniperus osteosperma (Torr.) Little) were present in some of the experitnental pastures.
Three replicates of 4 pasture sizes (1, 2, 4, and 8 ha) were established with electric fencing. Although the location of particu- lar pastures was to some extent determined by physical site con- straints the design was essentially competely randomized. All pas- tures were square or almost so. Each was provided with its own watering point, always located on a fence line and generally in a comer. A constant stocking rate of 3 cattle/ ha was imposed on all treatments; herd size therefore varied from 3 to 24 head. This stocking rate was approximately 3.5 times that normally used under traditional management of these foothill ranges.
Two replicates of each treatment were stocked with Angus heif- ers averaging approximately 270 kg and the third with Angus steers averaging approximately 170 kg. Animals were weighed following an overnight fast before random allocation to pastures on 28-29 April 1985. Due to demands of other experimental programs at the study site, steers were removed after 12 days of grazing. Heifers were removed after 16 days of grazing, by which time the cumula- tive grazing pressure was about equal to that expected during a normal springcarly summer 2-month grazing season. Live weights of fasted animals were obtained following the removal of each group from the trial. Animals had free access to salt blocks, located adjacent to watering points, at ail times.
Immediately prior to the introduction of stock, standing bio- mass of grass species (predominantly crested wheatgrass) was estimated for each pasture and an exclosed area (0.1~ha) by a systematic double sampling procedure using from 50 to 120 quad- rats of 0.5 m*. Approximately 10% of quadrats were clipped. Sample size was always sufficient to produce a standard error <Ia of the estimated mean fresh weight. Moisture content derived from a sub-sample of the clipped plots was used for dry weight calculation.
Pastures were subsequently sampled on 3 occasions, early in the grazing period (days 4-5), approximately mid-term (days 9-lo), and at the completion of the study. Only those pastures grazed by heifers were included in the final sampling. In this phase of the study sample points in all pastures were located, by pacing from specified fenceline positions, on a grid of approximately 20 X 20 m (2 grids in 8-ha pastures). No samples were located within 10 m of a fenceline. Resulting sample sizes (n) were 25 for 1 and 2-ha pas- tures, 64 for 4-ha pastures and 120 for 8-ha pastures.
~Nomcnclature for wheatgrasses follows Barkworth and Dewey (1385).
T&k 1. Mean utiliution acorn for 3 size chra of msted whatgrass at 3 umpling times.
Size class*
Pasture size (ha)
1 2 4 8
S M L s M L S M L S M L
Early 0.7 1.7 1.9 0.5 1.5 1.7 0.8 1.6 1.8 0.8
Pasture mean+ 1.k 1.7a 1.4a
Mid 1.6 3.0 3.1 1.4 3.2 3.8 1.6 3.1 3.1 1.8
Pasturt mean 2.6a 3.2a 2.6a
End** 5.0 5.9 6.0 6.8 7.8 7.6 7.1 7.9 7.7 7.2
Pasture mean 5.8a 7.5b 7.3b
*Plant size claw: S = small; hi = medium; L = large. **Data for 2 replicates grazed by heifera only.
+L.east squares pasture means from covariance analysis. Means within rows followed by the same letter an not significantly different at KO.05.
1.3
:Y 2:6a 7.8 7.3b
1.6
3.4
7.8
At each sample location, identified by row and column numbers of the grid, the following data were collected:
(1) Utilization score for the nearest individual of crested wheat- grass in each of 3 size classes (small, Cl0 cm basal diameter; medium > 10 and Cl5 cm; and large, >15 cm basal diameter). Utilization was rated on a scale of O-10 based on the estimated percentage of current season’s biomass removed. Gaps >5 cm between grass clumps were considered to separate individual plant units.
(2) Vegetation attributes within a 0.5-m* quadrat, namely, utili- zation (estimated as above); foliar cover utilization (on a scale of O-5, based on % foliar cover grazed); total basal cover (%); stand- ing biomass (on a scale of O-5, with fractional scores permitted) and standing old cuhns (on a l-5 scale).
Estimating utilization was assisted by height-weight relation- ships for crested wheatgrass developed by Johnson (1986), while total bakl cover estimates were facilitated by subdivision of the 0.5-m2 sampling quadrat into 50 sub-units. Seedings (individuals with no developed crown) and gaps >5 cm in diameter within old crowns, were considered not to contribute to basal cover. Biomass scores were converted to actual dry weights based on a regression relationship derived from clipped plots and a moisture content factor. The standing culms score was based primarily on the per- centage of the foliar cover which contained old grass culms. How- ever, provision was made for the initial score to be raised or lowered 1 class if the height and/or density of the culms were considered particularly high or low and forage accessibility further reduced or enhanced accordingly_ This provision was invoked for only a small number (<lo%) of quadrats. All of the data described above refer to crested wheatgrass with the exception of standing biomass which included some western wheatgrass. Standing bio- mass of the exclosed area was estimated at the end of the trial period by the technique described in (2) above.
Observations of animal distribution and activity were made on 5 occasions (day 2, morning and afternoon, the evening of day 6, and the morning of days 7 and 11) for the 8 pastures grazed by heifers. One observer was assigned to each “block” of 4 treatments and collected data from 2 pastures at once. Each pair of pastures was observed for 40 minutes during periods of peak grazing activity in the early morning (commencing 0630-0730 h) or the late afternoon (commencing 1830 h).
Animal distribution data were recorded in 2 formats. The number of animals in each quadrant of the pasture was recorded at 5-minute intervals throughout the 40-minute observation period. Second, the approximate location of each individual relative to the rest of the herd was plotted on graph paper at 5- or lo-minute intervals, except on day 2 when plots were made only at the beginning and end of the observation periods. Notes on animal activity (i.e., grazing, watering, etc.) were taken as appropriate for each 5-minute observation.
74
Analytical Procedures
Uniforn&y Indices
Eveness of grazing was described in terms of a texture index (Ahuja and Schachter 1983, p. 254). Uniformity of biomass utiliza- tion (TB) or foliar cover utilization (TC) was determined for all sampling points, except those on the boundary lines of a grid, by summing the absolute differences between the utilization scores of adjacent quadrats for a 3 X 3 unit of the sampling grid. The sum of 12 possible differences comprised the texture index of the central point of the unit. The mean of these indices for each pasture and sampling date was taken as a measure of grazing uniformity; higher mean values imply less uniform grazing.
Anhnal Distribution Statistica
Animal distribution plots were used to determine the area occu- pied by the herd at each 5-minute observation and subsequently mean area per animal. Animal co-ordinates were analyzed by means of a convex polygon procedure which defined the “min- imum area” boundary of the herd distribution and calculated the area within it (Samuel et al. 1983). Observations were rejected for this analysis if all animals in a herd had not been plotted (due to visibility problems) or non-grazing activity was obviously influenc- ing distribution.
Data for numbers of animals within pasture quadrants were used to calculate indices of animal distribution based on the x2 statistic. Within any 40-minute observation period, the total number of animal-minutes in each quadrant was calculated from the 5-minute observation records. Individual animals, or 5-minute observation periods, were eliminated from the analysis if non- grazing activity, such as watering, was obviously influencing dis- tribution. Values of Xz were calculated on the hypothesis of uni- form distribution of total animal time among quadrants. Data for 2-, 4, and 8- ha pastures were first scaled by pasture size to avoid the problem of increasing sample size (total animal-minutes) across treatments and to ensure comparability of the indices. Forage Consumption and Ungued Yield
For each of the 3 samplings following introduction of cattle, quadrat estimates of utilization and standing biomass were used to calculate estimates of total forage consumption per head and the expected ungrazed yield for each pasture. During the short period of the trial, early in the growing season, decomposition was assumed to be negligible and forage disappearance was attributed solely to grazing. The percentage of the ungrazed yield which had been removed to the time of sampling was taken as the mid point of the range represented by the utilization score. The complement of this value (100 - utilization %) was therefore regarded as the percentage of the ungrazed yield represented by the standing bio- mass remaining in the quadrat. Consumption was calculated as the difference between the standing biomass remaining and the calcu- lated ungrazed yield. Although pasture growth was active during the study period, regrowth of grazed plants was minimal (see Results) and presented no difficulties in estimation of utilization.
Since western wheatgrass dominated only a few, low-biomass quadrats and remained virtually ungrazed throughout the study, its inclusion in the biomass estimates was considered not to preju- dice these calculations seriously.
statistical Analysis
Data for per-plant and quadrat utilization, over the whole study, were analyzed by least squares anaysis of covariance. The models employed included main effects and their interactions, and a number of covariates including initial pasture biomass, pasture basal cover, initial animal live weight, sex (as a binary attribute), and number of animals. Data for forage consumption per head and % plants grazed were analysed by similar models for each time of sampling. Data for % plants grazed were subjected to angular transformation prior to analysis. Liveweight gain was analysed by a model which included initial liveweight, sex, and days of grazing as covariates. Models used for analysis of mean area per animal data (heifers only) and texture indices did not include covariates as these were considered unlikely to have exercised a major influence on these variables. Differences among treatments in all cases were detennined by the least significant difference (LSD) method.
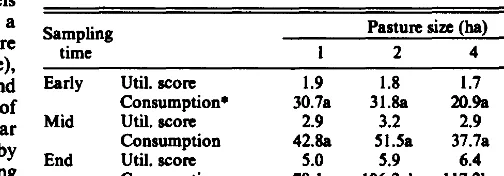
Table 2. Mean rora for Momau (quadrat) utilkation end atlmated totd forage coneumptioll per bead (kg) of crested wbeetgwe at 3 Mmpull~ tima. Differcncu in utilhtion between putura were not dgnifkant. Forage cooeumptlon vahwe ere kut equrva memu from covuience melyell; meme witbin rowe fdlowed by tbe eeme Ma are not dgoifl- cently different at lYO.05.
Sampling Pasture size (ha)
time 1 2 4 8
Early
Mid
End
Util. score Consumption+ util. score Consumption Util. score Consumotion
1.9 1.8 1.7 1.6
30.7a 31.8a 20% 15.5s
2.9 3.2 2.9 3.2
42.8a 51.5a 37.7a 41.9a
5.0 5.9 6.4 6.4
79.la 106Ab 117.2b 122.2b
+E.v~imatcd total fongc consumption per hepd (kg) to time of sampling.
Relationships between utilization and pasture attributes were further analysed by correlation procedures.
Results
Differences among pasture sizes, and the pasture size X time interaction, were not significant for either the TB or TC index (Table 3). Changes over time were significant (KO.01) for the TC index but not for TB. The latter either increased or remained stable over time for 9 of the 12 pastures, in contrast to the coefficient of variation of (quadrat) biomass utilization scores which decreased over time in all pastures.
Pasture Growth and Utilization
Dry matter yield of crested wheatgrass in the exclosed area increased from 194 kg/ ha to 582 kg/ ha over the trial period. Little regrowth was observed in grazed pastures. Some elongation of grazed tillers was apparent at the final sampling, but production of secondary tillers was not evident.
Tabk 3. Texture indkal for biomw (TB) and fotiu cover (TC) utilizations at 3 e8mpUng timer.
Data for utilization of individual plants in 3 size classes are presented in Table 1. Utilization scores differed between size classes (p<O.OOl), times of observation (KO.OOl), and pasture sizes (KO.05). Over the study as a whole, medium and large plants were grazed to approximately the same degree, and more heavily than the smallest size class. Least squares utilization means for the small, medium, and large plants were 2.9,4.0, and 4.1 respectively. The interaction between pasture size and time (P= 0.057) reflected a trend towards heavier utilization in the larger pastures as the study progressed. By the final sample, utilization in the l-ha treat- ment was significantly lower than in the other pastures.
Sampling Pasture size (ha)
time Index 1 2 4 8
Early TB 17.67 15.85 17.82 16.52
TC 16.63 11.89 16.81 15.00
Mid TB 17.93 16.00 21.15 18.86
TC 13.33 15.26 16.60 15.41
End :: 15.61 18.00 16.63 19.93
7.50 5.45 3.95 1.45
ISee text for description of the 2 texture indicts.
Rehtiombip Retween Utilization and Pasture Attributea
For both early and mid-term samples, % plants grazed differed significantly between plant size classes (KO.01). Least squares means (back-transformed) for the small, medium, and large size classes respectively were 36.8,69.1, and 75.7% for the early sample and 70.1,97.3 and 99.6% for the mid-term sample. Pasture size had no significant effect on TO plants grazed at either sampling. By the end of the study virtually all plants had received some degree of utilization in the pastures grazed by heifers although in all treat- ments the smallest size class had the lowest percentage. Analysis of per-plant utilization data excluding ungrazed plants revealed essentially the same relationships as the analysis for whole sample data (above) but the treatment differences were less pronounced. Least squares utilization means for small, medium, and large plants in this case were 3.6,4.3, and 4.4 respectively.
Correlations between quadrat estimates of biomass utilization and total basal cover, ungrazed yield and old standing grass culms were calculated for each of the 32 data sets available (pastures X replicates X times). Biomass utilization and basal cover were signif- icantly correlated (KO.05) in only 6 of the 32 sets with significant r values ranging from 0.238 to -0.4%.
The correlation between utilization and ungrazed yield was sig- nificant (KO.05) for 26 of the 32 sets. Correlations were always positive and significant r values ranged from 0.297 - 0.861. Corre- lations increased substantially from the early to the final sampling in 7 and the 8 pastures for which data were available at these 2 times, the minimum change being from r = 0.450 (KO.001) to r = 0.686 (KO.001). In the remaining pasture the correlation decreased from r = 0.682 (KO.001) to r = 0.298 (NS).
The effect of pasture size on whole pasture (i.e., quadrat-based) utilization was not significant (p>o. 10). Mean (quadrat) biomass utilization scores (Table 2) indicate that, as with individual plants, utilization in the larger pastures tended to increase over time relative to the smaller pastures; in this case, however, the interac- tion was not significant (p>o. 10). Differences in total forage con- sumption per head among pasture sizes (Table 2) were not signiti- cant for either the early or mid-term samples. By the end of the study, however, consumption in the l-ha pastures was significantly lower than in the 4- and 8- ha treatments, while the difference between I- and 2- ha pastures just failed to achieve significance at Pco.05.
The correlation between utilization and standing culms was significant (KO.05) for 8 of the 32 data sets and was apparently influenced by time. No significant correlations were observed for the early sample while correlations were significant for 3 of the 12 data sets at the mid-term sample and for 5 of the 8 data sets at the final sample. Correlations were always negative and significant r values ranged from -0.192 to -0.507.
Animal D&tribution and Weight Gain
Preliminary analysis of mean area/animal data for 5 sampling dates indicated no significant time X treatment interaction. Data were therefore pooled for the 2 observation periods on day 2, to represent the “early grazing period”, and for the observations on days 6,7 and 11, to represent the “late grazing period” when any
influence of exploratory behaviour on animal distribution could be assumed to be negligible. Mean area per animal differed signifi- cantly (KO.001) among pasture sizes due to the significant increase over time in the 8-ha pastures (Table 4). Although differ& ences between the 1-, 2-and 4-ha pastures were not significant, the
Table 4. Mean area per animal (m*) for 4 pasture sizes. Means within botb rows and cdumns followed by the same ktter are not signifkantiy different at PCO.05 for individuai grazing periods. Overaii mans foi- iowed by the same ktter are not signifidy dtfferent X0.05.
l(3)*
pasture size (ha) 2(61 4121 8124) Early grazing period
Late grazing period Overall
*Herd aim in parentheses.
5.3a 31.4a 35.6a 97.9a 3.2a 21.4a 42.2a 241 .Ob 4.2a 29.4a 38.9a 169.4b
impression from tield observation was that animals became pro- gressively more dispersed across these treatments.
Chi-square values for animal distribution in the early and late grazing periods are detailed in Table 5 based on data pooled over replicates and times of observation. Values have been adjusted for sample size (replicates and number of observations) and are thus comparable across the 2 grazing periods. The most notable feature
Table 5. Chi square values for animal distribution between pasture qud- rants in the early and iate pazing periods.
Early grazing period Late grazing period
*Herd size in parentheses.
i(3)’
22.1 19.4
Pasture size (ha)
2(6) 4(i2) 8(24)
42.2 32.2 6.0 27.1 45.4 40.9
of these data is the substantial change with time for the 8-ha pastures. In the early grazing period, animals in these pastures moved fairly rapidly, resulting in a more uniform coverage of the pasture over the 40-minute observation period than for smaller pastures. Subsequently this activity was reduced and although individual animals were more widely spaced (Table 4), the herd was a less mobile unit, and distribution over the pastures during an observation period became considerably less uniform. In contrast, animal distribution in the smallest pastures changed little over time.
Qualitative behavioural differences between herds were also noted during the observation periods, and informally during the course of the study. In the early grazing period, animals in all groups watered as a complete herd whenever watering was observed. This strong group watering behaviour was retained throughout the study in the case of the 3-animal (l-ha) herds but diminished considerably over time in the larger herds, particularly in the 24animal(8ha) treatments, where small groups were com- monly observed to water independently of the rest of the herd in the late grazing period. Grazing time also appeared to differ markedly between the 3- and 24-animal herds. In the latter, grazing activity by at least a few animals could be observed at virtually any time of day while animals in the former, especially in one replicate, were observed to spend much time resting between morning and evening feeding periods. Intermediate responses were apparent in the 6-and
12-animal herds.
Least squares means for weight gain per head were 10.9, 12.0, 13.7, and 14.1 kg for the l-, 2-, 4-, and 8- ha pastures respectively. The corresponding figures for average daily gain were 0.58,0.69, 0.99, and 1.02 kg/ head/ day. However, differences between pasture sizes were not significant in either case (RX. 10).
Variation Among Replkates
A feature of the data collected in this study was a tendency for variation among replicates to decline at larger pasture sizes. This tendency is evident from Table 6, in which the variation among replicate means is represented as the treatment coefficient of varia- tion (CV).
Table 6. Coeffkknts of varktion (96) of some measured varkbks.
Variable
Pasture size (ha)
Time* 1 2 4 8
Utilization large plants
Utilization whole pasture
TB
Live weight gain Initial Biomass (a) Initial Biomass (bj
I 11.53 2 23.11 3 41.76 1 15.02 2 24.10 3 52.82 1 32.48 : 30.71 12.75
- 8.53 24.49 16.24
10.38 38.79 14.08 15.74 27.41 7.70 9.28 7.69 1.00 14.19 32.74 13.60 20.65 43.02 9.07 13.81 20.64 8.27 42.41 2344 13.70 39.26 1.87 2.97 27.97 48.52 7.63 35.59 29.69 13.62 14.77 26.51 24.06 13.78 35.65 2.27
* I = Early; 2 = Mid; 3 = End
(a) W’s for initial standing biomass prior to gmzin (b) CVb for initial standing biomass prior to pain 3 observations (i.e. the replicates stocked mh he
f fr replicates contributing to time crs)
For two-thirds of the comparisons, the least variation among replicates occurred in the 8- ha treatment. In these pastures Cv’s for utilization variables tended to decrease with time while those for the l-ha pastures tended to increase.
The CV’s for initial biomass in Table 6 indicate that these trends do not simply reflect the original variation among replicates, although the low CV for initial biomass in the 8- ha pastures stocked with heifers may contribute to the low CV’s for data from this treatment collected at the third sampling time.
Trends similar to those described above were also evident for other variables not described in detail here. The trends in CV for small and medium plants were similar to those for large plants (Table 6). Data for TC and total forage consumption per head reflected the trend towards increased CV’s for the l-ha treatment with time, although for these variables minimum CV’s were not always obtained from the 8-ha pastures.
Discussion
Earlier studies of utilization pattern by Norton and Johnson (1981,1986) on the same crested wheatgrass pasture indicated that cattle preferentially grazed intermediate sized plants, and that severity of defoliation was inversely related to plant size. In the present study, however, cattle selected only against the smallest size class, particularly at the first 2 sampling times, and there was no inverse relationship between plant size and severity of defolia- tion. The differences in these results may be related to the grazing pressures employed. The stocking rate in this pasture size experi- ment was more than 3 times the rate used by Norton and Johnson, and the experiment was initiated earlier in the growing season with less initial forage on offer. While Norton and Johnson (1981) reported that at the end of a six-week grazing period, 2540% of all plants remained ungrazed, in our study more than 90% of all plants were grazed after 16 days. Also, the inhibiting effect of old standing grass culms which can depress utilization, especially of larger plants (Norton et al. 1982), was not a major factor in the present study, which could explain why we found no inverse relationship between plant size and level of plant utilization (Table 1).
The frequent correlations between biomass utilization and ungrazed yield, together with the trend in these correlations over time, indicate selection for portions of the pasture with higher forage production, especially when overall use levels are relatively
high. Since animals also selected against the smallest plants, they appear to discriminate on both an area and an individual plant basis even within these almost monospecific pastures. Selection of this type is likely to maximize dry matter intake for energy expended in grazing.
Uniformity of grazing did not differ significantly among pasture sizes with respect to either the biomass index or the cover index. Over time, grazing in all treatments became considerably more uniform with respect to the percentage of foliar cover grazed (TC). In contrast TB in most pastures either remained static or increased over time, indicating that use became more uneven as the study progressed, even though there was a consistent decline, in all pastures, in the coefficient of variation of biomass (quadrat) utili- zation scores. Thus while the percentage of biomass removed became less variable among the quadrats of a pasture as the level of utilization increased, considerable spatial heterogeneity remained and was exaggerated in many cases, similar to the patchiness reported by Ring et al. (1985). This phenomenon probably reflects the tendency of animals to select areas of higher forage production as the overall availability of forage declined, so that TB became increasingly determined by spatial heterogeneity within the pasture itself.
Chi-square values indicate that animal distribution was most uniform in the early grazing period in the g-ha pastures (Table 5). This uniformity was due to more rapid movement around the pasture rather than a wider dispersion of the herd (Table 4). Such activity probably represents an exploration phase, which was apparently more prolonged in the largest pastures.
Marked differences in animal behavior among the herds are reflected in the significant treatment differences in mean area/ animal (Table 4). Animals in the l-ha pastures always remained in close proximity and moved as a tightly knit unit, while animals in the larger herds were more dispersed, particularly in the g-ha pastures in the latter part of the study. This dispersal of animals in the larger herds indicates diminishing group cohesion and greater individual independence, as expressed, for example, in watering behaviour and sporadic grazing activity during non-peak periods. Since stocking rate, and hence area available per animal, was constant across all pastures, these differences may be attributed either to factors associated with herd size or to the influence of pasture size. These 2 variables are confounded in the present study.
These observations cast doubts on the utility of grazing studies with cattle involving small pastures and small herds. Significant reductions in forage utilization on a per-plant basis (Table 1) and forage consumption per head (Table 2) in the smallest pastures may reflect behavioural differences related to herd size. Animal performance and grazing pressure achieved with small herds may be lower than that expected at the nominal stocking rate, while variation among replicates may be considerably increased (Table 6), thus impeding the detection of treatment effects. In his 1985 review, however, Allison did not report any studies in which herd size per se affected animal intake.
Herd sizes of only l-3 animals were recommended by Mott and Lucas (1952) for grazing studies, while Peterson and Lucas (1960) thought that 2-5 animals would be optimum for quantitative assessment of grazing trials. There is an extremely wide range of pasture and herd sizes reported in published grazing studies. How- ever, small pastures and grazing units of only 2 or 3 cattle are not uncommon (e.g., Fisher and Marion 1951, Allison et al. 1982, Kirby et al. 1982, Holt et al. 1986, Ralphs et al. 1986). Although we are not able to derive an optimum herd size from the present study, our data and observations suggest that herds of 3 animals are too small for grazing research.
Conclusions
Grazing in the pastures studied was influenced by plant size and spatial distribution of forage. Animals discriminated against small plants and, especially when the general level of use was high,
favored areas of the pasture which produced more forage. Pasture size did not significantly affect overall pasture utiliza- tion, uniformity of utilization, or animal weight gain. Uniformity of utilization was related to level of utilization. Estimated forage consumption per head, however, was significantly less for the smallest pasture, as was utilizization on a per-plant basis. These results suggest that the trend in animal weight gain towards more animal production as pasture size increased may have become statistically significant if the study had continued.
The most notable treatment effect observed in this study was the difference in animal behaviour. The pasture size effect is con- founded with herd size in this experiment, but herd size appears to be the primary variable influencing animal behaviour and, we hypothesize, pasture utilization and animal performance.
These observations have considerable implications for the design of grazing studies, especially with respect to herd size and number of replications. Behaviour in a herd of 3 cattle is likely to be atypical. Variability in pasture utilization, even in pastures of only 1 ha, is also likely to increase with small herds.
Literature Cited
Abuja, N. and B.J. Scbachter. 19113. Pattern models. John Wiley and Sons, Inc. New York.
Allison, C.D. 1985. Factors affecting forage intake by range ruminants: a review. J. Range Manage. 38:305-311.
A&on, C.D., M.M. Kothmauu,aud L.R. RBteuhouse. 1982. Efficiency of forage harvest by grazing cattle. J. Range Manage. 35351-354. Barkwortb, M.E., and Dewey, D.R. 1985. Genomically based genera in the
perennial Triticeae of North America: Identification and membership. Amer. J. Bot. 72767-776.
Booysen, P. de V., and N.M. Tainton. 1978. Grassland management: principles and practices in South Africa. P. 551-554. In: D.N. Hyder, (ed.) Proc. First Inter. Rangeland Congr. Sot. Range Manage., Denver, Cola.
Edwards, P.J. 1981. Grazing management. P. 323-354. In: NM. Tainton, (ed). Veld and pasture management in South Africa. Shuter and Shooter, Pietermaritzburg, South Africa.
Filer, C.E., and P.T. Marion. 1951. Continuous and rotation grazing on buffalo and tobosa grassland. J. Range Manage. 448-5 I.
Heady, H.F. 1975. Rangeland management. McGraw-Hill Book Co., New York.
Heitschmidt, R., and J. Walker. 1983. Short duration grazing and the Savory grazing method in perspective. Rangelands 5:147-150. Holt, N.W., T. Lawreuee, and M.R. Kikha. 19116. Effect of time ofgrazing
in in first crop year on subsequent productivity of Russian wildrye. J. Range Manage. 39:513-514.
Hyder, D.N., and W.A. Sawyer. 1951. Rotation-deferred grazing as com- pared to season-long grazing on sagebrush-bunchgrass ranges in Oregon. J. Range Manage. 4:30-34.
Johnson, P.A. 1986. Utilization of plants of crested wheatgrass by cattle under several grazing regimes. Ph.D. diss., Utah State University, Logan.
Kirby, D.R., M.D. Parman, TJ. Conlon, and P.E. Nyren. 1982. Short duration grazing in the mixed grass prairie of North Dakota. P. 186-189. Proc. Nat. Conf. Grazing Manage. Technology. Texas A and M Univ. Mott, GO., and ILL. Lucas. 1952. The design, conduct and interpretation
of gtazing trials on cultivated and improved pastures. Proc. VI Inter. Grassl. Congr. 2:1380-1385.
Norton, B.E., and P.S. Johnson. 1981. Patterns of defoliation by cattle grazing crested wheatgrass pastures. Proc. XIV Int. Grassl. Cong., Lex- ington, K. P. 462464.
Norton, B.E., and P.S. Johnron. 1986. Impact of grazing on crested wheat- grass in relation to plant size. p. 275-279. In: K. Johnson (ed.) Crested Wheatgrass: Its Values, Problems and Myths; Symp. Proc. Utah State Univ., Logan.
Norton, B.E. P.S. Johnson, C. Smith, and M.K. Owens 1982. Spatial distribution of utilization by cattle grazing crested wheatgrass pastures. P. 199-200. Proc. Nat. Conf. Grazing Manaae. Technology. Texas A&M Univ.
Ogden, P.R. 1980. Meeting the physiological requirements of a plant with grazing systems. P. 3748. In: K.C. McDaniel and C. Allison. (eds). Grazing Management Systems for Southwest Rangelands. A Sympo- sium. New Mexico State Univ., Las Cruces.
Peterson, R.C., and ILL. Lucas. 1960. Experimental errors in grazing trials. Proc. VIII Int. Grassl. Cotta. 8747-750.
Ralphs, M.H., M.M. Kothmmm, a&l L.B. Merrill. 1986. Cattle and sheep diets under short-duration grazing. J. Range Manage. 39217-223. Ring, C.B., R.A. Nicholson, and J.L. Launchbaugb. 1985. Vegetational
traits of patch-grazed rangehind in west-central Kansas. J. Range Man- age. 3851-55.
Samuel, D.M., D.J. Pierce, E.O. Carton, L.J. Nelson, and K.R. Dixon. 1983. User’s Manual for Program HOME RANGE. Univ. of Idaho Forest, Wildlife and Range Exp. Sta. Tech. Rep. 15. Moscow. Savory, A. 1978. A holistic approach to ranch management using short
duration grazing. P. 555-557. In: D.N. Hyder, (ed.). Proc. First Inter. Rangeland Congr. Sot. Range Manage. , Denver, Colo.
Smolhk, S. 1960. Effects of deferred-rotation and continuous grazing on yearling steer gains and shortgrass prairie vegetation of Southeastern Alberta. J. Range Manage. 13:239-243.
Stoddut, L.A., A.D. Smith, and T.W. Box. 1975. Range management (3rd cd.). McGraw-Hill Book Co., New York.