International Journal of General Medicine
Dove
press
O r I G I n A L r e s e A r c h
open access to scientific and medical research
Open Access Full Text Article
Olfactory dysfunction in Parkinson’s disease:
Benefits of quantitative odorant examination
Yuji Kawase1
Kazuko hasegawa2
noriko Kawashima3
emiko horiuchi2
Ken Ikeda1
1Department of neurology, Toho
University Omori Medical center, Tokyo; 2Department of neurology,
sagamihara national hospital, Kanagawa; 3Kawashima neurology
clinic, Kanagawa, Japan
correspondence: Ken Ikeda Department of neurology, Toho University Omori Medical center, 6-11-1, Omorinishi, Otaku, Tokyo, 143-8541, Japan Tel +81 337 624 151
Fax +81 337 682 566 email [email protected]
Abstract: Olfactory involvement is well recognized in patients with Parkinson’s disease (PD). The purpose of this study was to examine smell function quantitatively, using different types and concentrations of odorants in PD patients. We aimed to elucidate whether a specific odor can affect the severity and duration of PD patients. A total of 89 nondemented PD patients and 20 age-matched controls participated in the study. Quantitative evaluation of smell function was performed using the T and T olfactometer test. This test contains five kinds of odorants at different concentrations. Recognition threshold (RT) scores for all five odorants and for each individual odorant were measured in five groups of PD patients with Hoehn and Yale (HY) stages I (n = 12), II (n = 24), III (n = 43), and IV (n = 10), as well as in control subjects (n = 20). One-way analysis of variance and Ryan’s method were used for statistical comparison between the five groups. Compared with controls and HY I patients, total RT scores were significantly higher in HY II, III, and IV patients. There were no statistically significant differences in RT scores between HY I patients and controls. However, total RT scores for three HY I patients (25%) were higher than the mean + two standard deviations of controls. On single odorant testing, significant higher RT scores for methylcyclopentenolone and skatol were found in HY II, III, and IV patients, in comparison with controls and HY I patients. The remaining three odorants did not differ statistically between PD patients and control subjects. The present study indicated that hyposmia in PD patients increased from HY II onwards. A single odorant of methyl cyclopentenolone or skatol had benefits for olfactory evaluation in PD patients. Our data also clarified that olfactory deficits occurred in a subset of HY I patients. Further prospective study is needed to elucidate whether a distinct profile of PD exists between HY I patients with and without hyposmia.
Keywords: Parkinson’s disease, Hoehn and Yale stage, olfactory dysfunction, odorants
Introduction
Olfactory impairment in Parkinson’s disease (PD) was first described by Ansari and Johnson.1 The frequency of olfactory dysfunction is 70%–90% in PD patients,2 and
rates of hyposmia correspond to presence of tremor.3 Neuropathologic research in PD
patients suggests neuronal damage in the olfactory system, including the olfactory bulb and the anterior olfactory nucleus.4 There have been many studies of the relationship
between olfactory deficits and PD progression.5–8 Several studies showed that PD
progression was correlated with olfactory dysfunction.6–8 Tissingh et al7 pointed out that
odor discrimination was negatively associated with the Unified Parkinson’s Disease Rating Scale (UPDRS) and Hoehn and Yale (HY) stage. This suggests that olfactory tests may have benefits for early diagnosis of PD. Previous olfactory tests used single or
International Journal of General Medicine downloaded from https://www.dovepress.com/ by 118.70.13.36 on 22-Aug-2020
For personal use only.
Number of times this article has been viewed
This article was published in the following Dove Press journal: International Journal of General Medicine
Dovepress Kawase et al
several kinds of odorants.5–8 The T and T olfactometer (TTO)
test is a quantitative smell test that contains five odorants and different concentrations of each odorant. The present study was designed to evaluate how useful TTO is as a tool for detection of hyposmia in PD patients and the relationship between hyposmia and disease progression.
Methods
PD patients and control subjects
PD was diagnosed according to the UK Parkinson’s Disease Society Brain Bank criteria.A total of 89 patients with PD and 20 age-matched healthy controls participated in the study (see Table 1). Mean age (± standard deviation, SD) was 69.1 (7.1) years in PD patients and 68.3 (8.2) years in controls. Mean disease duration was 5.6 (4.6) years. PD severity was classi-fied by HY criteria, and mean HY stage was 2.5 (0.9). Patients were categorized as HY I (n = 12), II (n = 24), III (n = 43) and IV (n = 10). PD patients with dementia, defined accord-ing to Mini Mental State Examination scores lower than 22 points, were excluded. Before the smell examination, all PD patients had had an otorhinolaryngology consultation, and those with suspected rhinologic disorders underwent further examination, including nasal endoscopy. PD patients and control subjects who had severe rhinologic disease causing respiratory hyposmia, such as chronic or acute sinusitis, allergic rhinitis, nasal polyps, tumors, or severe septal devia-tion were excluded. PD patients with olfactory hallucinadevia-tions on rhinologic examination were also excluded. The present study was performed and approved according to the clini-cal guidelines of Sagamihara National Hospital. Informed consent was obtained from all study participants.
Quantitative olfactory test
Olfactory function was evaluated using the TTO test (Takasago Co., Tokyo). Olfactory examination was undertaken in a special odorless room. The temperature of the room was adjusted to 23°C. Adequate air ventilation was maintained. Previous data show that the results of this test have a good correlation with the University of Penn-sylvania Smell Identification Test (UPSIT).9 The TTO test
used five kinds of odorants, comprising A (β-phenyl ethyl alcohol), B (methyl cyclopentenolone), C (isovaleric acid), D (γ-undecalactone), and E (skatol). The A odor was rose-scented (“rose”), B charred (“caramel”), C rancid (“putre-faction”), D peach-like (“peach”), and E halitosis-like (“feces”). Seven or eight sequential dilutions of each odor-ant were prepared. Each odorodor-ant was judged by a numeric score of -2–5 according to its concentration. Each odor test was performed gradually from the lowest concentration (-2) to higher concentrations. The subject was asked to sniff a paper edge soaked in an odorant and to describe the nature of the odor. Recognition threshold (RT) was defined as the lowest concentration at which a subject described the type of odor correctly. A patient could answer “rose” or “sweet-scented flower” for the odorant A test. Similarly, the correct response to odorant B was “caramel” or “burnt sugar”. Odorant C could be answered as “rancid”, “rotten food” or “sweaty clothes”. Odorant D could be answered as “peach-like” or “sweet fruit”. Odorant E could be answered as “halitosis-like”, “feces” or “kitchen”. The test was repeated from odorant A to E in sequence. When a patient failed to identify the odor at the highest possible concentra-tion of odors A to E accurately, the score was determined as six points. Total RT was calculated as the average of five odorant scores ([A + B + C + D + E]/5). A larger RT value indicated more severe olfactory dysfunction. The detection threshold (DT) of the TTO test was assessed only by the presence or absence of smell. Therefore, DT did not can-vas the correct type or character of each odorant. DT was therefore not used for quantitative evaluation of olfactory function in this study.
statistical analysis
All data were shown as mean (SD). One-way analysis of variance (ANOVA) and Ryan’s method were used to compare RT scores for the four PD groups of HY I–IV patients and the control group. After one-way ANOVA, Ryan’s method was performed for multiple comparisons. The level of significance was set at P , 0.05 for both tests.
Table 1 Clinical profile of Parkinson’s disease patients and control subjects
Control (n = 20) Total HY I (n = 12) HY II (n = 24) HY III (n = 43) HY IV (n = 10)
Male/female 5/15 35/54 5/7 11/13 16/27 3/7
Mean age (sD) years 68.3 (8.2) 69.1 (7.1) 68.2 (6.8) 67.0 (7.8) 70.5 (7.9) 69.5 (9.5) Mean duration of PD (sD) years 5.6 (4.6) 1.9 (1.6) 4.8 (3.6) 5.8 (4.4) 11.0 (5.6) Mean MMse score (sD) 27.6 (2.2) 25.8 (2.8) 26.8 (2.9) 26.0 (3.1) 25.1 (2.3) 25.8 (2.9) Abbreviations: hY, hoehn and Yale; MMse, mini-mental state examination; PD, Parkinson’s disease; sD, standard deviation.
International Journal of General Medicine downloaded from https://www.dovepress.com/ by 118.70.13.36 on 22-Aug-2020
Dovepress Olfactory assessment in Parkinson’s disease
Results
The mean value (SD) of total RT scores were 2.6 (0.6) in control subjects, 2.1 (1.5) in HY I, 3.8 (1.2) in HY II, 3.9 (1.4) in HY III, and 3.9 (1.6) in HY IV patients (Figure 1). Total RT scores were significantly higher in the HY II, HY III, and HY IV groups compared with the control group and the HY I group (F = 8.154, P , 0.001 by one-way ANOVA, P , 0.01 by Ryan’s method). These results suggest that olfactory dysfunction occurred in PD patients with HY II disease onwards. Three HY I patients (25%) had higher than the mean + 2 SD total RT scores for controls. Mean RT scores of odorant A were 3.4 (1.4) in controls, 3.3 (2.7) in HY I, 4.8 (1.8) in HY II, 4.8 (1.8) in HY III, and 4.0 (2.3) in HY IV patients. These scores did not differ between the four groups of HY I–IV patients and controls (Figure 2A). Mean RT scores of odorant B were 2.2 (1.3) in controls, 1.8 (1.8) in HY I, 3.9 (1.7) in HY II, 3.9 (1.6) in HY III, and 4.6 (1.5) in HY IV patients
Total RT score
6
4
2
0
Controls HY I HY II HY III HY IV
*† *† *†
Figure 1 Total RT scores of five odorants in PD patients and control subjects.
compared with controls or hY I patients, total rT scores were higher in hY II, III, and IV patients (F = 8.154 and P, 0.001 by one-way AnOVA).
Notes: *P,0.01 by ryan’s method among the PD subgroups of hY II, III, and IV, and the control group; †P, 0.01 by ryan’s method between the hY I group and other hY
groups.
Abbreviations: AnOVA, one-way analysis of variance; hY, hoehn and Yale; PD, Parkinson’s disease; rT, recognition threshold.
Odor A: β-phenyl ethyl alcohol
6
4
2
0
Controls HY I HY II HY III HY IV
Figure 2A RT score of odorant A. There were no significant differences of odorant A scores between the five groups.
Odor B: methyl cyclopentenolone
6
4
2
0
Controls HY I HY II HY III HY IV
*† *† *†
Figure 2B rT score of odorant B. compared with controls and hY I patients, rT
scores for odorant B were significantly higher in HY II, III, and IV patients. (F = 8.848,
P, 0.001 by one-way AnOVA).
Notes: *P,0.01 by ryan’s method between the PD hY II, III, and IV subgroups and controls; †P, 0.01 by ryan’s method between the hY I group and other hY
groups.
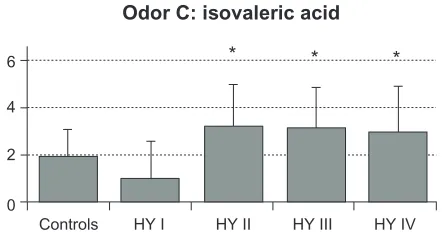
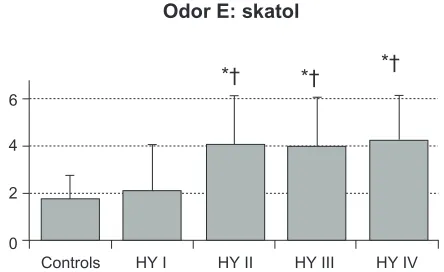
(Figure 2B). RT scores of HY II, III, and IV patients were significantly higher than those of controls and HY I patients (F = 8.848, P , 0.001 by one-way ANOVA, P , 0.01 by Ryan’s method). Mean RT scores of odorant C were 2.0 (1.2) in controls, 1.0 (1.6) in HY I, 3.3 (1.8) in HY II, 3.2 (1.7) in HY III, and 3.0 (1.9) in HY IV patients (Figure 2C). Compared with HY I patients, RT scores of odorant C were increased significantly in HY II, III, and IV patients (F = 16.294, P , 0.001 by one-way ANOVA, P , 0.01 by Ryan’s method). These scores did not differ statistically between any of the four PD subgroups and controls. Mean scores of odorant D were 3.0 (1.3) in controls, 2.6 (2.1) in HY I, 3.0 (1.7) in HY II, 3.7 (1.9) in HY III, and 3.8 (2.2) in HY IV patients (Figure 2D). RT scores of odorant D did not differ significantly between the HY I, II, III, and IV patients and controls. Mean scores of odorant E were 1.8 (1.0) in controls, 2.1 (2.0) in HY I, 4.1 (2.1) in HY II, 4.0 (2.1) in HY III, and 4.3 (2.0) in HY IV patients (Figure 2E). Those scores were significantly higher in HY II, III, and IV patients than in controls or HY I patients (F = 27.876, P , 0.001 by one-way ANOVA, P , 0.01 by Ryan’s method).
Odor C: isovaleric acid
6
4
2
0
Controls HY I HY II HY III HY IV
* * *
Figure 2C rT score of odorant c. compared with hY I patients, rT scores of
odorant C were increased significantly in HY II, III, and IV patients (F = 16.294 and
P, 0.001 by one-way AnOVA).
Note: *P,0.01 by ryan’s method.
International Journal of General Medicine downloaded from https://www.dovepress.com/ by 118.70.13.36 on 22-Aug-2020
Dovepress Kawase et al
Discussion
The present study showed that olfactory function in PD patients declined in a statistically significant manner from HY II onwards. There were no statistically significant differences between HY I patients and controls, although three of 12 patients with HY I had hyposmia in comparison with controls. Comparative analyses of five odorants revealed that odorant B (methyl cyclopentenolone) and E (skatol) were involved in PD patients with HY II–IV. RT scores of odorant C (isovaleric acid) were significantly lower in HY I than in HY II, III, and IV patients, whereas no statistically significant differences existed between the HY stage PD subgroups and controls.
The association between olfactory deficits and PD progression has been controversial in previous reports. On UPSIT, a classical olfactory test, olfactory dysfunction was not correlated with PD severity.5 A recent longitudinal study
found no relationship between olfactory function and PD progression, including patient age, PD stage, and duration. Some PD patients have been found to recover from olfactory deficits on Sniffin Stick testing.10 Other studies have found
a significant association between hyposmia and PD stage.6,7
Olfactory function was shown to be impaired in patients with more than HY III than in those with HY I and II disease.6
Odor discrimination was lost with motor disease progression according to UPDRS and HY classification.7 Serial olfactory
examination using the Sniffin Stick test was performed in five
de novo PD patients. Olfactory function worsened in three
patients, and the degree of hyposmia was attenuated in one patient.8 The present study revealed statistically significant
differences in olfactory function between HY II, III, and IV PD patients and controls. Three HY I patients (25%) also showed hyposmia. Predictive studies of hyposmia in PD have also been reported.11–14 Of 361 asymptomatic Dutch
relatives of PD patients, 40 had hyposmia. After two years of follow-up, four hyposmic relatives (10%) developed PD.12
In another Germany study of 30 patients with idiopathic
hyposmia, PD developed in two patients (7%) during two years of follow-up.13
In addition to those patients with preclinical PD and signs of hyposmia, the present study supports the possibility that smell dysfunction could start in a subset of HY I patients. Previous neuropathologic research has mentioned that dop-aminergic neurons in the olfactory bulb are potentiated in the early stages of PD by a compensatory mechanism against the loss of dopaminergic neurons in the basal ganglia.15 Such
dopaminergic changes in the olfactory bulb may contribute to deteriorating olfactory function in PD patients. Thereafter, dopaminergic neuronal loss occurs in the olfactory bulb, so hyposmia may improve in patients with advanced PD. This hypothesis does not suggest a constant relationship between olfactory function and motor dysfunction in PD patients.
The UPSIT and Sniffin Stick tests use only one concen-tration for each odorant. In these tests, a single odorant is judged by only one response as presence (“yes”) or absence (“no”). Odorants of wintergreen and pizza are distinguish-able on UPSIT, and those odors show more sensitivity and specificity in PD patients.16 The Brief Smell Identification
Test (BSIT), a simplified version of UPSIT, uses five kinds of odorants (gasoline, banana, pineapple, smoke, and cin-namon). This smell test has shown that several odorants could be used to discriminate between PD patients and normal subjects.17 Previous reports of use of these studies
have provided different sensitivities for different types of odorants in PD patients. The advantage of these tests is that they are easy and convenient to administer, but the olfac-tory data include no quantitative evaluation using different concentrations of odorant.16,17
Odor D: γ–undecalactone
6
4
2
0
Controls HY I HY II HY III HY IV
Figure 2D RT score of odorant D. There were no significant differences of odorant D scores between the five groups.
Odor E: skatol
6
4
2
0
Controls HY I HY II HY III HY IV
*† *† *†
Figure 2E rT score of odorant e. compared with controls and hY I patients, rT
scores for odorant E were higher significantly in HY II, III, and IV patients (F = 27.876 and P, 0.001 by one-way AnOVA).
Notes: *P,0.01 by ryan’s method between the PD hY II, III and IV subgroups and controls; †P, 0.01 by ryan’s method between the hY I group and other hY
groups.
Abbreviations: AnOVA, one-way analysis of variance; hY, hoehn and Yale; PD, Parkinson’s disease; rT, recognition threshold.
International Journal of General Medicine downloaded from https://www.dovepress.com/ by 118.70.13.36 on 22-Aug-2020
International Journal of General Medicine
Publish your work in this journal
Submit your manuscript here: http://www.dovepress.com/international-journal-of-general-medicine-journal
The International Journal of General Medicine is an international, peer-reviewed open-access journal that focuses on general and internal medicine, pathogenesis, epidemiology, diagnosis, monitoring and treat-ment protocols. The journal is characterized by the rapid reporting of reviews, original research and clinical studies across all disease areas.
A key focus is the elucidation of disease processes and management protocols resulting in improved outcomes for the patient.The manu-script management system is completely online and includes a very quick and fair peer-review system. Visit http://www.dovepress.com/ testimonials.php to read real quotes from published authors.
Dovepress
Dove
press
Olfactory assessment in Parkinson’s disease
In comparison with the conventional smell tests used in Europe and the US, the TTO test was devised as a quantitative odor assessment method in Japan. Methodologic features of the TTO test include five odorants and seven or eight different concentrations of each odorant. A pilot TTO study showed that total RT score differed significantly between PD patients and age-matched controls, although PD stage and RT score were not analyzed for each odorant.18 In another small study of the TTO
test in 10 PD patients and 10 controls, only two odorants were investigated, one pleasant and one unpleasant.19 In our study,
we have analyzed olfactory function in a large number of PD patients (n = 89) by TTO examination using five odorants. Two kinds of odorants were found to be useful for olfactory evalua-tion in these patients. Although no significant correlaevalua-tion existed between smell and motor dysfunction, some HY I patients had hyposmia. Besides the peripheral olfactory nerves and bulb, involvement of the corticobasal pathway or the olfactory limbic system could be a possible causative mechanism for hyposmia. A recent pathologic study mentioned no significant histochemical abnormalities of the olfactory epithelium between PD patients and control subjects.20 Therefore, the most crucial pathologic
damage occurring in the peripheral and central olfactory systems remains unclear in PD patients with hyposmia.
The present study using the TTO test indicates that hyposmia occurs in PD patients with HY II–IV disease. Total RT score and RT scores for methyl cyclopentenolone and skatol were useful for quantitative olfactory examination. These scores were not correlated with disease duration and HY stage in our patients. It is of interest that olfactory deficits were found in a minority of PD patients with HY I disease. Further longitudinal study is needed to clarify whether distinct clinical courses exist between HY I patients with and without hyposmia.
Acknowledgments
The authors are grateful to Professor Yasuo Iwasaki, Depart-ment of Neurology, Toho University Omori Medical Center, Tokyo, Japan for critical suggestions and support of this study.
Disclosure
The authors report no conflicts of interest in this work, financial or otherwise.
References
1. Ansari KA, Johnson A. Olfactory function in patients with Parkinson’s disease. J Chronic Dis. 1975;28:493–497.
2. Daum RF, Sekinger B, Kobal G, et al. Riechpruefung mit “sniffin’ sticks” zur klinischen Diagnostik des Morbus Parkinson. Nervnarzt. 2000;71:643–650.
3. Hawkes CH, Shephard BC, Daniel SE. Is Parkinson’s disease a primary olfactory disorder? QJM. 1999;56:33–39.
4. Braak H, Del Tredici K, Rüb U, et al. Staging of brain pathology related to sporadic Parkinson’s disease. Neurobiol Aging. 2003;24:197–211. 5. Doty RL, Deems DA, Stellar S. Olfactory function in Parkinsonism: A
general deficit unrelated to neurologic signs, disease stage, or disease duration. Neurology. 1988;38:1237–1244.
6. Stern MB, Doty RL, Dotti M, et al. Olfactory function in Parkinson’s disease subtypes. Neurology. 1994;44:266–268.
7. Tissingh G, Berendse HW, Bergmans P, et al. Loss of olfaction in de novo and treated Parkinson’s disease: Possible implications for early diagnosis. Mov Disord. 2001;16:41–46.
8. Müller A, Reichmann H, Livermore A, et al. Olfactory function in idiopathic Parkinson’s disease (IPD): Results from cross-sectional stud-ies in IPD patients and long-term follow-up of de novo IPD patients. J Neural Transm. 2002;109:805–811.
9. Kondo H, Matsuda T, Hashida M, et al. A study of the relationship between the T & T Olfactometer and the University of Pennsylvania Smell Identi-fication Test in a Japanese population. Am J Rhinol. 1998;12:353–358. 10. Herting B, Schulze S, Reichmann H, et al. A longitudinal study of
olfactory function in patients with idiopathic Parkinson’s disease. J Neurol. 2008;255:367–370.
11. Berendse HW, Booij J, Francot CM, et al. Subclinical dopaminergic dysfunction in asymptomatic Parkinson’s disease patients’ relatives with a decreased sense of smell. Ann Neurol. 2001;50:34–41. 12. Ponsen MM, Stoffers D, Booij J, et al. Idiopathic hyposmia as
a preclinical sign of Parkinson’s disease. Ann Neurol. 2004;61: 173–181.
13. Haehner A, Hummel T, Hummel C, et al. Olfactory loss may be a first sign of idiopathic Parkinson’s disease. Mov Disord. 2007;22:839–842. 14. Ross GW, Petrovitch H, Abbott RD, et al. Association of olfactory
dysfunction with risk for future Parkinson’s disease. Ann Neurol. 2008;63:167–173.
15. Huismann E, Uylings HB, Hoogland PV. A 100% increase of dopamin-ergic cells in the olfactory bulb may explain hyposmia in Parkinson’s disease. Mov Disord. 2004;19:687–692.
16. Hawkes CH, Shephard BC, Daniel SE. Olfactory dysfunction in Parkinson’s disease. J Neurol Neurosurg Psychiatry. 1997;62: 436–446.
17. Double KL, Rowe DB, Hayes M, et al. Identifying the pattern of olfac-tory deficits in Parkinson disease using the brief smell identification test. Arch Neurol. 2003;60:545–549.
18. Murofushi T, Mizuno M, Osanai R, et al. Olfactory dysfunc-tion in Parkinson’s disease. ORL J Otorhinolaryngol Relat Spec. 1991;53:143–146.
19. Masaoka Y, Satoh H, Kawamura M, et al. Respiratory responses to olfactory stimuli in Parkinson’s disease. Respir Physiol Neurobiol. 2008;161:136–141.
20. Witt M, Bormann K, Gudziol V, et al. Biopsies of olfactory epithelium in patients with Parkinson’s disease. Mov Disord. 2009;24:906–914.
International Journal of General Medicine downloaded from https://www.dovepress.com/ by 118.70.13.36 on 22-Aug-2020