Hadronization via coalescence at RHIC
and LHC
V. Minissale1,2, F. Scardina1,2 and V. Greco1,2
1Department of Physics and Astronomy, University of Catania,
Catania, Italy
2INFN - Laboratori Nazionali del Sud, Catania, Italy
Abstract
An hadronization model that includes coalescence and fragmenta-tion is used in this work to obtain predicfragmenta-tions at both RHIC and LHC
energy for light and strange hadrons transverse momentum spectra (π,
p,k, Λ) and baryon to meson ratios (p/π, Λ/k) in a wide range ofpT.
This is accomplished without changing coalescence parameters. The
ratiosp/π and Λ/K shows the right behaviour except for some lack of
baryon yield in a limitedpT range around 6 GeV. This would indicate
that the AKK fragmentation functions is too flat atpT <8 GeV.
1
Introduction
momenta to produce a final-state meson or baryon, this can happen at a time scale in which the partons rescatter and generate a thermal medium expanding with a collective radial flow [2]. Initial hard processes between colliding nucleons producing minijet partons provide a dominant contribu-tion to hadron spectra at high transverse momentum.
1.1 Coalescence model
The coalescence approach is based on a Wigner function formalism. The hadron spectrum can be written as:
dNH d2PT =gH
n
i=1
d3pi
(2π)3Eipi·dσi fq(xi, pi)fH(xi..xn, pi..pn)δ
(2)
PT −
n
i=1
pT,i
(1) where fH(xi..xn, pi..pn) is the hadron Wigner distribution function giving
the probability for n quark to form an hadron, dσ denotes an element of
a space-like hypersurface, gH is the probability of forming a color neutral object with the spin of the hadron considered fromn coloured quarks. The functionfq(x, p) is the covariant distribution function of quarks (and anti-quarks) in the phase space. For the light hadrons Wigner function we take a sphere in both space and momentum, with radii Δr and Δp, respectively, which in the Wigner formalism are related by Δr·Δp = 1 . For meson we have:
fM(x1, x2;p1, p2) = 9π
2(ΔxΔp)3 Θ(Δ
2
x−(x1−x2)2)Θ(Δ2p−(p1−p2)2+(m1−m2)2) (2) A good description of pion, kaon, proton, antiproton and Λ spectra can be obtained with a radius parameter Δp = 0.19 GeV for mesons, 0.33 GeV for proton, 0.38 GeV for Lambdas [3].
2
Fireball and model parameters
experimental value of total multiplicity dN/dy and total transverse energy
dET/dy. The values obtained for this quantities areβmax= 0.37,R⊥= 8.7 fm,τ = 4.5 fm/cat RHIC, and βmax= 0.60, R⊥= 10.2 fm,τ = 7.8 fm/cat LHC. For their longitudinal momentum distribution we assume a uniform rapidity distribution iny∈(−0.5,+0.5).
For partons in the quark-gluon plasma we take a thermal distribution for
transverse momenta up top0= 2 GeV, in particular the momentum spectra
for quark and antiquarks is given by:
dN q,q¯
d2rT d2pT =
gq,q¯τ mT
(2π)3 exp
−γT(mT −pT ·vT ∓μq)
T
(3)
where gq = gq¯ = 6 are the spin-color degeneracy of light quarks and an-tiquarks, and the minus and plus signs are for quarks and anan-tiquarks,
re-spectively. The slope parameter T is taken to be T = 165 M eV. Masses
of light quarks and antiquarks are taken to be mu,d,¯u,d¯ = 300 M eV and
ms,¯s= 475GeV, similar to the masses of constituent quarks. For the quark chemical potential we use a value of light antiquark to quark ratio which lead to the antiproton to proton ratio observed at midrapidity in heavy ion
collisions experiments that is μq = 10MeV at RHIC and vanishing at LHC.
Partons at high transverse momenta (greater than 2 GeV) are mainly from the minijets produced in initial hard collisions among nucleons and are de-scribed by a power-law parametrization.
0 1 2 3 4 5 6 7 8 9
PT [GeV]
10-9
10-8
10-7
10-6
10-5
10-4
10-3
10-2
10-1
100
101
102
103
E dN/d
3 p [GeV -2 ]
PHENIX S
PHENIX-STAR k PHENIX p STAR / S total k total p total
/ total
x1
x1/5
x1/25
x1/125
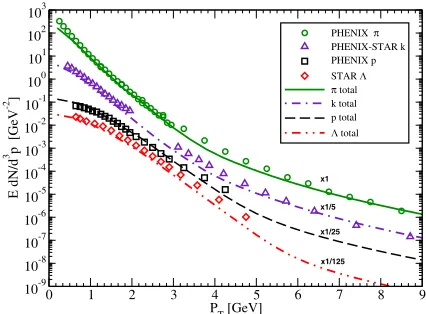
Figure 1: Particle transverse momentum spectrum at RHIC from Au+Au collisions
at √s = 200 GeV. Pion (solid), kaon (dash-dotted), proton (dashed), Lambda
3
Spectra
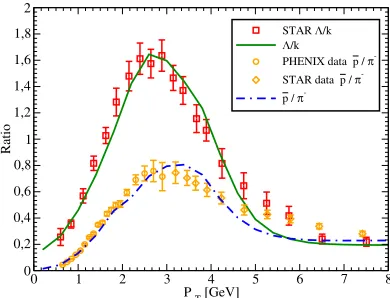
In Fig.1 are shown the transverse momentum spectra of pions, kaons, protons and Lambdas at RHIC. In all the spectra the contribution that comes from resonances decay are included with their decay channel and the pertinent branching ratios (e.g. for π spectra a dominant contribution comes, in low momentum region, from ρ decay). Higher resonances (K∗,Δ inπ case) are less relevant and only contribute to some little better description at very low momenta [3]. We find a good description in a wide range of momentum. We can see in Fig.2 that the ratios ¯p/π−, Λ/K are well predicted, from the rise at low pT up to the peak region and then the falling-down behaviour. However in both cases it is clear that there is an underestimation in the predicted ratio in the region of pT ∼ 5−7 GeV. Looking at the particle spectra this lack can be imputed to an insufficient production of baryons. In Fig.3 are shown all the particle transverse momentum spectra at LHC. The results obtained in this case, occur without any change or addition of model parameters respect to the one at RHIC. Only the radial flow and volume of the hadronizing fireball are changed, and are constrained by comparison to the multiplicity and energy density experimentally measured.
There is a good agreement with the experimental data in all the transverse momentum region, except some lack of yield for pions at very lowpT due to absence of all the possible resonances. The model is able to correctly predict the evolution, from RHIC to LHC, of the absolute yield and especially its
pT shape. For baryons in thepT region where the fragmentation dominates,
0 1 2 3 4 5 6 7 8
P T [GeV]
0 0,2 0,4 0,6 0,8 1 1,2 1,4 1,6 1,8 2
Ratio
STAR //k
//k
PHENIX data p / S
-STAR data p / S
-p / S
-Figure 2: Antiproton to negative pion ratio (dash-dotted line) and Lambda to kaon
0 1 2 3 4 5 6 7 8 9 10
PT [GeV]
10-7
10-6
10-5
10-4
10-3
10-2
10-1
100
101
102
103
E dN/d
3 p [GeV -2 ]
ALICE S
ALICE k ALICE p ALICE / S total k total p total
/ total
x 1/5
x1/25
x1/125 x 1
Figure 3: Particle transverse momentum spectrum at LHC in Pb+Pb collisions at
√
s= 2.7 TeV. Pion (solid), kaon (dash-dotted), proton (dashed), Lambda (dashed
and double dotted). The spectra are scaled for better visibility. [6, 7]
i.e. pT ∼ 6−7 GeV, there is some lack of yield. The baryon over meson
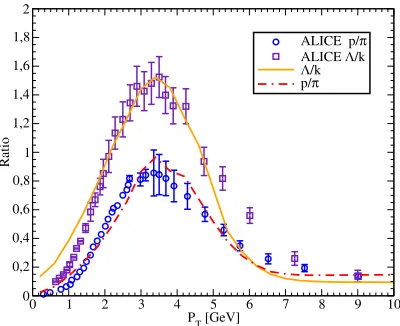
ratios at LHC are shown in Fig.4. The model overestimate the ratio in the low pT region, due to the production excess of p and Λ, but there is a good description especially in the peak region. These ratios show also that the region where fragmentation becomes dominant is characterized by an underestimation of baryons.
0 1 2 3 4 5 6 7 8 9 10
PT [GeV]
0 0,2 0,4 0,6 0,8 1 1,2 1,4 1,6 1,8 2
Ratio
ALICE p/S
ALICE //k
//k
p/S
Figure 4: Proton to pion (dash-dotted line) and Lambda to kaon ratio (solid line)
4
Conclusions
We have studied the evolution of the transverse momentum spectra from RHIC to LHC energy in a coalescence plus fragmentation approach. In order to predict the features at LHC no one adjustment of the coalescence parameter, like the width of Wigner function, has been made. The results obtained are in good agreement with the experimental data from LHC in a wide range of pT. It appear that the independent fragmentation approach (at least using the AKK) gives too hard spectra at least up to pT 8 GeV or it could be that coalescence contribution should extend to largepT with respect to the present modeling. There are studies that, recently, investigate a process that within the coalescence plus fragmentation approach could be quite important in solving this issue [8]. They essentially describe the in-medium fragmentation as a quark recombination of shower partons taking into account also the gluon splitting in quark pairs that recombine.
References
[1] STAR Collaboration, J. Adams et al., Phys.Rev. C72, 014904 (2005), nucl-ex/0409033.
[2] R. Fries, V. Greco, and P. Sorensen, Ann. Rev. Nucl. Part. Sci. 58, 177-205 (2008).
[3] V. Minissale, F. Scardina and V. Greco, arXiv:1502.06213, (2015),
nucl-th.
[4] PHENIX Collaboration, S. Adleret al., Phys.Rev.C69, 034909 (2004), nucl-ex/0307022.
[5] STAR Collaboration, G. Agakishievet al., Phys.Rev.Lett.108, 072301 (2012), 1107.2955.
[6] ALICE Collaboration, B. Abelev et al., Phys.Rev.Lett. 109, 252301
(2012), 1208.1974.
[7] ALICE Collaboration,Abelev, Betty Bezverkhny and others,
Phys.Rev.Lett.111, 222301 (2013),1307.5530.
[8] K. C. Han, R. J. Fries, and C. M. Ko, J.Phys.Conf.Ser. 420, 012044