Note. This article will be published in a forthcoming issue of the
International Journal of Sports Physiology and Performance. The
article appears here in its accepted, peer-reviewed form, as it was
provided by the submitting author. It has not been copyedited,
proofread, or formatted by the publisher.
Section: Original Investigation
Article Title: Acceleration-Based Running Intensities of Professional Rugby League Match-Play
Authors: Jace A. Delaney1,2, Grant M. Duthie1,2, Heidi R. Thornton1,2, Tannath J. Scott1, David Gay3 and Ben J. Dascombe1
Affiliations: 1Applied Sports Science and Exercise Testing Laboratory, Faculty of Science and Information Technology, University of Newcastle, Ourimbah, NSW. 2Newcastle Knights
Rugby League Club, Mayfield, NSW. 3School of Electrical Engineering and Computer Science, University of Newcastle, Callaghan, NSW.
Journal: International Journal of Sports Physiology and Performance
Acceptance Date: December 3, 2015
©2015 Human Kinetics, Inc.
Title: Acceleration-based running intensities of professional rugby league match-play.
Submission Type: Original Investigation.
Authors: Jace A. Delaney1,2, Grant M. Duthie1,2, Heidi R. Thornton1,2, Tannath J. Scott1, David Gay3 and Ben J. Dascombe1.
Institutions and Affiliations:
1. Applied Sports Science and Exercise Testing Laboratory, Faculty of Science and
Information Technology, University of Newcastle, Ourimbah, NSW 2258
2. Newcastle Knights Rugby League Club, Mayfield, NSW 2304
3. School of Electrical Engineering and Computer Science, University of Newcastle,
Callaghan, NSW 2258
Corresponding Author:
Mr Jace A. Delaney
School of Environmental and Life Sciences Faculty of Science and Information Technology University of Newcastle
32 Industrial Drive, Mayfield, 2304 Ph: +61 437 600 202
Email: [email protected]
Preferred Running Head: Acceleration-based running in rugby league.
Abstract Word Count:250
Text-only Word Count: 3908
Number of Tables: 4
ABSTRACT
Rugby league involves frequent periods of high-intensity running including acceleration and
deceleration efforts, often occurring at low speeds. Purpose: To quantify the energetic cost of
running and acceleration efforts during rugby league competition to aid in prescription and
monitoring of training. Methods: Global Positioning System (GPS) data were collected from
37 professional rugby league players across two seasons. Peak values for relative distance,
average acceleration/deceleration and metabolic power (Pmet) were calculated for ten different
moving average durations (1-10 min), for each position. A mixed-effects model was used to
assess the effect of position for each duration, and individual comparisons were made using a
magnitude-based inference network. Results: There were almost certainly large differences in
relative distance and Pmet between the 10-min window and all moving averages <5 min in
duration (ES = 1.21-1.88). Fullbacks, halves and hookers covered greater relative distances
than outside backs, edge forwards and middle forwards for moving averages lasting between
2-10 min. Acceleration/deceleration demands were greatest in hookers and halves compared to
fullbacks, middle forwards and outside backs. Pmet was greatest in hookers, halves and
fullbacks compared to middle forwards and outside backs. Conclusions: Competition running
intensities varied by both position and moving average duration. Hookers exhibited the greatest
Pmet of all positions, due to high involvement in both attack and defence. Fullbacks also reached
high Pmet, possibly due to a greater absolute volume of running. This study provides coaches
with match data that can be used for the prescription and monitoring of specific training drills.
INTRODUCTION
The importance of Global Positioning Systems (GPS) for quantifying rugby league
competition has been thoroughly documented1,2. Recently, the most intense periods of
match-play have been described, using a moving average method3. Briefly, this method applied a
moving average to match position-time data to determine the peak relative distance achieved
during competition amongst professional rugby league players, for a range of moving average
durations. It was observed that as the length of the moving average was reduced, the maximal
relative running intensity increased significantly. Such data demonstrated running intensities
as high as 156 ± 12 m.min-1 for a 1-min window. These values present substantially greater
physical demands than previously reported by the relative distances for rugby league
match-play, which typically range between 80-100 m.min-14. Whilst such data regarding the running
intensities of rugby league are useful, it could be suggested that they are limited in their ability
to account for the varying match demands of different positions. Gabbett et al.5 reported that
collisions (i.e. hit-ups and tackles) are more frequent in hit-up forwards than any other position.
Subsequently, the ability of forwards to cover large relative distances may become impaired,
due to the constant presence of opposition players6. These positions are regularly required to
accelerate, decelerate and change direction, for which the physical demands are typically not
accounted for by traditional velocity-based methods7.
Previously, di Prampero et al.7 presented a theoretical model that quantified the
energetic cost of accelerations and decelerations. This model considers the energetic cost of
accelerated running on flat terrain to be equivalent to the known physiological cost of uphill
running at a constant pace8. Using the acceleration of a player at any time point, an
instantaneous energy cost can be estimated. This cost can be summated to provide an estimation
of overall energy expenditure throughout the activity, or multiplied by velocity, as an indication
as soccer9, Australian football (AFL)10, rugby sevens11 and rugby league12. For example,
amongst professional soccer players, Osgnach et al.9 estimated the distance players would have
covered at a constant pace, using the total energy expenditure throughout the match (equivalent
distance, ED). It was found that players ED exceeded actual distance by around 20%. Using a
similar analysis amongst AFL players, Coutts et al.10 reported a difference of just 10-11%,
indicating a greater percentage of constant running amongst these athletes. However, when
considering rugby league players, Kempton et al.12 reported higher differences of 27-29%,
suggesting a greater proportion of accelerated running contributed to energy expenditure
compared to soccer and AFL players.
As previously stated, the running demands of certain positions in rugby league are
limited due to the presence of opposition players and as a result may increase the reliance on
acceleration abilities. Fullbacks have been shown to exhibit a greater running intensity than
any other position, due to the open-style running requirements of this position3. In contrast,
Kempton et al.12 compared distance covered over a high-power (HP) threshold of 20 W·kg-1
with distance covered over a traditional high-speed (HS) threshold of 14.4 km·hr-1. The
difference between these two values was strongly influenced by position, with hit-up forwards
covering 76% more distance at HPcompared to HS, whilst the difference for outside backs
(wingers and centres) was just 37%. These data outline a significant oversight by previous
match-play analysis techniques, where high-intensity activities performed at low velocities
were unaccounted for. However, the HP and HS data reported by these authors are
representative of absolute match values, and have limited application in the prescription and
monitoring of training. Therefore, the aim of this study was to describe the acceleration-based
duration-specific running demands of rugby league match-play, for the development of precise
training methodologies. The overloading of these demands through an appropriately periodized
METHODS
Design
GPS data were collected during the 2013 and 2014 National Rugby League (NRL)
competitive seasons, to establish the duration- and position-specific acceleration-based running
demands of rugby league. Prior to the commencement of the study, all subjects were informed
of the aims and requirements of the research, and informed consent was obtained. The
Institutional Human Ethics Committee approved all experimental procedures.
Subjects
Thirty-seven professional rugby league players (age; 27.0 ± 5.1 yr, mass; 98.5 ± 8.8 kg
and stature; 1.84 ± 0.05 m) from the same club volunteered for this study. Data was collected
throughout during 43 matches of the 2013 (12 wins, 10 losses, 1 draw, final position 7th) and
2014 NRL seasons (9 wins, 11 losses, final position 12th). It must be noted that some minor
rule changes were introduced at the beginning of the 2014 season, aimed to increase the amount
of time the ball was active in play (e.g. total game-time once stoppages are removed). However,
data obtained from a commercial statistics provided (Prozone, Sydney, Australia) revealed that
ball-in-play time, for matches involving the team in question, between season was similar
between the 2013 and 2014 season (mean ± SD; 52.7 ± 5.0 min and 53.0 ± 3.9 min,
respectively), and therefore this was deemed to have little effect.
A typical training week consisted of 2-3 field sessions, 1-2 resistance sessions and 1-2
recovery-based sessions. Each match was 80 min in duration that was separated into two
40-min halves. Players were classified by playing position as follows (n = number of
observations): fullbacks (n = 39), outside backs (n = 153), halves (half-back and five-eighth; n
= 81), middle forwards (props and locks; n = 200), edge forwards (second rowers; n = 81) and
Methodology
The match running demands of players were recorded using a portable GPS unit at a
sampling rate of 15 Hz (SPI HPU, GPSports, Canberra, Australia). These units were worn in a
customized padded pouch in the player’s jersey and positioned in the centre of the upper back
area, slightly superior to the scapulae. The number of satellites and HDOP during match play
were 8.3 ± 1.4 and 1.1 ± 0.1, respectively. Whilst the validity and reliability of GPS for
measures of total distance have been established13,14, the inter-unit reliability of GPS for
assessing accelerations during team sport movements has been questioned15. To account for
this issue, each player wore the same unit for the entire study. Lastly, whilst the validity of the
calculations of di Prampero et al.7 for estimating the energetic requirements of team sports
movements has varied between studies16-18, mean P
met has recently been presented as a stable
marker of locomotor load, where acceleration- and velocity based running are accounted for
(coefficient of variation, CV% = 4.5%)13. As a result, this measure was selected as the most
appropriate measure for quantifying the chaotic nature of rugby league match-play.
Upon completion of each match, GPS data were extracted using the appropriate
proprietary software (Team AMS, Canberra, Australia). A total of 612 individual match files
were obtained. Each file was trimmed to include only match time (excluding extra-time
periods) and within-match stoppages (i.e. decision referred to video referee), and the average
total match duration was 86 ± 13, 84 ± 12, 52 ± 14, 81 ± 15, 47 ± 15 and 87 ± 9 min for
fullbacks, halves, hookers, edge forwards, middle forwards and outside backs, respectively. If
a player’s match time was less than 10 min, the file was removed from analysis. Velocity-time
curves were linearly interpolated to 15 Hz, and a fourth-order Butterworth filter applied with a
1-Hz cut-off frequency. Following this, each file was further analysed using customised
MATLAB® software (Version 8.4.0.150421, MathWorks Inc, MA, USA). This method
distance (m·min-1), absolute acceleration/deceleration (m·s-2) and metabolic power (Pmet;
W·kg-1)9. For this study, relative distance was representative of the traditional model, where
accelerated running is ignored. For the acceleration/deceleration measure, all values
(accelerations and decelerations) were made to be positive, and this variable provided an
indication of the total acceleration requirements of the athlete, irrespective of velocity. Finally,
Pmet was calculated by integrating the instantaneous velocity and acceleration, using the
energetic calculations detailed previously7,9.
The customized MATLAB® software was then used for the computation of a moving
average over each output variable, using ten different durations (1, 2, 3, 4, 5, 6, 7, 8, 9 and 10
min), and the maximum value for each duration was recorded. For example, for a 1-min rolling
average, the software identified the 900 consecutive data points (i.e. 15 samples per second for
60 seconds) where the subject exhibited the highest values. For a 2-min rolling average, 1800
samples were used, etc. As a result, for each match, maximum values for each of the three
output variables (relative distance, acceleration/deceleration, Pmet) were calculated for each of
the 10 moving average durations. Data was then collated by playing position, and averaged
across all observations for that positional group, for between-position comparisons.
Statistical Analyses
Data distribution was assessed for normality using the Shapiro-Wilk test. If a dataset
violated the assumption of normality, the data was log-transformed to reduce the
non-uniformity of error. A multilevel linear mixed-effects model was constructed to determine
differences in the individual responses in running intensity between positions (n = 6) for each
moving average duration (n = 10). Individuals were included as a random effect in the model,
to correct for pseudoreplication. When significant main effects were observed, data were
entered into a customized spreadsheet (Microsoft Excel; Microsoft, Redmond, USA), where
network19. This method assessed the probability that differences were greater than the smallest
worthwhile difference (SWD), calculated as 0.20 × the between-subject standard deviation
(SD). Further, to examine the effect of moving average duration on running intensities, a
magnitude-based approach was used to compare moving averages 1-9 to the 10-min moving
average, for each outcome variable. Quantitative chances of real differences in variables were
assessed qualitatively as: <1%, almost certainly not; 1-5%, very unlikely; 5-25%, unlikely;
25-75%, possibly; 75-97.5%, likely; 97.5-99% very likely; >99%, almost certainly19. A difference
was considered substantial when the likelihood that the true value was greater than the SWD
exceeded 75%. Descriptive statistics are presented as mean ± SD, while all other data are
reported as mean and 90% confidence limits (CL), unless otherwise stated. Where necessary,
statistical analyses were performed using R statistical software (R 3.1.0, R foundation for
Statistical Computing)20 using the lme4 package, and significance was set at p < 0.05.
RESULTS
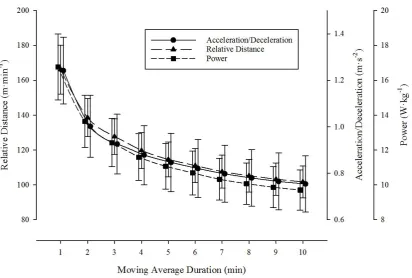
The mixed-model analysis revealed significant main effects duration for each outcome
variable. Figure 1 illustrates the increasing running demands of competition as a function of
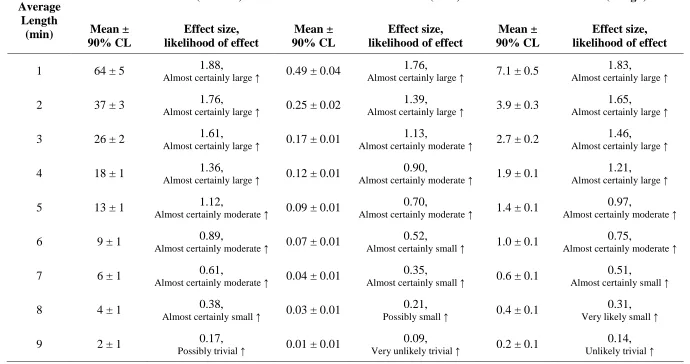
moving average duration. Comparisons with the 10-min moving average revealed almost
certainly large increases in relative distance covered and Pmet for moving averages 1 to 4 min
in duration, and almost certainly large increases in acceleration/deceleration for moving
averages 1 to 2 min in duration (Table 1). All windows shorter than 8-min were almost certainly
greater for both acceleration/deceleration and Pmet respectively. For relative distance covered,
all windows except for the 9-min window were almost certainly higher when compared to the
10-min moving average.
A significant effect of position was observed for all moving average durations for both
relative distance and Pmet. For acceleration/deceleration, the model revealed significant effects
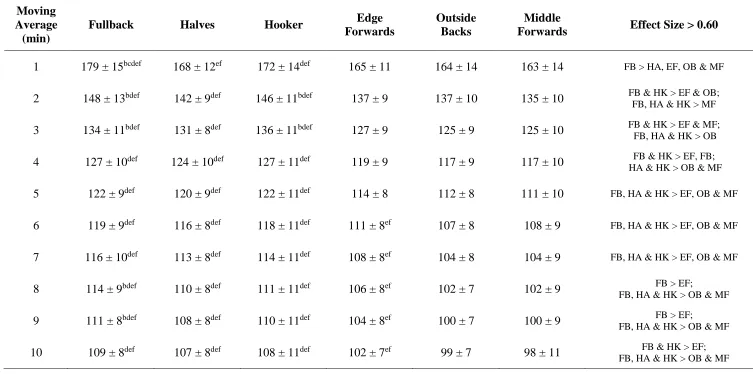
1-min window. Maximum relative distances for each moving average duration are displayed in
Table 2. There were likely small to moderate increases in relative distance covered for hookers
and halves compared to edge forwards, outside backs and middle forwards across all moving
averages. Fullbacks exhibited almost certainly large increases in relative distance compared to
outside backs for moving averages of 5 to 10 min in duration.
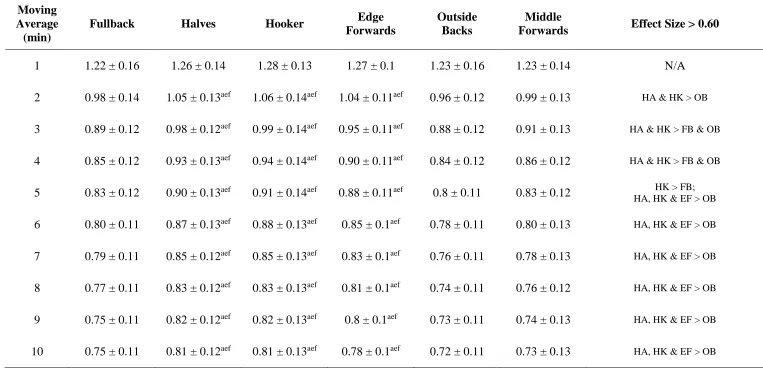
Table 3 illustrates positional differences in acceleration/deceleration demands across
moving averages 2 to 10 min in duration. Edge forwards exhibited at least likely small increase
in acceleration/deceleration demands compared to fullbacks, outside backs and middle
forwards for moving averages between 2 and 4 min in duration. For moving averages greater
than this, the difference was likely to be moderate. Halves and hookers presented at least likely
moderate increases compared to outside backs and middle forwards for all moving averages at
least 2 min in duration.
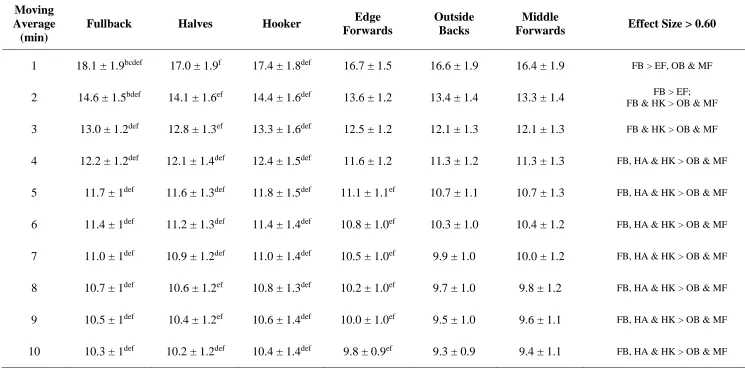
Fullbacks and hookers maintained a greater Pmet compared to edge forwards, outside
backs and middle forwards across all moving average durations, and the magnitude of these
differences were at least likely to be moderate (Table 4). Halves were also able to attain a
greater Pmet than outside backs and middle forwards for moving averages 2 to 10 min in
duration, but exhibited poorer values compared to fullbacks for the 1 min window.
DISCUSSION
The present study investigated the acceleration-based running requirements of
professional rugby league competition, concurrently with traditional velocity-based methods,
using a novel rolling average method3. Whilst the duration-specific running demands of rugby
league have been investigated previously3, the present study was able to describe the elevated
accelerated/decelerated running demands of halves and hookers, and the greater Pmet values
achieved by halves, hookers and fullbacks when compared to other positional groups. In
substantially as the length of the moving average applied decreased. The interactions of peak
running intensity and moving average durations observed in this study provide additional
benefit for coaches and practitioners when attempting to replicate position-specific competition
movement demands using specific training methodologies.
Recently, Furlan et al.11 utilized a 2-min moving average, to determine the peak periods
of Rugby Sevens performance. The authors observed that relative distance underestimated the
intensity of the identified peak period when compared to the Pmet, calculated using the methods
of Gray21, which suggests the incorporation of acceleration-based methods are necessary when
quantifying team sport movement demands. The findings of this study are in support of this
notion, where the inclusion of acceleration-based indices assist in differentiating the varying
positional requirements of rugby league. In the present study, accelerations/decelerations were
calculated as the rate of change in velocity, regardless of the direction of change. This may be
considered a limitation, as the energetic cost of acceleration has been suggested to be far greater
than that of deceleration9. However, this variable was intended to represent the overall
acceleration and deceleration load imposed on the athlete, rather than an estimate of energy
consumption. Recent research has demonstrated that GPS possess poor inter-unit reliability for
both acceleration counts >3 m·s-2 and>4 m·s-2 (CV% = 31% and 43%, respectively), and
deceleration counts <-3 m·s-2 and<-4 m·s-2 (CV% = 42% and 56%, respectively)15. However,
in the present study, each player was assigned the same unit for each match, and this coupled
with the ‘smoothing’ effect of the moving average method, may have provided a more stable
measure for differentiating demands between positions and durations.
This study observed higher average acceleration/deceleration amongst halves and
hookers, compared to outside backs and middle forwards, for moving averages 2 to 10 min in
duration. These findings are similar to whole match acceleration and decelerations counts
observed by Kempton et al.12, where adjustables (halves, hookers and fullbacks) were
substantially different from all other positions. Taken together, these differences would suggest
that for positions where acceleration/deceleration requirements are high, athletes may benefit
from training methodologies that mimic these demands. For improvements in performance to
occur, these qualities should be progressively overloaded through an appropriately periodized
program. This could be facilitated through the incorporation of strength and power training,
due to the well-established links with acceleration22 and change-of-direction23 performance.
Specifically, to improve field sport acceleration, training should be targeted towards improving
the rate of force production22, through explosive power movements such as plyometrics or
resisted sprint training24.
The present study is the first to analyse the duration-specific metabolic demands of
rugby league competition. In theory, the metabolic power method integrates the energetic
demands of accelerated running with traditional velocity-based methods7. In the present study,
the peak metabolic demands of match-play were substantially higher in hookers compared to
outside backs, edge forwards and middle forwards across all moving average durations.
Previously, the hooker position has been grouped with fullbacks and halves due to somewhat
similar competition requirements, in that they are responsible for providing structure and
organisation in both attack and defence. However, modern defensive strategies require the
hooker to be located in the centre of the field, exposing them to a similar number of absolute
collisions compared to hit-up forwards (40 ± 13 vs. 44 ± 13 per game)25, in addition to them
attending most rucks in attack to distribute the ball to other players. As a result of this, it is
common for teams to utilize a second hooker on the interchange bench, in order to maintain
the intensity around the ruck throughout a match. This was evident in the present study, where
although the average match time was similar between hookers (52 ± 14 min) and middle
other positions. However, it must be noted that the findings of the present study are reflective
of the interchange strategy of the team in question, and this may differ between clubs. Future
research may benefit from examining the factors which may limit players from maintaining
running intensities throughout a match, which may inform individual interchange and
conditioning strategies.
In contrast to the hooker position, halves and fullbacks are commonly required to
complete the entire match. The similarly elevated Pmet values observed for halves would
indicate these positions reach similar peak running intensities to hookers, and although they
are not regularly interchanged, they are not exposed to the same collision loads of interchanged
players25, allowing them to recover from high-intensity periods of match-play more adequately.
However, an interesting finding of the present study was the elevated Pmet response observed
in the fullback position. In defence, for the majority of gameplay fullbacks are positioned
behind the defensive line and are not required to move forward and retreat over 10 m, nor are
they required to be involved in regular physical collisions, as is necessary for most other
positions. As a result, the acceleration/deceleration demands of this position are substantially
lower than that of halves and hookers (Table 3). However, the lower acceleration/deceleration
demands did not translate to a lower Pmet of this position, with fullbacks exhibiting similar Pmet
values to halves and hookers. These findings illustrate the strength of the metabolic power
method for integrating the varying match-play requirements of each position, however the
findings of the present study question the grouping of halves, hookers and fullbacks when
describing competition running requirements. This positional grouping method may affect the
prescription of specific training based on competition demands, as the way an athlete achieves
high-intensity running must be addressed – whether that be the open-style running for
If athletes are to be adequately prepared for the most intense periods of competition,
training prescription should account for the acceleration-based running requirements common
to rugby league. The novel methodology of the present study may attenuate this implication,
in comparison to that of previous research, where the metabolic power method was used to
describe the mean Pmet sustained in range of team sports, such as rugby sevens (~10 W·kg-1)11,
soccer (~8 W·kg-1)9, rugby league (~9 W·kg-1)12 and AFL (~10 W·kg-1)10. However, these
values represent whole-match averages, and fail to account for the peaks in running intensity
imposed on players throughout a match. Furlan et al. 11 observed that peak Pmet for a 2-min
moving average was significantly greater than the average of the entire period. In the present
study, large increases in Pmet were observed between the 10-min moving average and all
moving averages <5 min in duration (ES 1.21-1.83). This phenomena may be due to athletes
adopting pacing strategies, where energy is distributed across the period to allow for
completion of the entire match26, or possibly the stochastic nature of team sports such as rugby
league. Regardless of the mechanism behind these differences, it would be beneficial to
condition athletes for these peaks in intensity observed throughout a match. However, it is
important to note that these findings are reflective of the tactical strategies of one team only,
and future research may benefit from investigating these running demands across a number of
clubs concurrently.
Despite the theoretical advantages associated with the integration of velocity and
acceleration when quantifying team sport movement demands, the metabolic power method7
is not without limitation. For example, this method assumes the biomechanics, frequency of
movement of the limbs, and environmental conditions to be similar between uphill running on
a treadmill at constant speed and accelerated running on flat terrain7,9. Recently, the validity of
this method in team sports has been questioned, due to the inability to account for the metabolic
wrestling12. In addition, this method is unable to account for differences in body size or running
economy16, which may potential influence the metabolic cost of running. However, whilst the
“metabolic” nature of this measure can be questioned, this variable still reflects a relatively
stable measure which collaborates accelerated and decelerated running with traditional
velocity-based techniques13. Future research may benefit from validating this energetic model
in rugby-league specific conditions, potentially accounting for positional differences in body
size and running economy.
PRACTICAL APPLICATIONS
The results of the present study show that the peak running requirements of rugby
league competition differ according to position, and increase as the duration of the moving
average decreases. Using the framework provided by the current study, coaches may
differentiate the training prescribed to each positional group. More specifically, if the aim of
training is to replicate and overload competition demands, specific small-sided games (SSG)
could be used. For example, fullbacks may benefit from open-style games such as offside
touch, played on large field dimensions, as these games have been shown to generate high
velocity-based running intensities27. In contrast, the acceleration-based demands could be
achieved through small, tight games, with a greater importance placed on support plays28.
Lastly, the findings of the current study suggest that the Pmet measure may be useful as a global
measure of external training load, due to the interaction of both acceleration and velocity-based
running.
CONCLUSIONS
The present study has provided a holistic overview of the peak metabolic demands of
rugby league competition. The main findings demonstrated that although the metabolic power
calculations incorporate both acceleration- and velocity-based movements, the method in
coaches to prescribe and monitor specific training drills according to duration- and
position-specific competition requirements, and appropriately overload athletes to achieve increases in
match performance. The findings of the present study also question the use of a combined
“adjustables” positional group when describing competition movement demands.
ACKNOWLEDGEMENTS
No financial assistance was provided for the current project. There were no conflicts of
interest. The authors wish to thank the Computer Engineering Department at the University
REFERENCES
1. Kempton T, Sirotic AC, Coutts AJ. Between match variation in professional rugby league competition. J Sci Med Sport. 2014;17(4):404-407.
2. McLellan CP, Lovell DI, Gass GC. Performance analysis of elite Rugby League match play using global positioning systems. J Strength Cond Res. 2011;25(6):1703-1710.
3. Delaney JA, Scott TJ, Thornton HR, et al. Establishing duration specific running intensities from match-play analysis in rugby league. Int J Sports Physiol Perform.
2015;10(6):725-731.
4. Johnston RD, Gabbett TJ, Jenkins DG. Applied sport science of rugby league. Sports Med. 2014;44(8):1087-1100.
5. Gabbett TJ, Jenkins DG, Abernethy B. Physical demands of professional rugby league training and competition using microtechnology. J Sci Med Sport. 2012;15(1):80-86.
6. Waldron M, Twist C, Highton J, Worsfold P, Daniels M. Movement and physiological match demands of elite rugby league using portable global positioning systems. J Sports Sci. 2011;29(11):1223-1230.
7. di Prampero PE, Fusi S, Sepulcri L, Morin JB, Belli A, Antonutto G. Sprint running: a new energetic approach. J Exp Biol. 2005;208(14):2809-2816.
8. di Prampero PE, Botter A, Osgnach C. The energy cost of sprint running and the role of metabolic power in setting top performances. Eur J Appl Physiol.. 2015;115(3):451-469.
9. Osgnach C, Poser S, Bernardini R, Rinaldo R, di Prampero PE. Energy cost and metabolic power in elite soccer: a new match analysis approach. Med Sci Sports Exerc.
2010;42(1):170-178.
10. Coutts AJ, Kempton T, Sullivan C, Bilsborough J, Cordy J, Rampinini E. Metabolic power and energetic costs of professional Australian Football match-play. J Sci Med Sport. 2015;18(2):219-224.
11. Furlan N, Waldron M, Shorter K, et al. Running Intensity Fluctuations in Elite Rugby Sevens Performance. Int J Sports Physiol Perform. 2015.
12. Kempton T, Sirotic AC, Rampinini E, Coutts AJ. Metabolic power demands of rugby league match play. Int J Sports Physiol Perform. 2015;10(1):23-28.
13. Rampinini E, Alberti G, Fiorenza M, et al. Accuracy of GPS devices for measuring high-intensity running in field-based team sports. Int J Sport Med. 2015;36(1):49-53.
14. Johnston RJ, Watsford ML, Kelly SJ, Pine MJ, Spurrs RW. Validity and interunit reliability of 10 Hz and 15 Hz GPS units for assessing athlete movement demands. J Strength Cond Res. 2014;28(6):1649-1655.
16. Buchheit M, Manouvrier C, Cassirame J, Morin JB. Monitioring locomotor load in soccer: is metabolic power, powerful? Int J Sport Med. 2015;In press.
17. Stevens TG, de Ruiter CJ, van Maurik D, van Lierop CJ, Savelsbergh GJ, Beek PJ. Measured and estimated energy cost of constant and shuttle running in soccer players.
Med Sci Sport Exerc. 2014;47(6):1219-1224.
18. Buglione A, di Prampero PE. The energy cost of shuttle running. Eur J Appl Physiol.2013;113(6):1535-1543.
19. Hopkins WG. A spreadsheet for deriving a confidence interval, mechanistic inference and clinical inference from a p value. Sportscience. 2007;11:16-20.
20. R: A language and environement for statistical computing [computer program]. Vienna, Austria: R Foundation for Statistical Computing; 2015.
21. Gray AJ. Energetic analysis of running demands in Australian Football using Global Positioning Systems technology. PhD Thesis, The University of Queensland; 2011.
22. Lockie RG, Murphy AJ, Knight TJ, Janse de Jonge XA. Factors that differentiate acceleration ability in field sport athletes. J Strength Cond Res. 2011;25(10):2704-2714.
23. Delaney JA, Scott TJ, Ballard DA, et al. Contributing factors to change-of-direction ability in professional rugby league players. J Strength Cond Res. 2015.
24. Lockie RG, Murphy AJ, Schultz AB, Knight TJ, Janse de Jonge XA. The effects of different speed training protocols on sprint acceleration kinematics and muscle strength and power in field sport athletes. J Strength Cond Res 2012;26(6):1539-1550.
25. Gabbett TJ. Relationship between Accelerometer load, Collisions, and Repeated High-Intensity Effort Activity in rugby league players. J Strength Cond Res. 2015.
26. Black GM, Gabbett TJ. Match intensity and pacing strategies in rugby league: an examination of whole-game and interchanged players, and winning and losing teams. J Strength Cond Res. 2014;28(6):1507-1516.
27. Gabbett T, Abernethy B, Jenkins D. Influence of field size on the physiological and skill demands of small-sided games in junior and senior rugby league players. J Strength Cond Res. 2012;26(2):487-491.
Table 1: Magnitude of increase in running intensities compared to 10-min moving average. Differences are presented as mean ± 90% confidence limits (90% CL).
Moving Average Length
(min)
Relative Distance (m.min-1) Acceleration/Deceleration (m.s-2) Metabolic Power (W.kg-1)
Mean ± 90% CL
Effect size, likelihood of effect
Mean ± 90% CL
Effect size, likelihood of effect
Mean ± 90% CL
Effect size, likelihood of effect
1 64 ± 5 1.88,
Almost certainly large ↑ 0.49 ± 0.04
1.76,
Almost certainly large ↑ 7.1 ± 0.5
1.83,
Almost certainly large ↑
2 37 ± 3 1.76,
Almost certainly large ↑ 0.25 ± 0.02
1.39,
Almost certainly large ↑ 3.9 ± 0.3
1.65,
Almost certainly large ↑
3 26 ± 2 1.61,
Almost certainly large ↑ 0.17 ± 0.01
1.13,
Almost certainly moderate ↑ 2.7 ± 0.2
1.46,
Almost certainly large ↑
4 18 ± 1 1.36,
Almost certainly large ↑ 0.12 ± 0.01
0.90,
Almost certainly moderate ↑ 1.9 ± 0.1
1.21,
Almost certainly large ↑
5 13 ± 1 1.12,
Almost certainly moderate ↑ 0.09 ± 0.01
0.70,
Almost certainly moderate ↑ 1.4 ± 0.1
0.97,
Almost certainly moderate ↑
6 9 ± 1 0.89,
Almost certainly moderate ↑ 0.07 ± 0.01
0.52,
Almost certainly small ↑ 1.0 ± 0.1
0.75,
Almost certainly moderate ↑
7 6 ± 1 0.61,
Almost certainly moderate ↑ 0.04 ± 0.01
0.35,
Almost certainly small ↑ 0.6 ± 0.1
0.51,
Almost certainly small ↑
8 4 ± 1 0.38,
Almost certainly small ↑ 0.03 ± 0.01
0.21,
Possibly small ↑ 0.4 ± 0.1
0.31,
Very likely small ↑
9 2 ± 1 0.17,
Possibly trivial ↑ 0.01 ± 0.01
0.09,
Very unlikely trivial ↑ 0.2 ± 0.1
0.14,
Table 2: Peak relative distances (m.min-1) of professional rugby league players by position for each moving average duration (± SD).
Moving Average (min)
Fullback Halves Hooker Edge Forwards
Outside Backs
Middle
Forwards Effect Size > 0.60
1 179 ± 15bcdef 168 ± 12ef 172 ± 14def 165 ± 11 164 ± 14 163 ± 14 FB > HA, EF, OB & MF
2 148 ± 13bdef 142 ± 9def 146 ± 11bdef 137 ± 9 137 ± 10 135 ± 10 FB & HK > EF & OB; FB, HA & HK > MF
3 134 ± 11bdef 131 ± 8def 136 ± 11bdef 127 ± 9 125 ± 9 125 ± 10 FB & HK > EF & MF;
FB, HA & HK > OB
4 127 ± 10def 124 ± 10def 127 ± 11def 119 ± 9 117 ± 9 117 ± 10 HA & HK > OB & MF FB & HK > EF, FB;
5 122 ± 9def 120 ± 9def 122 ± 11def 114 ± 8 112 ± 8 111 ± 10 FB, HA & HK > EF, OB & MF
6 119 ± 9def 116 ± 8def 118 ± 11def 111 ± 8ef 107 ± 8 108 ± 9 FB, HA & HK > EF, OB & MF
7 116 ± 10def 113 ± 8def 114 ± 11def 108 ± 8ef 104 ± 8 104 ± 9 FB, HA & HK > EF, OB & MF
8 114 ± 9bdef 110 ± 8def 111 ± 11def 106 ± 8ef 102 ± 7 102 ± 9 FB, HA & HK > OB & MF FB > EF;
9 111 ± 8bdef 108 ± 8def 110 ± 11def 104 ± 8ef 100 ± 7 100 ± 9 FB > EF;
FB, HA & HK > OB & MF
10 109 ± 8def 107 ± 8def 108 ± 11def 102 ± 7ef 99 ± 7 98 ± 11 FB, HA & HK > OB & MF FB & HK > EF;
Table 3: Peak average acceleration/deceleration (m.s-2) of professional rugby league players by position for each moving average duration (± SD).
Moving Average (min)
Fullback Halves Hooker Edge Forwards
Outside Backs
Middle
Forwards Effect Size > 0.60
1 1.22 ± 0.16 1.26 ± 0.14 1.28 ± 0.13 1.27 ± 0.1 1.23 ± 0.16 1.23 ± 0.14 N/A
2 0.98 ± 0.14 1.05 ± 0.13aef 1.06 ± 0.14aef 1.04 ± 0.11aef 0.96 ± 0.12 0.99 ± 0.13 HA & HK > OB
3 0.89 ± 0.12 0.98 ± 0.12aef 0.99 ± 0.14aef 0.95 ± 0.11aef 0.88 ± 0.12 0.91 ± 0.13 HA & HK > FB & OB
4 0.85 ± 0.12 0.93 ± 0.13aef 0.94 ± 0.14aef 0.90 ± 0.11aef 0.84 ± 0.12 0.86 ± 0.12 HA & HK > FB & OB
5 0.83 ± 0.12 0.90 ± 0.13aef 0.91 ± 0.14aef 0.88 ± 0.11aef 0.8 ± 0.11 0.83 ± 0.12 HA, HK & EF > OB HK > FB;
6 0.80 ± 0.11 0.87 ± 0.13aef 0.88 ± 0.13aef 0.85 ± 0.1aef 0.78 ± 0.11 0.80 ± 0.13 HA, HK & EF > OB
7 0.79 ± 0.11 0.85 ± 0.12aef 0.85 ± 0.13aef 0.83 ± 0.1aef 0.76 ± 0.11 0.78 ± 0.13 HA, HK & EF > OB
8 0.77 ± 0.11 0.83 ± 0.12aef 0.83 ± 0.13aef 0.81 ± 0.1aef 0.74 ± 0.11 0.76 ± 0.12 HA, HK & EF > OB
9 0.75 ± 0.11 0.82 ± 0.12aef 0.82 ± 0.13aef 0.8 ± 0.1aef 0.73 ± 0.11 0.74 ± 0.13 HA, HK & EF > OB
10 0.75 ± 0.11 0.81 ± 0.12aef 0.81 ± 0.13aef 0.78 ± 0.1aef 0.72 ± 0.11 0.73 ± 0.13 HA, HK & EF > OB
Table 4: Peak average metabolic power (W.kg-1) of professional rugby league players by position for each moving average duration (± SD).
Moving Average (min)
Fullback Halves Hooker Edge Forwards
Outside Backs
Middle
Forwards Effect Size > 0.60
1 18.1 ± 1.9bcdef 17.0 ± 1.9f 17.4 ± 1.8def 16.7 ± 1.5 16.6 ± 1.9 16.4 ± 1.9 FB > EF, OB & MF
2 14.6 ± 1.5bdef 14.1 ± 1.6ef 14.4 ± 1.6def 13.6 ± 1.2 13.4 ± 1.4 13.3 ± 1.4 FB & HK > OB & MF FB > EF;
3 13.0 ± 1.2def 12.8 ± 1.3ef 13.3 ± 1.6def 12.5 ± 1.2 12.1 ± 1.3 12.1 ± 1.3 FB & HK > OB & MF
4 12.2 ± 1.2def 12.1 ± 1.4def 12.4 ± 1.5def 11.6 ± 1.2 11.3 ± 1.2 11.3 ± 1.3 FB, HA & HK > OB & MF
5 11.7 ± 1def 11.6 ± 1.3def 11.8 ± 1.5def 11.1 ± 1.1ef 10.7 ± 1.1 10.7 ± 1.3 FB, HA & HK > OB & MF
6 11.4 ± 1def 11.2 ± 1.3def 11.4 ± 1.4def 10.8 ± 1.0ef 10.3 ± 1.0 10.4 ± 1.2 FB, HA & HK > OB & MF
7 11.0 ± 1def 10.9 ± 1.2def 11.0 ± 1.4def 10.5 ± 1.0ef 9.9 ± 1.0 10.0 ± 1.2 FB, HA & HK > OB & MF
8 10.7 ± 1def 10.6 ± 1.2ef 10.8 ± 1.3def 10.2 ± 1.0ef 9.7 ± 1.0 9.8 ± 1.2 FB, HA & HK > OB & MF
9 10.5 ± 1def 10.4 ± 1.2ef 10.6 ± 1.4def 10.0 ± 1.0ef 9.5 ± 1.0 9.6 ± 1.1 FB, HA & HK > OB & MF
10 10.3 ± 1def 10.2 ± 1.2def 10.4 ± 1.4def 9.8 ± 0.9ef 9.3 ± 0.9 9.4 ± 1.1 FB, HA & HK > OB & MF