Article
1
Characteristics of Welding and Arc Pressure in the
2
Plasma–TIG Hybrid Welding Process
3
Bo Wang 1,2, Xunming Zhu 3, Hongchang Zhang 4,*, Hongtao Zhang 1,2,* and Jicai Feng 1
4
1 State Key Laboratory of Advanced Welding and Joining, Harbin Institute of Technology, Harbin 150001,
5
China; wangvbo@hit.edu.cn; zhanght@hitwh.edu.cn; fengjc@hit.edu.cn
6
2 Shandong Institute of Shipbuilding Technology, Weihai 264209, China; wangvbo@hit.edu.cn;
7
zhanght@hitwh.edu.cn
8
3 Weihai Wanfeng Magnesium Sciecne and Technology Development Co.Ltd, Weihai 264209, China;
9
xunming.zhu@wfjt.com
10
4 Harbin University of Science and Technology Rongcheng Campus, Rongcheng, 264300, China;
11
794230001@qq.com
12
* Correspondence: zhanght@hitwh.edu.cn; Tel.: +86-187-6910-2227; 794230001@qq.com; Tel: +86-17863082611
13
14
Abstract: In this article, a novel hybrid welding process called plasma-TIG coupled arc welding
15
was proposed to improve the efficiency and quality of welding by utilizing the full advantage of
16
plasma and TIG welding processes. The two arcs of plasma and TIG were pulled into each other
17
into one coupled arc under the effect of Lorentz force and plasma flow force during welding
18
experiments. The arc behavior of coupled arc was studied by means of it’s arc profile, arc pressure
19
and arc force conditions. The coupled arc pressure distribution measurements were performed.
20
The effects of welding conditions on coupled arc pressure were evaluated and the maximum
21
coupled arc pressure was improved compared with single-plasma arc and single-TIG arc. It was
22
found that the maximum arc pressure was mainly determined by plasma arc current and plasma
23
gas flow. According to the results, the proposed coupled arc welding process have both advantages
24
of plasma arc and TIG method, and it has a broad application prospect.
25
Keywords: plasma-TIG; coupled arc; arc profile; pressure distribution
26
27
1. Introduction
28
Given the continuous development of processing and manufacturing technologies, traditional
29
arc welding techniques, such as plasma arc welding (PAW)[1] and tungsten inert gas (TIG)[2,3]
30
welding process, have been improved to meet the requirements of enterprises for high-quality and
31
low-consumption welding technology[4]. In recent years, hybrid welding methods are proposed to
32
overcome these disadvantages and deficiencies. Hybrid welding methods have also been
33
successfully applied in shipbuilding and spacecraft. Certain hybrid welding processes, including
34
plasma–MIG[5,6], plasma–TIG[7,8], laser–GMAW[9], laser–TIG[10] and TIG–MIG[11], have been
35
successfully used in the manufacturing industry. In comparison with ordinary single-arc welding,
36
hybrid welding technology can significantly improve welding efficiency and joint quality because it
37
is simultaneously provided with multiple heat sources that complement one another[5].
38
PAW produces arc plasma with high energy density and high arc pressure under the thermal
39
pinch effect of the water-cooled copper nozzle; thus, PAW has strong fusion and penetration
40
abilities[12,13]. However, identifying the appropriate parameters in PAW welding process is
41
difficult and the process is prone to undercutting[14]. The gas tungsten arc welding with DCEN (
42
Direct Current Electrode Negative Epolarity) is an high efficiency welding process[15,16], and has a
43
good surface forming ability and remarkably stable welding process, but it’s penetration capacity is
44
poor. Therefore, researchers also proposed several hybrid welding processes that utilize the PAW
45
and TIG arcs, which mainly include the double-sided arc welding (DSAW) and PAW–TIG welding
46
processes[8]. The DSAW process can increase penetration and significantly improve welding
47
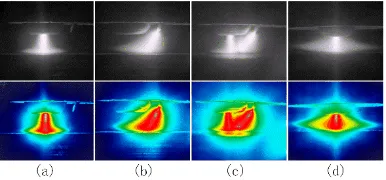
productivity[17], in this process, a TIG torch is placed on the opposite side of welds to guide the
48
PAW arc into the keyhole, thereby permitting the current to flow from the PAW torch through the
49
welds to the TIG torch directly instead of the conventional welding current loop[7,18]. However, the
50
welding accessibility of DSAW is poor compared with PAW welding process. The PAW–TIG
51
welding method is realized by the PAW and the subsequent TIG on the movable slide rail, no
52
correlation exists between the plasma and TIG arcs. This process can also enhance the welding
53
productivity. However, the heat-affected zone is large and the grain is coarse because the weld is
54
reheated by the TIG arc. The plasma–TIG coupled arc welding (PTCAW) process is a novel hybrid
55
welding method for overcoming the above deficiencies in order to achieve efficient welding process
56
and high-quality welds.
57
In this study, the PTCAW process was initially constructed and the coupled arc profile was then
58
analyzed by a charge-coupled device (CCD) camera. The effects of welding conditions on the
59
coupled arc pressure distribution was also studied to reveal the characteristics of the coupled arc
60
welding process The results provided the basis to recognize the PTCAW process and expanded the
61
application range of PAW and TIG welding processes.
62
2. Materials and Methods
63
The schematic diagram of our experimental set-up is shown in Fig. 1. The PAW and TIG torches
64
were fixed on one fixture to realize the interaction between the two processes (i.e., PTCAW process).
65
An experimental system was established according to the above designed principle. In the present
66
system, the TIG arc was established by using a direct current–constant current (DC–CC) power
67
supply (REHM InverTIG.Pro digital 240 AC/DC) under the direct current electrode negative(DCEN)
68
condition. The PAW arcs were established by using an alternating current–direct current AC/DC
69
(LORCH V50 AC/DV) and DC–CC (LORCH Handy TIG 180 DC) power supplies. The Xiris
70
XVC-1000 weld camera (55 frames/s) was applied to observe and capture the arc profile and
71
behavior under the different welding condition in real time[19]. The anode constricting nozzle of
72
PAW made of red cooper with excellent thermal conductivity is cooled by forced recirculation
73
cooling water to prevent the nozzle from being burned.
74
Plasma gas
Shielding Gas Ar(99.99%)
PAW Torch
TIG Torch
Gas hood
Camera
Wire Feeder
5
5
150 Welding direction
67°
x
y
75
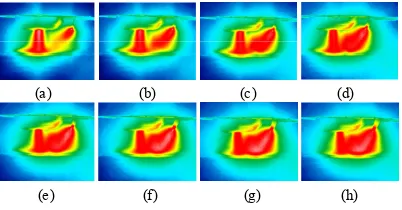
Fig. 1. Proposed PTCAW process system.
Differential pressure sensor (DPS: HSTL-FY01) was used to detect the arc pressure and pressure
77
distribution[20-22]. A 0.8-mm-diameter hole was drilled on a copperplate, which was fixed on
78
another water-cooled copperplate[23]. The details of the measurement system are shown in Fig. 2.
79
Pressure Sensor Measurement Orifice Coupling Arc
Coupling Arc PAW Torch
TIG Torch
Water cooled Copper Block
+
+
— —
80
81
Fig. 2. Measurement system of the arc pressure.
82
In all experiments, the PAW torch nozzle has a 3-mm orifice diameter, 3.2-mm tungsten
83
diameter, and 3-mm tungsten setback. Pure argon (99.99%) was used as the plasma gas and
84
shielding gas. The platform diameter of the TIG terminal electrode is 1.25 mm, and the shielding gas
85
flow rate is 15 L/min. The electrode spacing is 7 mm, that is the distance from the plasma nozzle axis
86
to the electrode tip of TIG. The nozzle height is the distance from the end of PAW nozzle to the
87
workpiece surface. The detailed parameters for the designed experiments are shown in Table 2.
88
Table 2 Welding parameters for designed experiments.
89
3. Results and discussion
90
3. Results and Discussions
91
3.1. TPTCAW coupled arc profile
92
A notable characteristic of the plasma-TIG welding method is the physical coupling effect
93
between the two arcs, which results in penetration increased and splash rate descended. The
94
detailed images of the plasma, TIG, and coupled arcs were acquired as shown in Figs.4. The RGB
95
images in the figure were transformed from gray images through pseudo-color processing in order
96
to acquire more detailed information of the arc profile. The base plate is made of red copper with
97
forced recirculation cooling water and the welding experiment was carried out under the following
98
conditions: a plasma welding current of 60A while TIG current of 100A, nozzle height of 5 mm and
99
plasma gas flow of 15 L/min.
100
Figure 3 illustrates typical arc profile under different welding methods. Welding arcs is steady
101
and plasma arc seems to be trumpet-shaped while TIG arc is similar to broom-shaped during single
102
arc welding because of the tungsten axis and the base plate have a 67 degrees angle, as shown in
103
Group Plasma arc
current (A)
TIG arc current (A) Nozzle height (mm) Plasma gas flow
(L/min)
#1 60, 80, 100, 120 100 5 4
#2 60 60, 90, 120, 150 5 4
#3 120 140, 160, 180, 200 5 4
#4 60 100 3, 4, 5, 6 4
Fig.3a & b. When the TIG arc is applied to plasma welding arc, it is observed that a novel coupled arc
104
is produced between the two arcs and the arc profile has a significant change from the previous. TIG
105
arc can be deflected to plasma arc from the view of perpendicular to welding direction, and part of
106
TIG arc is pushed to the side of plasma arc root, as shown in Fig.3c. At the same time, the coupled arc
107
profile seems to be bell-shaped similar to the conventional TIG arc from the view of parallel to the
108
welding direction, as shown in Fig.3d.The reason for this behavior can be explained as follows.
109
110
Fig. 3. Arc profile under different welding methods. a single plasma arc. b single TIG arc. c coupled arc
111
perpendicular to the welding direction. d coupled arc parallel to the welding direction.
112
Previous studies have suggested the forces play a major role in determining the arc profile[24].
113
Therefore, it is necessary to analyze coupled arc force condition in order to explore the interaction
114
mechanism on coupled arc profile. It should be noted that the electromagnetic axial pressure and
115
plasma gas flow axial pressure are recognized as the key factor of PAW arc pressure[25]. The plasma
116
arc radius of arc column is r1, and the arc radius constricts to the minimum at the place of the arc
117
root, here is r2. The electromagnetic axial pressure on the arc axis can be expressed as the following
118
Eq. (1),
119
2 0
e 2 2 2
2 1
1
1
4
I
p
r
r
μ
π
=
−
(1)Where µ0 = permeability of free space, I = plasma arc welding current. The plasma gas flow axis
120
pressure towards to the molten pool surface can be expressed as the following Eq. (2).
121
2
g 1
1
2
p
=
ρμ
(2)Where ρ = plasma gas density, µ1 = axial component of the plasma velocity. The plasma arc total pressure Pt
122
on the arc axis can be expressed as the following Eq. (3).
123
2
2 0
t e g 2 2 2 1
2 1
1
1
1
4
2
I
p
p
p
r
r
μ
ρμ
π
=
+
=
−
+
(3)Where Pe = electromagnetic axial pressure, and it is the function of I2.Pg = plasma gas flow axial
124
pressure, and it is the function of ρ and µ1, simultaneously µ1 is the function of temperature. Hence,
125
the resultant force on the arc axis from electrode tip to the surface of base plate can be expressed as
126
the following Eq. (4).
127
2 2
2 2
0 1
r t 2 1 1
2
1
1
4
2
I
r
F
p S
r
r
μ
πρμ
π
= ⋅ =
− +
(4)Where Fr = the plasma arc axis resultant force, S = the arc sectional area at the place of base
128
plate on the arc radial and S = πr12. Compared with the arc force condition during the single TIG
welding, the Lorentz force (FL) has a significant effect on TIG arc owing to plasma arc generates
130
additional magnetic field acts on the welding arc, and FL can be expressed as the following Eq. (5).
131
L
F
=
BIL
(5)Where B = magnetic induction of magnetic field generated by plasma arc, L = displacement of
132
particle per unit. The schematic of the arc force condition as shown in Fig. 4. Considering the
133
difference of arc force conditions on either side of TIG arc axis, it is necessary to specify four particles
134
(location A, B, C and D) as the research objects. On the side of the TIG arc, the plasma flow force is
135
considered as the main arc force of TIG welding arc, the plasma flow force can be expressed as the
136
following Eq. (6).
137
2
log(
b)
Pa
R
F
KI
R
=
(6)Where Ft = the plasma flow force of TIG arc at location B, C and D. K is a constant and K = µ/4π, µ =
138
medium magnetic conductivity, Ra and Rb are the radius of arc root surface and undersurface
139
respectively as shown in Fig. 5c.
140
As seen in Fig. 4 and Fig. 3c, the direction of plasma flow force (Fp2) on the arc axis can be
141
deflected to plasma arc at the location B, as shown in Fig. 5a. Furthermore, theplasma flow force acts
142
as the major driver force of the arc shift and has important influence on the weld surface forming.
143
According to right-hand grip rule at the location A, the direction of magnetic field generated by
144
plasma arc current is perpendicular to the paper inward on the side of TIG arc. Hence the particles
145
on the right side of plasma arc axis move towards plasma arc along the base plate under Lorentz
146
force (FL1 and FL2), the motion of TIG arc can be seen in Fig. 5a & c. At the same time, the plasma arc
147
is also deflected slightly towards the location B owing to the Lorentz force (FL3), as shown in Fig. 5 a
148
& b. In addition, part of particles of TIG arc have a potential of coupling with that of plasma arc root,
149
which result in transformation of TIG arc trajectory. These results indicate that the above analysis of
150
the coupled arc force conditions is consistent with the acquired experimental results in Fig. 3. It can
151
be concluded that the TIG arc is deflected under the combination effect of plasma flow force and
152
Lorentz force generated by the magnetic field of plasma arc column.
153
Plasma jet force
IP
IT
FL 3 IT
FL2
FP2
IT
Fr FP2
FL1
Welding current streamline FP1
FL 1
Workpiece
A B
C D
154
Fig. 4. Schematicof the forces acting on the coupled arcs
FL FL
PAW Arc TIG Arc
54.2°
63.6°
92.7°
90.0°
PAW Nozzle TIG Electrode
Ft
Ra
Rb
(a) (b) (c)
156
Fig. 5. Schematic of the behavior on the plasma arc Images of arc profile of different welding method. a
157
coupled arc welding. b plasma arc welding. c TIG arc.
158
Therefore, according to the aforementioned analysis, another interesting finding has caught our
159
attention. It is important to highlight that the coupling of two arcs and plasma flow force of arc are
160
proportional to the welding current, this phenomenon is in good consistent with Eq. (4) and Eq. (6). As can
161
be seen from Fig. 6, the coupled arc is generated only when the plasma arc current is bigger than 60A, at
162
the same time, the arc climbing height on plasma arc column increases with welding current (IP) when the
163
TIG welding current (IT) is constant at 100 amperes. However, as plasma arc current is constant at
164
60amperes, the plasma flow force (FP2) has a marked effect on welding arc profile acting on the base plate,
165
the heat transfer area of coupled arc acting on the workpiece is apparently increased with increase of
166
welding current (IT), as shown in Fig. 7.
167
(a) (b) (c) (d)
(e) (f) (g) (h)
168
Fig. 6. Acquired images of coupled arc profile with different TIG welding current. a 30A. b 40 A. c 50A. d
169
60 A. e 70 A. f 80 A. g 90 A. h 100A.
170
(a) (b) (c) (d)
(e) (f) (g) (h)
171
Fig. 7. Acquired images of coupled arc profile with different plasma welding current. a 40A. b 60 A. c 80A.
172
d 100 A. e 120 A. f 140 A. g 160 A. h 180A.
173
3.2 Arc pressure distribution of the coupled arc
174
The two-dimensional pressure distribution and pressure variation along with the welding
175
direction for each welding arc are shown in Fig. 8. The surface charts for individual stagnation
176
pressure of three welding method are drawn using Matlab® software in order to illustrate the
177
difference in magnitude between the values of arc pressure. According to the following
178
experimental results, there is another interesting finding that catches our attention. It is worthwhile
179
mentioning that the coupled arc pressure is mainly determined by plasma arc and proportion to the
180
welding current, and the welding conditions are listed in Table 3. The contour cloud image of the
coupled arc pressure distribution is shown in Fig. 8e, notably, it is similar to a gourd shape and the
182
maximum arc pressure appears between the two arcs near the side of plasma arc compared with
183
conventional plasma arc welding method. It can be seen that the maximum value of the coupled arc
184
is approximately 650 Pa and the maximum arc pressure decreased gradually with the increasing
185
electrode spacing, as shown in Fig. 9f. This result is significantly higher than that of plasma arc and
186
TIG arc under the same conditions, as shown in Fig. 9b & d. Therefore, it is indicated that the total
187
arc pressure of coupled arc depends on combination effect of these arcs, and it is consistent with the
188
above analysis of coupled arc profile.
189
Table 3 Experimental conditions for arc pressure measurement
190
191
-3 -2 -1 0 1 2 3
0.00 0.05 0.10 0.15 0.20 0.25 0.30 0.35 A rc p res sur
e of T
IG
arc
(K
Pa
)
The distance to nozzle axis along with welding direction (mm) 0mm 0.5mm 1mm 1.5mm 2mm 2.5mm 3mm X-axis (mm) Y -ax is ( m m )
-3 -2 -1 0 1 2 3 -3 -2 -1 0 1 2 3 0.1 0.2 0.3 0.4 0.5 0.6 (c) (d)
-4 -3 -2 -1 0 1 2 3 4
0.0 0.1 0.2 0.3 0.4 0.5 0.6 0.7 0.8 A rc pre ssu re o f plas m a arc (K P a)
The distance to nozzle center axis along welding direction (mm) 0mm 0.5mm 1mm 1.5mm 2mm 2.5mm 3mm 3.5mm
(a) X-axis (mm) (b)
Y-axi
s
(mm)
-4 -3 -2 -1 0 1 2 3 4 -3.5 -2.5 -1.5 -0.5 0.5 1.5 2.5 3.5 0.1 0.2 0.3 0.4 0.5 0.6
-4 -3 -2 -1 0 1 2 3 4 5 6 7 8
0.0 0.1 0.2 0.3 0.4 0.5 0.6 0.7 A rc pre
ssure of the cou
pl
ed arc (KP
a)
The distance to nozzle axis along with welding direction (mm) 7mm 8mm 9mm 10mm X-axis(mm) Y-a xi s( mm)
-4 -3 -2 -1 0 1 2 3 4 5 -3.5 -2.5 -1.5 -0.5 0.5 1.5 2.5 3.5 0.1 0.2 0.3 0.4 0.5 0.6 (e) (f) 0 3.5 0
- 4 4
orifice
0 3
0
- 3 3
orifice
0.54
0.24
0.65
192
Fig. 8 Stagnation pressure distribution of welding arc with the different method. a top view of
193
two-dimensional distribution of the plasma arc. b the plasma arc pressure along with welding direction
194
with different distance to measurement orifice axis. c top view of two-dimensional distribution of the TIG
195
arc. d the TIG arc pressure along with welding direction with different distance to measurement orifice
196
axis. e top view of two-dimensional distribution of the coupled arc. f the coupled arc pressure along with
197
welding direction with different electrode spacing.
198
199
IP (A) IT (A) DPT (mm) L (mm) D (mm) Qp (L/min) Qs (L/min)
3.3 The influence factor of coupled arc pressure
200
Group #1 is the single-factor experiment to examine the effects of plasma current on the coupled
201
arc pressure distribution. The plasma arc as an important part of the coupled arc[26], the variation in
202
the current value has a significant influence on plasma flow force and mainly determines the
203
maximum arc pressure of the coupled arc. The histogram of the coupled arc pressure is acquired by
204
means of extracting the maximum value of distributed line type, as shown in Fig.9b.As can be seen
205
from part a and b of Fig. 9, the maximum arc pressure increases gradually with the rise in plasma
206
current and reaches 1600 Pa as plasma current is 120 amperes. In addition, according to the changes
207
of arc pressure curves at point a, it can be illustrated that the TIG arc pressure peak is overlapped
208
with that of plasma gradually with increase of plasma current, that is due to increase in Lorentz
209
force during the process. This result suggest that the coupling effect is strengthened between the two
210
arcs with the increase of plasma current.
211
-4 -3 -2 -1 0 1 2 3 4 5
0.0 0.2 0.4 0.6 0.8 1.0 1.2 1.4 1.6 1.8 A rc pr ess ure of coupl ed arc (K Pa)
Distance to nozzle axis along with welding direction (mm) 60A 80A 100A 120A
60 80 100 120
0.0 0.2 0.4 0.6 0.8 1.0 1.2 1.4 1.6 1.8 Th e m ix ium um va lue o f a rc pres sur e (KP a)
Different current of plasma arc (A)
(a) (b)
Point a
212
Fig. 9. Coupled arc pressure with different plasma current. a coupled arc pressure along with welding direction. b Max
213
value of coupled arc pressure.
214
Groups #2 and #3 are the single-factor experiments to examine the effect of TIG current on the
215
coupled arc pressure distribution. As previously mentioned, the change in TIG arc would has
216
different effects on the coupled arc pressure. It is necessary to analysis the arc pressure in two
217
situation, when the plasma arc current is 60 amperes, as shown in Fig. 10a, as the TIG current
218
increases, the maximum arc pressure of the coupled arc gets deviated to the side of TIG arc within a
219
small scale. This condition was mainly attributed to plasma flow force increases with welding
220
current, it results in an good TIG arc stiffness. On the contrary, when the plasma current increases to
221
120 amperes, as shown in Fig. 10b, the maximum arc pressure of the coupled arc gets deviated to
222
TIG arc by a large margin, the results indicate that the Lorentz force acting on plasma arc increases
223
enough to deflect the plasma as the TIG current increases. This is consistent with the observation
224
from the coupled arc profile.
225
-4 -3 -2 -1 0 1 2 3 4 5
0.0 0.2 0.4 0.6 0.8 Co up le d ar c pr essu re ( K P a)
Distance to nozzle axis along with welding direction (mm) 60A 90A 120A 150A
-4 -3 -2 -1 0 1 2 3 4 5 6
0.0 0.2 0.4 0.6 0.8 1.0 1.2 1.4 C oup le d ar c pre ssu re(K Pa)
Distance to nozzle axis along with welding direction (mm) 140A 160A 180A 200A (a) (b)
226
Fig. 10. Coupled arc pressure along with welding direction with different current
227
Group #4 is the single-factor experiment to examine the effect of the coupled arc length on the
228
coupled arc pressure distribution. The histogram of coupled arc along with the welding direction is
acquired by means of extracting the maximum value of distributed line type, as shown in Fig. 11b.
230
The maximum arc pressure initially decreased rapidly with the increase of nozzle height and then
231
plateaued; meanwhile, another interesting finding is that the coupled arc no longer decreases as the
232
nozzle height exceeds 5 mm. The results suggest that the horizontal component of the Lorentz force
233
and plasma flow force cancels each other and reach equilibrium state along with welding direction,
234
as shown in Eq. (5).
235
(a) (b)
-4 -3 -2 -1 0 1 2 3 4 5
0.0 0.2 0.4 0.6 0.8 A rc p ressu re o f co up le d a rc ( K Pa )
Distance to the nozzle axis along with welding direction (mm) 3mm 4mm 5mm 6mm
3 4 5 6
0.0 0.1 0.2 0.3 0.4 0.5 0.6 0.7 0.8 Th e ma xiu mum val ue of a rc pre ssu re ( KPa )
Different nozzle height (mm)
236
Fig. 11. Coupled arc pressure with different nozzle height. a coupled arc pressure along with welding direction. b Max
237
value of coupled arc pressure.
238
Group #5 is the single-factor experiment to examine the effect of plasma gas flow rates on the
239
coupled arc pressure distribution. Plasma gas flow rates (QP) has a significant effect on plasma
240
movement during welding process[27]. As shown in Fig. 12, the maximum arc pressure of the
241
coupled arc evidently increased with the increase of the plasma gas flow, it can be inferred that due
242
to increased plasma gas flow lead to the increase in axial component of plasma velocity and plasma
243
gas density, as shown in Eq. (2).
244
3 4 5 6
0.0 0.2 0.4 0.6 0.8 1.0 1.2 1.4 1.6 1.8 The m axium um val ue of the a rc pres sure (KPa)
Diferent plasma gas flow (L/min)
-4 -3 -2 -1 0 1 2 3 4 5
0.0 0.2 0.4 0.6 0.8 1.0 1.2 Ar c pr es sur e of the co uple d a rc ( KPa)
Distance to nozzle axis along with welding direction (mm) 3L/min 4L/min 5L/min 6L/min (a) (b)
245
Fig. 12. Coupled arc pressure with different plasma gas flow. a coupled arc pressure along with welding direction. b Max
246
value of coupled arc pressure.
247
4. Conclusions
248
From the current study, a novel hybrid welding method has been proposed, and the coupled
249
arc behavior has been explored. The coupled arc profile and coupled arc pressure have been
250
considered as ascertaining the mechanics circumstance of coupled arc behavior. The following
251
conclusions could be obtained:
252
1. Under the function of Lorentz force and plasma flow force, TIG arc is deflected and couples
253
with plasma arc, a coupled arc is generated and involves at once the arc characteristics of
254
plasma and TIG.
2. The coupled arc profile is mainly determined by the combination effect of plasma flow force
256
and Lorentz force generated by the magnetic field of plasma arc column, which is affected
257
by the welding current from plasma and TIG.
258
3. The coupled arc pressure distribution in two-dimensional surface is similar to gourd shape,
259
the maximum arc pressure appears between plasma arc and TIG arc and it is mainly
260
determined by the plasma current. The welding conditions that affect the coupled arc
261
distribution and the maximum pressure could be ranked according to their effects on the
262
experimental results, namely, plasma current, plasma gas flow, TIG current and electrode
263
spacing.
264
Author Contributions: Hongtao Zhang and Bo Wang conceived and designed the experiment; Hongchang
265
Zhang perform the experiments; Bo Wang analysed the data and wrote the article; Xunming zhu and Jicai Feng
266
contributed to the data analysis and discussion.
267
Acknowledgments: The research was sponsored by Shandong Provincial Natural Science Foundation
268
(ZR201709200029), Shandong Key research and development plan (2017GGX30132), Shandong Key research
269
and development plan (GG201709250277), Natural Scientific Reasearch Foundation in Harbin Institute of
270
Technology (HIT.NSRIF.201707) and Young Taishan Scholars Program of Shandong Province (tsqn20161062) .
271
Conflicts of Interest: The authors declare no conflict of interest.
272
References