The Step-Point Method of Sampling-A
Practical Tool in Range Research
RAYMOND A. EVANS AND R. MERTON LOVE
Assistant Xpecialist and Professor of Agronomy alnd Agro- nomist, Department of Agronomy, University of California, Da~vis, Calif orn4a
Step-point sampling provides a rapid, accurate, and objective method of determining the botani- cal composition and total cover of herbaceous vegetation. These de- terminations enable one to evalu- ate the forage stand on any specific area. The method has been used to inventory herbaceous cover re- lative to soil type, woody vegeta- tion cover, aspect and slope, and other environmental factors by the Soil-Vegetation Survey in Cali- fornia. Values have been assessed by this method to seeding and ferti- lizer trials in irrigated pastures and improved dryland ranges. Changes in botanical composition of improved ranges resulting from grazing manipulation have also been recorded by use of this sampl- ing method.
The step-point method of sam- pling is based on point quadrat sampling. Point quadrat sampling had its origin in a suggestion made to E. B. Levy by Dr. L. Cockayne in 1925 to the effect that a pin point would prove mathematically sound as the basis of a method for charting vegetation (Levy and Madden, 1933). Cockayne vaguely referred to point quadrat sampling in 1926. From 1927 to 1930 a number of papers by Levy, Smith, and Davies appeared recording re- sults obtained by the use of this method. The first description of the method was that of Du Rietz in 1932; and in 1933 Levy and Madden published a full account of it (Goodall, 1952). The method used by Levy consisted of taking a number of locations at random and recording all vegetation that
was hit as the point was projected from above into the sward. He used a frame of 10 pins spaced 2 inches apart (Levy and Madden, 1933). The use of inclined points in a frame was first developed by Tinney, et al. (1937). Eden and Bond (1948) first used a single point for analysis of herbaceous vegetation.
Cracker and Tiver (1948) used the point quadrat method for pur- poses of a grassland survey which they conducted in South Australia. Results of Goodall’s study (1952) showed that when individual points are taken, about one-third the number are needed for the same level of precision as when points grouped in a frame are used. Biswell, et al. (1953) compared data of initial hits only wth those
of all hits of each pin. Their re- sults show that in terms of the more abundant species of the stand there was less than 3 percent dif- ference in composition between methods. Distribution of sampling points used by various operators in point-frame sampling (ten pins in a frame) have been either at random, in transects, or grouped in individual plots or quadrats (Brown, 1954). Eden and Bond
(1948) approximated an even
spacing of single pins in their sam- pling. Brown (1954) stated that the general opinion of investi- gators using the point method of sampling is that it has every pros- pect of becoming the accepted one for large scale surveys as well as for exact field analyses.
Procedure
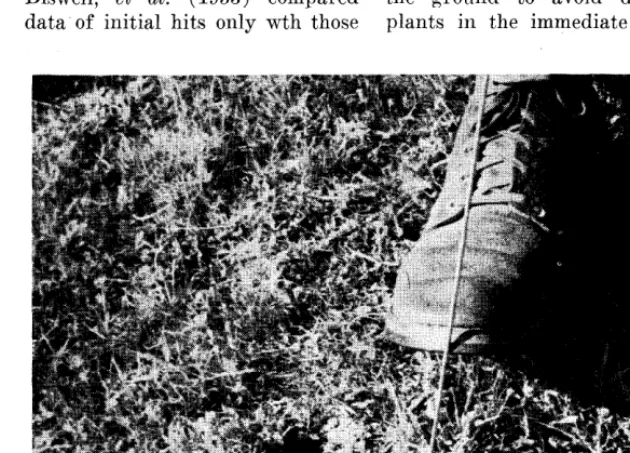
In step-point sampling a single pin is used rather than pins grouped in a frame. An individual step-point is established by the sampler lowering the sampling pin to the ground, guided by a definite notch on the toe of his boot (Fig. 1). At each step-point the sampler places his boot at a 30” angle to the ground to avoid disturbing plants in the immediate vicinity,
FIGURE 1. The sampler is establishing a sampling point with the use of a pin and a notch on the toe of his boot-the step-point.
STEP-POINT METHOD OF SAMPLING 209 THE
and lowers the pin perpendicularly to the sole of the boot until it either hits an herbaceous plant or the ground. The first herbaceous plant hit by the point or the side of the point of the pin is recorded. If no herbaceous plant is hit the pin is pushed into the ground and the plant nearest to it in a forward direction (180’ arc) is recorded. The position of the step-points are determined by specific designs. For investigation of the effects of a particular treatment, e.g., graz- ing manipulation, fertilizer or seeding treatment, transects are run across the field or plot. The transects are equally spaced and the sampling points within tran- sects are also equally spaced. Usu- ally, 300 to 500 points are sufficient to encompass the variability found in a field or local area in which the vegetation is essentially of one type. Where variation of aspect, slope or woody vegetation is en- countered in .a specific field or sampling area, separate samples of smaller size (100 to 200 points) are usually taken. Information concerning variation resulting from
the diverse sections of the field as well as mean values is obtained in this manner. In small sub-plots of fertilizer or seeding trials, the num- ber of points per treatment varies from 100 to 300 depending upon the variation within the area to be sampled.
l
3
.
l
. .
l
.
. . l
IO
.
6
ll . .
l . .
. . .
.
7
.
l
. .
4
l l .
. .
l . . . .
9
.5
.l . . l
. .
.
l
. .
8
.
l
0
l
Step-point
3
Frame-point and step-point
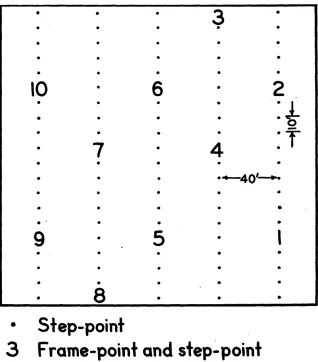
FIGURE 2. Sampling design for grassland survey plots.
Since readings of the sampling points are taken in terms of her- baceous plants and not of bare ground, an estimation method for determining total ground cover is incorporated in the technique. It is felt that to measure botanical composition and total cover by the point method alone would require a larger number of points for a valid sample. This is particularly true when sampling an area of low percentage cover of herbaceous vegetation. However, by combin- ing the point method with an esti- mation method for determining total ground cover the number of sampling points can be reduced. Further, the intensity of sampling for botanical composition will re- main constant regardless of the percentage cover. A sample of one hundred points will determine
botanical composition with one hundred hits on herbaceous plants even when the areas sampled are of low percentage cover. Other- wise, for example, a sample of l,- 000 points would be required to afford 100 hits on herbaceous vege- tation in an area of 10 percent cover.
Table 1. Classes of total herbaceous covm.
Cover class percent
0 o- 5
1 6 - 15
2 16 - 25
3 26 - 35
4 36 - 45
5 46 - 55
6 56 - 65
7 66 - 75
8 76 - 85
9 86 - 95
10 96 -100
For purposes of the Soil-Vege- tation Survey the sampling design covers an acre area and consists of 100 step-points. In the design there are 5 equally-spaced tran- sects of 20 equally-spaced points (Fig. 2). The location of the de- sign is determined by a randomly placed initial point. The specific area to be ,sampled is determined by criteria of soil, topography, and cover of vegetation. By this pro- cedure the sampling results are correlated with a specific set of en- vironmental factors. An
enced operator can sample area using the step-point in about one-half hour.
RAYMOND A. EVANS AND R. MERTON LOVE
Estimates of total ground COY- ered by herbaeeous plants are made with the use of a square-foot frame subdivided into four B-inch squaws (Fig. 3). The estimates are made in terms of 10 percent classes (Table 1). Concepts of estimation are standardized among different operators if more than one is sam- pling and are checked with total cover values using the point-frame. The locations of the square-foot frame readings are incorporated within the sampling desigm. Ten frame-points are used mith 100 step-points for survey work (Fig. 2). Twenty frame readings are in- corporated in the 300 step-point design. Sixteen to twenty frame readings are ordinarily used to sample one treatment in seeding or fertilizer plot work. Exact lo- cation of the square-foot frame is detrrmined by aligning one of the subdivision crossbars of the frame with the notch on the toe of the sampler’s boot (Fig. 3). This is done at specified step-points ac- cording to the sampling design.
For evaluation of a forage stand with respect to a range manipnla-
tion practice the sampling is done in terms of the pertinent species. If one is interested in recording data on one or a few key species, only these need be identified, and all others can be put into a general category. This saves much time in species identification, especially in seasons when inflorescenccs arc not present. For the California grassland survey \vork herbaceous plants are gronprd into six eate-
go&s. They are: desirable and undesirable annual grasses; desir- able and undesirable perennial grasses; and desirable and unde- sirable forbs. Individual species, or in some cases genera, are re- corded within each of the eate- gories of grasses and the more im- portant forbs are recorded by species or genera.
Results
THE STEP-POINT METHOD OF SAMPLING 211
Table 3. Comparison of data, of three different, two-man teams sampling the same
a~- (loation 2). Botanical Composition-Percent
Percent Other
Sampling total Bromus Festuca annual Resident Ero&um Other Perennial team cover W8OZli.S spp. grasses legumes botrys f orbs grasses
% % % % % % % %
1 67 24 58 15 - - 3 -
2 57 22 57 10 2 2 5 2
3 59 17 63 12 - 1 5 2
x 61.0 21.0 59.3 12.3 0.7 1.0 4.3 1.3
S 5.3 3.6 3.3 2.6 - - 1.2 -
type of sampling. In fact, most of the men had not estimated her- baceous cover before that day.
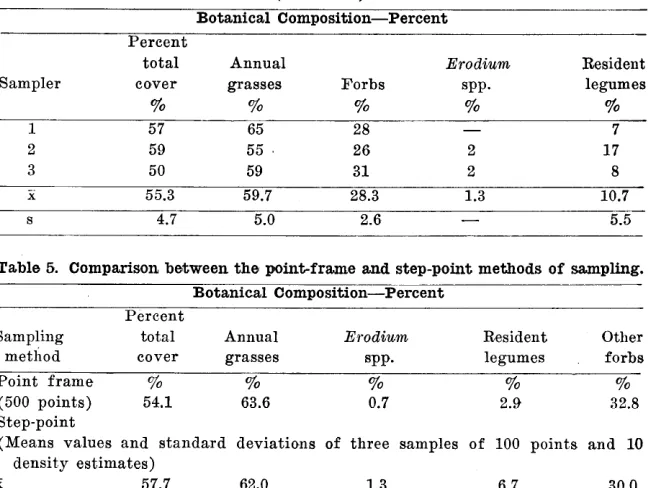
In Table 3 a comparison is made of data of three two-man teams sampling an acre area (Location 2). The standard deviation of estimates of total ground cover was about 5 percent. The standard deviations of composition percent- ages among the major plant groups ranged from 2.6 to 3.6. Again, in this test the samplers had no pre- vious experience. Table 4 compares the results of three different oper- ators sampling an acre area of an- nual grassland (Location 3). The sampling was done early in the year so identification of species was impracticable. For this reason the data are grouped into general cate- gories. Again, the standard devi- ation of the total ground cover estimates was about 5 percent. The magnitude of variation among plant group percentages ranged from 2.6 to 5.5. The relation among plant groups in all of these com- parisons was not altered because of different operators sampling the same area of annual range.
In Table 5 a comparison is made between results of sampling an acre area of annual range with 500 points with pins grouped in sets of ten (point-frame method) and three step-point analyses using 100 individual points and 10 estimates of total cover. Both in measure- .ments of total cover and botanical
composition the step-point analyses compare favorably with the 500 point sample of the point frame.
The only appreciable difference re- sulting from this comparison of methods is in percent of resident legumes in the stand. Results of the point frame sampling indicate about three percent resident le- gumes while step-point sampling indicates about seven percent. The magnitude of this difference is negligible compared with differ- ences among forage classes. Only because of the low total percentage of this group in the stand is this discrepancy noteworthy. The aver- age time required to sample the area using the step-point method was 30 minutes. Between three and four hours were required to
run the point-frame analysis. When a more precise determi- nation of botanical composition of the minor elements of the stand is desired, a large number of points is recommended. For instance, in Table 5, a larger number of points would be required to differentiate with precision between three and seven percent composition of resi- dent legumes. However, the rela- tion between resident legumes and other plant groups is established at the lowest sampling level (100 step-points and 10 frame-points) .
Most of the authors’ experience with step-point sampling has been on annual ranges. Some sampling has been done in the perennial ranges on the north coast of Cali- fornia. In tall, * heavy vegetation
the method has limitations. It is difficult not to disturb the vegeta- tion to be sampled in these cases and also to determine exactly what plant has been hit by the pin. In chaparral or other areas of dense woody vegetation a sampling de- sign consisting of straight tran- sects is not feasible. In these in- stances the sampling points are
Table 4. Comparison elf data elf three different operators sampling the same area (location 3).
Botanical Composition-Percent
Percent -
total Annual Eroclium Resident
Sampler cover grasses Forbs SPP. legumes
% % % % %
1 57 65 28 - 7
2 59 55 26 2 17
3 50 59 31 2 8
x 55.3 59.7 28.3 1.3 10.7
S 4.7 5.0 2.6 - 5.5
Table 5. Comparison be&ween the point-frame and step-point. methods of sampling.
Botanical Composition-Percent Percent
Sampling total Annual Erodium Resident Other
metGod cover grasses SPP. legumes forbs
Point frame % % % % %
(500 points) 54.1 63.6 0.7 2.9 32.8
Step-point
(Means values and standard deviatio,ns of three samples of 100 points and 10 density estimates)
Ii 57.7 62.0 1.3 6.7 30.0
‘212 RAYMOND A. EVANS AND R. MERTON
usually placed at random among quired to sample an area with the
the woody plants. step-point method was about one-
Summary
The step-point method of sam- pling consists of procedures for de- termining total ground cover and percentage cover of the herbaceous species in the stand. Involved in the procedure is the point method using individual points and an estimate method utilizing a square- foot frame. Predetermined sam- pling designs are used in the sam- pling procedures.
low magnitude. Also data of total ground cover and botanical com-
position from the step-point meth- In comparisons among data of different operators sampling the same acre area standard deviations of total ground cover and botanical composition measurements are of
sixth to one-eighth as much as re- quired by the point-frame method. From comparisons presented in this paper and from three years of field experience with the method,
Acknowledgements
it is felt that the degree of ac- curacy and objectivity are suitable
The authors wish to thank their col- leagues in the University of California
for valid analyses of field plots and are comparable to other methods. Of prime importance is the short time in which areas can be sampled using this method. The latter point in many cases is the factor which will mean success or failure of range experimentation, p art i cu - larly in respeclt to long-term con- tinuity of the collection of data.
od were comparable to that of the an& the members of the “Soil-Vegetation Survey field crews for their assistance point-frame method. The time re- and suggestions.
LOVE
LITERATURE CITED
BISWELI~, H. H., A. M. SCHULTZ, J. L. LAUNCHBAUGH AND R. D. TAB=. 1953. Studies of brush successions and re- seeding. Quart. Prog. Rept. Proj. 31- R-7. Oct. 1953. Calif. Dept. Fish and Game. 13 pp. Mimeo.
BROWN, DOROTHY. 1954. Methods of sur- veying and measuring vegetation. Bull. 42. Commonwealth Bur. of Pasture and Field Crops. Hurley, Berks., Eng- land. 223 pp.
CROCKICE, R. L. AND N. S. TIVE~. 1948.
Survey methods in grassland ecology. Jour. Brit. Grassland Sot. 3 :l-26. EDEN, T. AND T. E. T. BOND. 1945. The
effects of manurial treatment on the growth of weeds in tea. Emp. Jour. Exp. Agr. 13 : 141-157.
GOODALL, D. W. 1952. Some considera- tions in the use of point quadrats for the analysis of vegetation. Aust. Jour. Sci. B. 5:1-41.
LEVY, E. B. AND E. A. MADDEN. 1933. The point method of pasture analysis. N. Z. Jour. Agr. 46:267-279.
TINNLY, F. W., 0. S. AA~~ODT AND H. L. AHLGRE~N. 1937. Preliminary report of a study of methods used in botanical analysis of pasture swards. Jour. Amer. Sot. Agron. 29 : 835-840.
EFFECTS OF INTENSITY AND DATE OF HERBAGF, REMOVAL ON HERBAGE PRODUCTION OF ELK SEDGE
Abstract of thesis presented in partial fulfillment of the requirements fov the degree of Master of Science, major in Range Management, College of Forestry and
Range Management, Colorado State University, 195’7.
The primary purpose of this study wa#s to investi- gate t.he degrees of grazing which elk sedge could withstand a,t vasious dates on eastern Oregon summer cattle ranges and be expected to’ maintain a sustained yield of herba,ge. This was accomplished. by uniformly clipping the herb’age from elk sedge plants on study plots a.t various but, speSeific intensities and dates in a.n effort to, simula;te grazing.
The- effects of three intensities of herbfage relmoval, estimated at 20, 40, and 60 percent by weight, a,t four dates during the four month grazing season were in- vestigated. The first date of treatment occnrre’d when the seed of (the plant, was in the\ late1 dough stage’ of development. Other clipping dates were successively four weeks laster. These, trelatments were applied to the same plots for three yeaxs, 1953, 1954, and 1955, and replicated in eight bdocks. Eaeh block repre-
sented a particulas site where elk sedge occurs. The sedge stands were va,riable in density and species composition. The first year, 1953, wa.s considered a
calibration period ‘during which all treatments were initially applield. Data collected in 1956 were used to determine any changes in herblage production of seed- stalk numbers, due to the various trea,tments.
The analysis of quantitative data,, including anal- ysis of variance, convariance, and regression, showed tha,t the various t,reatments ha,d no signifieSant effects on herbage production of elk seldgel. However, vigor of the plant’, deltermined by numbers of seedstalks, was significantly or highly significantly reduce’d. Thirty-three percent mole seedstalks were produced under t,he 20 percent herbage trea,tment than the 60 percent trea,tment. The 40 percent treatment resulted in 22 percent more’ seedstalks than the 60 percent trea,tment. Fourteen percent more seedstalks were produced under the 20 percent treatment as compase~d to the 40 percent trea,tment. These results o,ocurred regardless of dafe of treatment.