Department of CSE, ECE & EEE, Magna College of Engineering, Chennai-600055, India.
Protein Function Prediction from Protein
Interaction Network Using Clustering and
Sequence of Amino Acid
Oieswarya Bhowmik
PG Student, Dept. of CSE, SRM University, Kattankulathur, Chennai, Tamilnadu, India
ABSTRACT:In this paper we have develop a network-flow based algorithm that exploits the underlying structure of protein interaction maps in order to predict protein function. The development of experimental methods for genome scale analysis of molecular interaction networks has made possible new approaches to inferring protein function. This paper describes a method of assigning functions based on a probabilistic analysis of graph neighborhoods in a protein-protein interaction network. The method exploits the fact that graph neighbors are more likely to share functions than nodes which are not neighbors. A binomial model of local neighbor function labeling probability is combined with a Markov random field propagation algorithm to assign function probabilities for proteins in the network. We applied the method to a protein-protein interaction dataset for the yeast Saccharomyces cerevisiae using the Gene Ontology (GO) terms as function labels. The method reconstructed known GO term assignments with high precision, and produced putative GO assignments to 320 proteins that currently lack GO annotation, which represents about 10% of the unlabeled proteins in S. cerevisiae
I. INTRODUCTION
Protein–protein interactions (PPI) are of interest in biology because they regulate roughly all cellular processes, including metabolic cycles, DNA transcription and replication, different signaling cascades and many additional processes. On a high level we can distinguish two types of approaches, namely inductive and transductive ones. Inductive learning approaches, also called model-based approaches, construct a model (a mathematical function) that maps a description of a protein onto its functions. Transductive approaches, on the other hand, immediately make predictions for the proteins in the network, without going through the intermediate stage of constructing a model that can be used afterwards for making predictions. Here in this paper, we develop a network-flow based algorithm that exploits the underlying structure of protein interaction maps in order to predict protein function. The development of experimental methods for genome scale analysis of molecular interaction networks has made possible new approaches to inferring protein function. This paper describes a method of assigning functions based on a probabilistic analysis of graph neighborhoods in a protein-protein interaction network. The method exploits the fact that graph neighbors are more likely to share functions than nodes which are not neighbors. A binomial model of local neighbor function labeling probability is combined with a Markov random field propagation algorithm to assign function probabilities for proteins in the network.
The main motivation of our project is to improve accuracy to find unique function form a given unknown protein set. Motivated by this fact we proposed an algorithm i.e. Protein Function Prediction from Protein Interaction Network Using Clustering and Sequence of Amino Acid.
1. Principle and technique used
Department of CSE, ECE & EEE, Magna College of Engineering, Chennai-600055, India.
in top 5 functions and merging them to a single file. Then we are computing 10% random protein from the set of proteins of top5 functions. The reason behind taking random proteins is to avoid any biased results.
However, since structural bioinformatics is a relatively new field compared to its sequence counterpart, the sources for protein structural data are not as diverse as those for sequences. Two standard databases dominate the structure data
landscape: PDB, SCOP. We used the Munich Information Center for Protein Sequences
(MIPS;ftp://ftpmips.gsf.de/yeast/PPI/) database for this study.
1.1 Clustering
Here we are creating level 1 cluster against 10% random proteins which are level 0 proteins. Thereafter we are creating directories of level1 proteins and finding out each level 2 proteins against each level 1 proteins.
1.2 Unwanted Protein Removal
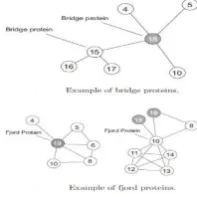
For simplicity we assume that the interactions between proteins in the network are reliable and that the similarities between them are uniform. We first start by analyzing the network to identify bridge, fjord and shore proteins. There shows some examples of bridge and fjord proteins identified. No shore protein is detected in this case. Protein 18 for instance, is identified as bridge type protein since it is connected to a disconnected sub graph of neighbors. No connection exits between proteins 4, 5, 15 nor 10. On the other hand, protein 19 is identified to be “fjord” protein since it is connected to neighbors who have a small number of connections between each other.
Figure 1. Example of bridge and fjord protein
1.3 Sequencing and Scoring
Here sequencelevel1 we are calculating the scoring of level 0 proteins i.e. unknown proteins. Scoring is related to the calculation of sequence of amino acid. Positive scoring is the total no of D and E and negative scoring is no of R and K in the sequence of amino acid for a particular protein. The formula of scoring is Total no positive or negative sequence/ Total no of amino acid.
Average scoring is average of positive and negative scoring. Then we are calculating scoring of level2 proteins. If a level 1 protein has 6 level 2 proteins then we will calculate positive, negative and average scoring of all 6 proteins. The average of all positive, negative and average scoring will be the scoring of level 1 protein. In brief,
Scoring of level 1= ∑positive or negative or average scoring of level 2 proteins/total no level 2 proteins.
1.4 Function Prediction
Here we are calculating the shortest distance between a level 1 and level 0 proteins. The distance is measured by the formula of Euclidean distance i.e. √(x2-x1)2 + (y2-y1)2. The level 1 protein having the shortest distance with level 0 protein will have the most common functions. Thus we can predict the function of an unknown protein. Then we are calculating the accuracy of function prediction of an unknown protein. The formula to calculate accuracy is Total no of function matched * 100 / Total no of function in main dataset.
II. METHOD
Department of CSE, ECE & EEE, Magna College of Engineering, Chennai-600055, India.
top 5 functions. Then we found the level 1 protein for this 10% selected proteins. After this the level 2 proteins are found for the selected proteins. After the level 1 and level 2 proteins are found all the Bridge, Fordj and Shore proteins are detected and removed. Then cluster for level 1 protein are created. Scoring of level 0 and level 2 proteins are done and average score of level 1 is calculated. The Euclidean distance for level 0 and level 1 protein are calculated and the probable function of level 0 protein are obtained from nearest level 1 protein. Finally the accuracy of code is calculated.
III. RESULTS
Results show that this method is able to improve accuracy to find unique function form a given unknown protein set. Motivated by this fact we proposed an algorithm i.e. Protein Function Prediction from Protein Interaction Network Using Clustering and Sequence of Amino Acid.
Figure 2.10% Random Protein Selection from top 5 functions
Figure 3. Protein Pairs
Particulars No of proteins
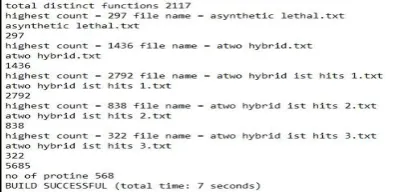
Total no of proteins (In top five functions):- 5,685
Total no of unknown protein (10%):- 568
Total no of level 1 protein :- 5,305
Total no of level 2 protein :- 12,569
Total no of Bridge Protein :- 350
Total no of Frodj Protein :- 711
Total no of Shore Protein:- 1,002
Total no of level 0 protein after pruning:- 328
Total no of level 1 protein after pruning:- 3,242
Total no of level 2 protein after pruning:- 7,681
Total no of expected function of unknown protein:- 4,751
Total no of functions predicted :- 7,853
Total no of function matched :- 2,637
Accuracy :- 55.505998%
Department of CSE, ECE & EEE, Magna College of Engineering, Chennai-600055, India.
IV. DISCUSSION
The results shows the improvement over previous work.
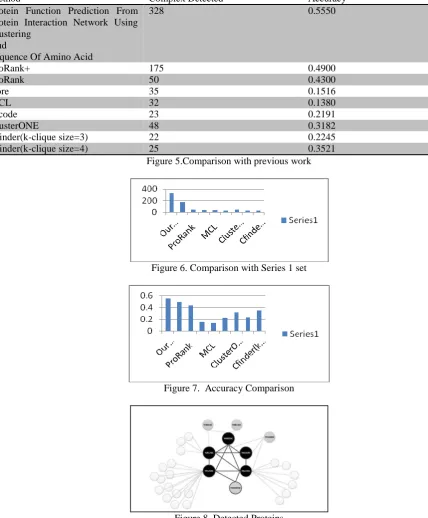
Method Complex Detected Accuracy
Protein Function Prediction From Protein Interaction Network Using Clustering
And
Sequence Of Amino Acid
328 0.5550
ProRank+ 175 0.4900
ProRank 50 0.4300
Core 35 0.1516
MCL 32 0.1380
Mcode 23 0.2191
ClusterONE 48 0.3182
Cfinder(k-clique size=3) 22 0.2245
Cfinder(k-clique size=4) 25 0.3521
Figure 5.Comparison with previous work
Figure 6. Comparison with Series 1 set
Department of CSE, ECE & EEE, Magna College of Engineering, Chennai-600055, India.
V. CONCLUSION
In this paper, we introduce a novel method used for detecting protein complexes from a PPI network of yeast. The level of accuracy achieved using this method for detecting protein complexes is a strong argument in favor of this proposed method. The improvement exhibited by this algorithm in detecting protein complexes is due to three main reasons. Firstly, the utilization of a powerful method which is based on a PageRank algorithm.Secondly, the corporations of the evolutionary relationships between proteins in the PPI network.Thirdly, utilizing robust methods to analyze the topology of the network which assists in the remove of noise (filtering) and unreliable interacting protein pairs (pruning) from the network. Therefore, it has a great potential to identify novel complexes. Furthermore, a novel way of identifying essential proteins is proposed and analyzed. Finding essential protein could lead to the understanding of the protein complex structure and disease mechanism as they could be good targets for antimicrobial agents. It could also be a key to study the centrality-lethality rule phenomenon, as well as processessuch as apoptosis and other disease related mechanisms.
REFERENCES
[1] Kadakkuzha, Beena M.; Puthanveettil, Sathyanarayanan V. (2013). "Genomics and proteomics in solving brain complexity". Molecular BioSystems 9 (7): 1807–1821. doi:10.1039/C3MB25391K. PMID 23615871.
[2] Herce, Henry D.; Deng, Wen; Helma, Jonas; Leonhardt, Heinrich; Cardosoa, M. Cristina (2013). "Visualization and targeted disruption of protein interactions in living cells". Nature Communications 4: 2660. doi:10.1038/ncomms3660. PMC 3826628.PMID 24154492.
[3] Xenarios, I.; Rice, D. W.; Salwinski, L.; Baron, M. K.; Marcotte, E. M.; Eisenberg, D. (2000). "DIP: The database of interacting proteins". Nucleic acids research 28 (1): 289–291. doi:10.1093/nar/28.1.289. PMC 102387. PMID 10592249
[4] De Las Rivas, J.; Fontanillo, C. (2010). "Protein–protein interactions essentials: key concepts to building and analyzing interactome networks.".PLoS computational biology 6 (6): e1000807. doi:10.1371/journal.pcbi.1000807
[5] Schwikowski, B.; Uetz, P.; Fields, S. (2000). "A network of protein-protein interactions in yeast". Nature Biotechnology 18 (12): 1257–1261. doi:10.1038/82360. PMID 11101803.
[6] Rigaut, G.; Shevchenko, A.; Rutz, B.; Wilm, M.; Mann, M.; Séraphin, B. (1999)."A generic protein purification method for protein complex characterization and proteome exploration". Nature Biotechnology 17 (10): 1030–1032. doi:10.1038/13732.
[7] Prieto, C.; De Las Rivas, J. (2006). "APID: Agile Protein Interaction DataAnalyzer". Nucleic Acids Research 34 (Web Server issue): W298– W302. doi:10.1093/nar/gkl128. PMC 1538863.PMID 16845013.
[8] Kohl, Michael; Wiese, Sebastian; Warscheid, Bettina (2011). "Cytoscape: Software for Visualization and Analysis of Biological Networks". Data Mining in Proteomics.Methods in Molecular Biology 696. pp. 291–303. doi:10.1007/978-1-60761-987-1_18. ISBN 978-1-60761-986-4.
[9] Raman, K. (2010). "Construction and analysis of protein–protein interaction networks.". Automated experimentation 2 (1): 2. doi:10.1186/1759-4499-2-2. PMC 2834675.PMID 20334628.
[10] Rivas, M.; Villar, D.; González, P.; Dopazo, X.M.; Mellstrom, B.; Naranjo, J.R. (2011). "Building the DREAM interactome.".Science China. Life sciences 54 (8): 786–92. doi:10.1007/s11427-011-4196-4. PMID 21786202.