Eleventh Floor, Menzies Building Monash University, Wellington Road CLAYTON Vic 3800 AUSTRALIA
Telephone: from overseas:
(03) 9905 2398, (03) 9905 5112 61 3 9905 2398 or 61 3 9905 5112
Fax:
(03) 9905 2426 61 3 9905 2426
e-mail: impact@buseco.monash.edu.au
Internet home page: http//www.monash.edu.au/policy/
How Fast is Population Ageing in China?
byY
INHUA
MAI
Centre of Policy Studies
Monash University
X
IUJIAN
PENG
Centre of Policy Studies
Monash University
And
W
EI
CHEN
Centre of Policy Studies
Monash University
General Paper No. G-208 November 2009
ISSN 1 031 9034 ISBN 978 1 921654 15 2
How fast is population ageing in China?
Yinhua Mai Xiujian Peng
and Wei Chen
Centre of Policy Studies Monash University
Abstract
Using adjusted 2000 population census data, this paper conducts China’s population projections to 2050. Three fertility and four mortality scenarios yield 12 sets of results. Despite the below-replacement fertility, China’s population will continue growing for many years. However, there are substantial differences among the twelve scenarios. The maximum population could range from less than 1.4 billion to more than 1.6 billion. One of the notable trends is the rapid population ageing. By the end of 2050 more than one-fifth to one-third of China’s population would be aged 65 and over. Demographic dividend is expected to continue in next 10 to 20 years depending on future fertility which in turn is determined by the changes in China’s one-child policy. The Chinese government should be aware of all possible situations of population changes and particularly population ageing in the first half of the century and well prepared for all possible challenges they may arise.
JEL Classification: J11
Table
of
Contents
1 Introduction ... 4
2 Data and assumption in the population projection ... 4
2.1 Base year data used in the population projection ... 4
2.2 Fertility and mortality assumptions ... 5
3 Methodology of the population projection ... 7
4 Population projection results ... 8
4.1 Total sizes of whole population and age groups ... 8
4.2 Population ageing ... 12
4.3 Comparison of our projection with UN’s projection ... 15
4.3.1 Comparison of population projection assumptions ... 15
4.3.2 Comparison of population projection results ... 17
5 Conclusion and policy implications ... 19
1. Introduction
China has experienced rapid fertility decline since the 1970s. The total fertility rate dropped from 5.81 in 1970 to 1.67 in 2005. Meanwhile, China’s life expectancy has increased dramatically as a result of socioeconomic development and advancements in science and medicine.The life expectancy at birth was 40.8 years in 1950 and increased by 2005 to 70.5 and 73.7 years for males and females, respectively. The rapid fertility decline combined with the increase in life expectancy brings a dramatic change in the age structure of population. China is expected to have a fast population ageing in the next two to three decades. The working age population is expected to stop growing and begin to decline while the elderly population aged 65 and over is expected to increase rapidly. But how fast is population ageing in China? The speed of ageing will be influenced by future fertility, mortality and migration. China’s family planning policy has made dominant contribution to the fast fertility decline during past four decades and the possible change of the family planning policy will impact China’s future fertility therefore the future population trends. Furthermore, the health program especially rural health program under reform will make difference to future mortality therefore to the future population trends. Since age structure change has important implications for China’s economic growth and social development, Future trends in population in general and age structure in particular will be of great concern and interest for policy makers and development planning purposes. Providing timely and accurate population projections is thus of crucial importance for planning the development strategy in China. This paper aims to conduct population projections over the period of 2005 to 2050 in China under different fertility and mortality scenarios and examines the speed and scope of population ageing and discusses their implications for China’s social security policies and economic development strategies.
The second section of this paper discusses the data and assumptions of fertility rates and mortality improvement paces. The methodology we used to conduct population projection is discussed in section three. Section four displays the projection results and section five discusses policy implications.
2. Data and assumption in the population projection
2.1 Base year data used in the population projection
(Zhai and Chen, 2007), in which China’s education statistics (student enrolments in primary schools) was used to estimated the age-sex patterns of under-reporting in the 2000 census. The education statistics so far available does not enable such adjustment on the 2005 survey data. Using education data, roughly 30 million people are estimated to be missing from the 2000 census population under age 10 (Zhang and Cui 2003; Zhai and Chen 2007). Adjustment has been made to bring back the missing population and a new distribution of population by age and sex is established, which is used as the base year population for this population projection. Despite the uncertainty with the levels of fertility and mortality derived from the 2000 census, we assume that age pattern of fertility and age-sex pattern of mortality from the 2000 census are accurate and utilized in this population projection.
We conduct a two-stage population projection. In the first stage, we make simulation of the population from 2000 to 2005 using particular fertility levels so that the produced total population estimates meet the published numbers from National Bureau of Statistics of China. The population projection after 2005 in the second stage is conducted using different fertility and mortality scenarios.
2.2 Fertility and mortality assumptions
We assume three total fertility rates and four mortality improvement paces for the population projection. Table 1 shows three different fertility assumptions adopted in the population projection from 2005 to 2050, representing low, medium and high fertility scenarios respectively.
Table 1 Fertility assumptions in the population projection
2000-2005 2005-2015 2015-2050
Low Adjusted fertility rate to target the actual
population data
A linear decline in TFR from 1.67 in 2005 to 1.5 in 2015
Constant at 1.5
Medium Same as above A linear increase in TFR from 1.67 in 2005 to 1.8 in 2015
Constant at 1.8
High Same as above A linear increase in TFR from 1.67 in 2005 to 2.1 in 2015
Constant at 2.1
(Guo 2004; Ma 2005). However, there are additional considerations adopting the range of the fertility assumptions in this population projection. A TFR of 1.5 children per woman is currently observed in the developed countries, and China would be approaching to this level in the context of current family planning policy and rapid economic development. The medium level of 1.8 children per woman represents the government-targeted fertility level in the long run when the current fertility policy would be gradually changed to a two-child policy (The Project Group on National Population Development Strategies 2007). In fact, China’s central fertility policy has been increasingly localized and diversified at provincial and lower level (Guo et al. 2003). Currently there is a two-child policy applied to couples whose both sides are only child, and in rare cases to couples whose either side is only child. Birth spacing policies are also relaxed or abolished in many provinces, and restrictions on timing of marriage and births are largely removed from policies. The medium fertility assumption is often considered to be the most likely future scenario. Finally the high fertility scenario of 2.1 represents the replacement level of fertility, a level that will produce a stationary population in the long run1.
Distinguished from most of the existing China population projections which used only one mortality scenario, for example, the population projections conducted by United Nations and World Bank, in our population projection we use four mortality improvement assumptions. According to the 2000 population census data, the average life expectancy at birth in China is 69.63 and 73.33 years for males and females, respectively. Future assumptions about changes in life expectancy at birth are made following the United Nations models (four different paces) for mortality improvement (United Nations 2006). The history of China’s morality improvement from 1950 to 2005 varies among slow pace and very fast paces, so for the future trend of mortality improvement, we also assume four different mortality scenarios: slow, medium, fast and very fast paces. Table 2 shows the life expectancy at birth for both males and females under four different mortality scenarios. Under very fast pace China’s life expectancy at birth will increase to 81.73 and 88.23 years in 2050 for male and female, respectively, while the corresponding figure will be 76.75 and 80.75 under slow pace scenario.
Since international migration is too small (largely null) relative to the total population, we assume zero net migration in China’s population projections as we consider China’s population to be virtually a closed one.
Combining three fertility rate assumptions with four mortality assumptions, we will provide twelve population projections.
1
Replacement fertility refers to a fertility level at which a couple has only enough children to replace themselves. Under the prevailing mortality pattern in China, a TFR of 2.1 is considered to be replacement level (more than 2.0 to allow for childhood mortality).
Table 2 Life expectancy at birth under different mortality scenarios
Paces 2000 2025 2050
Male Female Male Female Male Female
Very fast pace 69.63 73.33 76.39 81.37 81.73 88.23
Fast pace 69.63 73.33 75.19 79.33 78.59 83.13
Medium pace 69.63 73.33 74.49 78.51 77.65 82.05
Slow pace 69.63 73.33 73.71 77.53 76.75 80.75
Source: Authors calculation based on United Nations models for mortality improvement (United Nations 2006).
3. Methodology of the population projection
Following Chen and Liu (2009), we use the cohort-component method and Brass logit transformation method to conduct our population projection.
A fundamental feature of the cohort-component method is that the projected size and age structure of the population at any point in the future depends entirely on the size and age structure at the beginning of the period and the age-specific fertility, mortality, and migration rates over the projection period. Uncertainty in projection outcomes arises not from uncertainty in the formal projection model itself, but from uncertainty in the baseline population data and the assumptions of future trends in fertility, mortality and migration (O'Neill et al. 2001).
The central practice of the population projection is that population of each cohort is calculated forward to the next age group the next year according to age-specific survival ratios derived from assumed age-specific mortality rate through calculating a life table. Life tables in the projection period are calculated by Brass logit techniques (Brass 1968; Brass and Coale 1971) with an initial life table and the assumed life expectancy at birth in future years. However, it is a common practice in projecting mortality to use the model life tables2. It is very likely that using model life tables and adopting the Brass approach discussed above would produce nearly identical results. However, the Brass approach offers a much greater flexibility both in producing a new life table and in programming the population projection. In our population projection, we use the Brass approach to get new life tables based on the initial life table and assumed life expectancy at birth from 2006 to 2050. The initial life table
2
is from China’s 2000 population census. Following the United Nations models for mortality improvement at four different paces, we calculate the changes in life expectancy at birth for the period of 2006 to 2050 under four different paces. Using the Brass logit techniques, we produce new life tables for the projection period.
4. Population projection results
Combined three fertility scenarios with four mortality improvement scenarios, we get 12 population projection results.
4.1 Total sizes of whole population and age groups
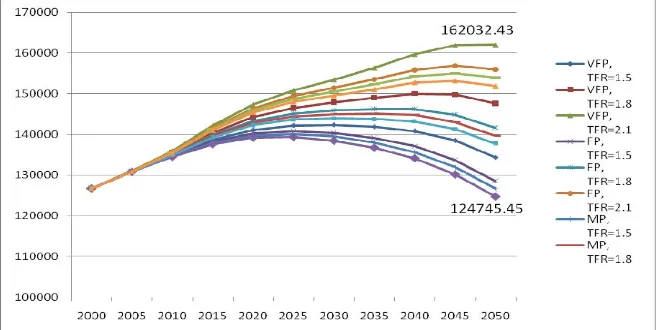
• Big difference in the total size of population among these scenarios
The total population will keep increase and will reach its peak at different time with different numbers under different scenarios (Figure 1). For the Low-SP scenario (low fertility rate plus slow pace of mortality improvement), total population will reach its peak at 1.395 billion in 2023 then decline to 1.247 billion in 2050, while for the high-VF scenario (high fertility rate plus very fast pace of mortality improvement), total population will peak at 1.623 billion in 2047 then decline to 1.620 billion in 2050. The difference of total size of population for these two extreme scenarios in 2050 is 373 million. When we look at the Medium-MP scenario (medium fertility rate plus medium pace of morality improvement), we notice that total population will peak at 1.451 billion in year 2036 and then decline to 1.397 billion in 2050.
• Population aged 0-14
Child population aged 0-14 will keep declining but at different rate under different fertility scenario. We notice that the different paces of mortality improvement do not make big difference in the size of child population, while the fertility rate plays a major role. As Figure 2 shows, there will be 283.86 million child population in 2050 under high fertility scenario (TFR=2.1), while there are only half of that size under low fertility scenario (147.38 million). Under the medium fertility scenario, total size of child population will decline from 312.7 million in 2000 to 208.4 million in 2050.
Figure 2: Population aged 0-14 under different fertility and mortality improvement scenarios (10,000 persons)
• Working age population
Figure 3: Population aged 15-64 (10,000 persons)
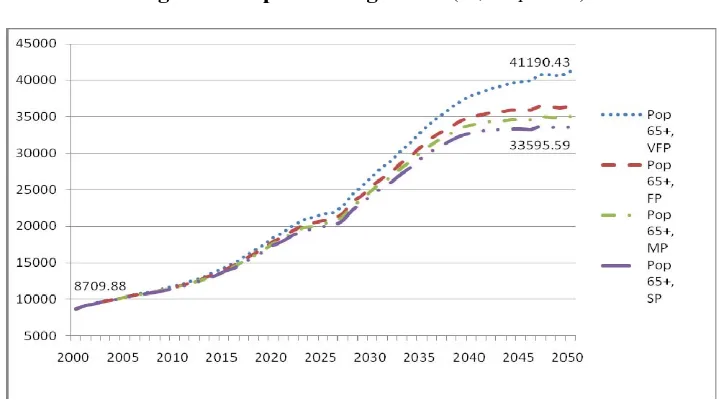
• Elderly population
The fertility rate changes from 2005 can not affect the size of population aged 65 in the projection period (2005 to 2050), while the mortality improvement rate makes a big difference (Figure 4). As a result we get four projections for the population aged 65 and over. We notice that there will be a sharp increase in the population aged 65 and over in the first half of this century under all mortality improvement scenarios. If China’s life expectancy at birth increases at the very fast pace, then there will be 411.9 million elderly population in 2050, which is 4.3 times bigger than that in year 2000. If mortality improves at a slow pace, there will be 335.96 million elderly population in 2050 which is still 3.86 times larger than that in year 2000. Under the medium pace scenario, the elderly population will reach 349.98 million in 2050, which is four times larger than that in 2000. Figure 5 shows that by the end of year 2050, more than one fifth to one third of China’s population will be aged 65 years or older.
Figure 5: The proportion of population aged 65+ (%)
We also notice that the mortality improvement pace will make a big difference in the size of the oldest old population in the projection period (Figure 6). For instance, there will be approximately 76 million differences between the very fast pace and slow pace scenarios. Given the expected fast ageing in China in the next several decades, providing sufficient information about all possible sizes of elderly population will help Chinese government to prepare well for the coming ageing challenge. Since oldest old population which is defined as population aged 80 and over needs intensive care and more health services, detailed information on the evolving trend of this group of population is particularly important for the policy makers.
Figure 6: Population aged 80+ (10,000 persons)
times larger than that in 2000, while if China’s mortality rate improves at a slow pace, then there will be 98.90 million oldest old population in 2050 which is 8.8 times larger than that in 2000. The expected sharp increase in the oldest old population will bring severe challenge for providing enough health and medical services for this group of population. By the end of the mid-century, the proportion of the oldest old population will jump to 6.5 – 10.9 percent while its proportion is only one percent in 2000 (Figure 7). We also notice that the mortality improvement pace will make the size of oldest old population differ dramatically. For instance, oldest old population will be 47.85 million smaller in the slow pace scenario than that in the very fast pace scenario. In the middle pace and fast pace scenarios, there will be 106.84 and 115.24 million oldest old population in 2050, respectively. The difference between medium pace and slow pace scenarios is 7.9 million and 39.9 million between medium pace and very fast paces. These projection results implies that government policies such as environment and health policy, rural medical policy and aged care policy will have important impact on the size of population aged 80 and over.
Figure 7: The proportion of population aged 80+ (%)
4.2 Population ageing
China will experience fast population ageing from the 2010s. Total dependency ratio (TDR), which is defined as the ratio of total number of young population aged 0-14 and older population aged 65 and above over to the total number of working age population aged 15-64, will rise rapidly. The total dependency ratio which has declined since 1990 will continue to decline and reach its lowest point and then begin to rise rapidly because of fast increase in the old dependency ratio. Currently China’s economy is still enjoying the “demographic dividend”3 arisen from its “golden age structure”. The rise of total dependency ratio will
3
close the demographic window and “demographic dividend” will turn into “demographic deficit”. When the demographic window will close depends on the future fertility and mortality rates. For instance, under medium fertility and medium pace of mortality improvement scenario, TDR will continue to decline and reach its lowest point at 0.37 in 2010 and then begin to rise. It will exceed 0.50 at around 2031 when the demographic window will close. The TDR will keep rising at an accelerated speed and reach 0.67 in 2050 (Figure 8). Even under the low fertility and low pace of mortality improvement scenario, TDR will reach 0.63 in 2050. Under the extreme case of high fertility and very fast pace of mortality improvement scenario, TDR will exceed 0.50 at around 2021 when the demographic window will close and TDR will shoot to 0.75 in 2050 which means that one working age person has to support 0.75 dependent person (elderly or child). This is a very heavy burden for the working age population and it may become a continuing drag on economic growth.
Figure 8: Total dependency ratio in China
The evolving trend of China’s TDR during the first half of this century indicates that China will experience rapid population ageing under all possible fertility and mortality scenarios. This fast demographic transition will impose challenges to the sustainability of China’s economic growth. Given the low coverage rate of pension system4 and the fact of huge debt of current pension system in China, reform of the current pension system and establishment of a well functioning pension system are urgent and crucial.
4
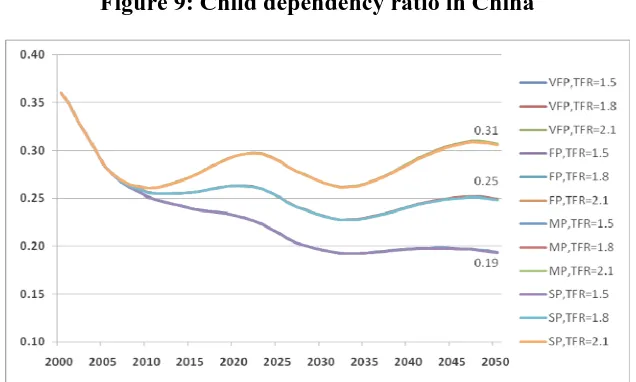
Figure 9: Child dependency ratio in China
The increase in the TDR comes from the old dependency ratio. As Figure 9 shows, the child dependency ratio (CDR)5 will keep declining over the projection period under all fertility and mortality scenarios. Since the mortality rate will not make much difference in the sizes of the young and working age populations, as a result we have three different sets of CDRs which correspond to different fertility assumptions. If the Chinese government maintains its current one-child policy and TFR remains at 1.5, then CDR will keep declining rapidly and reach to 0.19 by the end of 2050. However if the Chinese government can lift its TFR from 1.67 to its target level 1.8 by relaxing the current family planning policy, then CDR will keep dropping and reach to 0.25 by the end of the mid-century.
The declining CDR means that the burden for supporting children is becoming less because of the sustained low fertility rate in China. However, the burden for supporting elderly is becoming heavy. As Figure 10 shows, old dependency ratio (ODR)6 will keep increasing over the projection period and the rate of increase will accelerate after 2030. If China’s mortality improves at a very fast pace and TFR remains very low at 1.5 then the old dependency ratio will increase at the fastest pace among all 12 scenarios and reach 0.53 by the end of 2050 which is more than five times higher than that at the beginning of this century. On the other hand the slowest growth in the ODR is from the high fertility and slow pace of mortality improvement scenario where ODR will increase to 0.37 in 2050. In the most likely scenario (medium fertility and medium pace of mortality improvement), ODR will keep increasing and reach 0.42 by the end of 2050 which is four times higher than that in year 2000. The rapid increase in the ODR drives the TDR to rise dramatically though CDR as a part of TDR is declining. Supporting elderly will become the major financial spending in the near future for the Chinese government.
5
Youth dependency ratio is defined as the population aged 0-14 over the working age population aged 15 to 64. 6
Figure 10: Old dependency ratio in China
4.3 Comparison of our projection with UN’s projection
Since United Nation’s population projection is widely used by the scholars around the world and the Chinese government, in this section we make a comparison between our projections and UN’s.
4.3.1 Comparison of population projection assumptions
First, UN only provides quinquennial projections based on quinquennial data and annual projection is not available. Based on annual data we provide annual projection which is more useful for the scholars and policy makers to use our projection results as an input for further analysis.
Secondly, we use adjusted 2000 population census data as our base year data which will produce more accurate projection than using unadjusted data which is believed to have underestimated China’s actual population.
Thirdly, we use China’s real age and gender specific mortality data and mortality pattern to produce China’s life table for the projection while UN uses model life tables to conduct projection. We believe the projection based China’s own mortality data and mortality pattern is more reliable than the projection which is based on model life tables.
projections based on these assumptions provide all possible cases of China’s population evolving trends during next 40 years. These projections provide policy makers very rich information about all possible paces of population ageing and sizes of elderly population and help them to develop strategies for supporting elderly population. However, UN only uses one mortality improvement assumption - the medium pace of mortality improvement.
Figure 11: UN models for mortality improvement and China’s history
Source: United Nations (1981) and China’s Statistical Yearbook (2005)
Fifthly, comparing with UN’s fertility assumptions, our assumptions are more close to China’s future fertility rates. As Table 3 shows China’s TFR will drop to 1.35 in 2020 and will maintain this level until 2050 in UN’s low fertility scenario. We think this fertility assumption is too low for China given the vast regional variety of its fertility rates. Furthermore we think China’s TFR in 2020 is very unlikely to drop below current developed counties’ level which is 1.5. For the high fertility scenario, China’s TFR will increase to 2.35 in 2020 which is a very optimistic assumption. Given the low fertility in the advanced economic areas and big cities in China and continuing drop of the fertility rate in the rural and underdeveloped areas, even though Chinese government demolishes the one-child policy, China’s TFR is very unlikely to re-bounce to 2.35.
Table 3: The comparison of fertility assumptions between UN and CoPs
2005-2010 2010-2015 2015-2020 2020-2050
Low fertility UN 1.77 1.54 1.44 Constant at 1.35
CoPS A linear decline in TFR from 1.67 in 2005 to 1.5 in 2015
Constant at 1.5
Medium fertility UN 1.77 1.79 1.84 Constant at 1.85
CoPS A linear increase in TFR from 1.67 in 2005 to 1.8 in 2015
Constant at 1.8
High fertility UN 1.77 2.04 2.24 Constant at 2.35
CoPS A linear increase in TFR from 1.67 in 2005 to 2.1 in 2015
Constant at 2.1
Constant fertility UN 1.77 1.77 1.77 1.77
4.3.2 Comparison of population projection results
Figure 12: Comparison of UN’s projection with our projection - total population (10,000 persons)
Figure 13: Comparison of UN’s projection with our projection - population aged 65+ (10,000 persons)
Figure 14: Comparison of UN’s projection with our projection - population aged 65+ in 2050
Figure 15: Comparison of UN’s projection with our projection - population aged 80+ (10,000 persons)
Figure 16: Comparison of UN’s projection with our projection - population aged 80+ in 2050
(10,000 persons)
5. Conclusion and policy implications
• China’s population will keep growth for many years before it begins to fall largely due to the momentum built in the age structure. The population will reach its peak at 1.395 billion in 2023 in the low range and at 1.623 billion in 2047 in the high range. There is big difference in the size of total population among the twelve scenarios. The difference of total size of population for these two extreme scenarios in 2050 is 373 million.
• Working age population is expected to continue growth in next 10 years or so then begins to decline. If Chinese government maintains its current one-child population policy then the working age population will drop sharply in the late of 2010s and there will be 103 million less working age population at the end of the middle century compared with the beginning of the century. The declining working age population combined with the rapid increase in the elderly population will bring a big challenge for the sustainability of the Chinese economy.
• Elderly population is expected to increase rapidly. By the end of 2050 more than one-fifth to one-third of China’s population would be aged 65 and over.
• The oldest old population aged 80 and over is expected to increase sharply. Its size will be 6.2-9.1 times bigger in 2050 than that in 2005. Its proportion will jump from one percent in 2005 to 6.5 - 9 percent in 2050.
• Demographic dividend is expected to continue in next 10 to 20 years. With the rapid increase in the old dependency ratio, the demographic window will close and demographic dividend will turn to demographic debt.
China’s population is experiencing a dramatic change and it is ageing rapidly. However the speed and scope of its ageing are greatly affected by the levels of future fertility and mortality rates. Even though the increase of fertility now can not affect the size of the elderly population in next 40 years, it can slow down the increase of total dependency ratio and reduce the support burden by increasing the size and proportion of working age population. Therefore it will postpone the close of demographic window and China’s economy will benefit from more years of demographic dividend.
improvement paces. Especially the effective pension reform and establishment of aged care services need to be informed by different paces of life expectancy improvement.
Furthermore, the historical experience of China’s life expectancy improvement shows that the improvement of life expectancy varies over the years from slow to very fast paces and the improvement speed is susceptible to government health and environmental policies. With the continuing improvement in the health service, especially in the rural area, and with the reduction in the pollutions and increasing emphasize in the environment protection, the life expectancy at birth may improve at a faster pace and population ageing may become more severe. The Chinese government should be aware of all possible situations of population ageing in the first half of the century and well prepared for all possible challenges they may arise. One of the increasingly pressing challenges involves long-term care, whether taken place at home or in any institution, for the oldest old population in addition to improving the social security system.
References:
Bloom, D. and J. Williamson (1998), Demographic Transitions and Economic Miracles in Emerging Asia. World Bank Economic Review 12(3): 419–456.
Brass, William and Ansley J. Coale (1968), Chapter 3 Methods of Analysis and Estimation. In W. Brass and others. The Demography of Tropical Africa. Princeton University Press. Brass, William (1971), On the scale of mortality. In W. Brass (ed.). Biological Aspects of
Demography. London: Taylor and Francis.
Chen, W. and J. J. Liu (2009), Future Population Trend in China: 2005-2050. Working paper No. G191, Centre of Policy Studies, Monash University, Melbourne, Australia.
Coale, A. J. and P. Demeny (1966), Regional Model Life Tables and Stable Populations. Princeton University Press.
Guo, Zhigang, Erli Zhang, Baochang Gu and Feng Wang (2003), Policy Fertility and Diversity of Fertility Policies in China. Population Research (in Chinese) 5: 1-5. Guo, Zhigang (2004), Research and Discussion on China’s Fertility Level in the 1990s.
Population Research 28(2):10-19
Ma, Y. T. (2005), Too Low Fertility Is Unbelievable. Market and Demographic Analysis 11(6):27-28.
MOHRSS (2008), China Labour and Social Security Yearbook. China Labour and Social Security Press, Beijing, China.
National Bureau of Statistics (NBS). 2002. China 2000 Population Census Tabulations.
China Statistical Publishing House.
National Bureau of Statistics (NBS). 2007. 2005 National One-percent Population Sample Survey Tabulations. China Statistical Publishing House.
O'Neill, B. C., D. Balk, M. Brickman, and M. Ezra (2001), A Guide to Global Population Projections. Demographic Research 4(8):203-288.
www.demographic-research.org/Volumes/Vol4/8/
The Project Group on National Population Development Strategies (2007), China National Population Development Strategies. China Population Publishing House.
United Nations (1981), Model Life Tables for Developing Countries. United Nations publication. Sales No. E.81.XIII.7.
United Nations (2006), Department of Economic and Social Affairs/Population Division.
World Population Prospects: The 2004 Revision, Volume III: Analytical Report.
Zhai, Zh. W. and W. Chen (2007), Chinese Fertility in the 1990s. Population Research
31(1):19-32.
Zhang, W. M. and H. Y. Cui (2003), Estimation of Accuracy of the 2000 Population Census.
Population Research 27(4):25-35