Njoroge Stephen Maina [B.Ed. (Sc)]
1561CEIl148412008
A thesis submitted in partial fulfilment of the requirement for the award of the Degree of Masters of Science in the School ofPure and Applied Sciences of Kenyatta University
ii
DECLARATION
This thesis is my original work and has not been presented for the award of a degree or any other award in any University
Njoroge Stephen Maina Signature~l"Q.)~ . Date
o\~
04-::2,.0\11
:-r Department of Physics,Kenyatta University,
Nairobi, Kenya.
We confirm that the work reported in this thesis was carried out by the candidate under our supervision.
Dr. Patrick Karimi Mwangi Signature.L..,
.
Date...1-~-1-olf
~r
Department ofPhysics,Kenyatta University, Nairobi, Kenya.
Dr. Geoffrey Kihara Rurimo Signature ..~ .... Date ...
Q1-:.~.'t.-:I't.:
...
Department of Physics
DEDICATION
iv
ACKNOWLEDGEMENTS
I would like to express my sincere gratitude to my supervisor Dr. Geoffrey Kihara Rurimo for introducing me to the field of optics. His supervision, ideas and guidance throughout the duration of this work has really encouraged me. Thanks also to my other supervisor Dr. Patrick M. Karimi for his understanding, optimism and inspirations. The motivation got from my supervisors throughout the work lead to completion of my thesis.
The work could not be successful without the financial assistance from the Kenyan government. The grants were channelled through the National Council of Science and Technology (NeST).
TABLE OF CONTENTS
DECLARATION ii
DEDICATION iii
ACKNOWLEDGEMENTS iv
TABLE OF CONTENTS : v
LIST OF TABLES ix
LIST OF FIGURES x
ABBREVIATIONS AND ACRONYMS xiii
LIST OF SYMBOLS xiv
ABSTRACT xvi
CHAPTER 1 1
INTRODUCTION : 1
1.1 Background to the study 1
1.2 Statement of the research problem : 5
1.3 Objectives 6
1.3.1 General objective : 6
1.3.2 Specific objectives 6
1.4 Rationale 6
CHAPTER2 8
vi
2.1 Preview , 8
2.2 Holography 8
2.3 Hologram classification 11
2.4 Hologram recording geometry 11
2.4.1 Transmission hologram 11
2.4.2 Reflection hologram 12
2.5 Holographic recording media thickness 14
2.6 Modulation ofthe incident beam 15
2.7 Recording materials for holography 16
2.7.1 Silver halide emulsion 16
2.7.2 Dichromatedgelatine (DCG) 18
2.7.3 Photopolymer.. 19
2.7.4 Photoresist 20
2.8 Holographic interferometry 21
2.8.1 Double exposure holographic interferometry 22
2.8.2 Time average holographic interferometry 24
2.8.3 Real time holographic interferometry 25
CHAPTER 3 28
THEORETICAL CONSIDERATION 28
3.2 Fringe analysis 31
CHAPTER 4 3-4
MATERlALS AND METHODS : 34
4.1 Introduction 34
4.2 Laser alignment and Laser Beam analysis : : 34
4.3 Lens- pinhole spatial filter.. 36
4.4 Modified Michelson Interferometer set up : 37
4.4.1 Stability requirement 38
4.5 Hologram recording set up 39
4.6 Hologram processing 41
4.6.1 Developing solutions 41
4.6.2 Processing of the exposed holographic plate 42
4.7 Hologram reconstruction 43
4.8 Polarization and holography 45
4.9 Measurement of thermal stress on piston rings 46
CHAPTER 5 49
RESULTS AND DISCUSSION 49
5.1 Introduction 49
5.2 Alignment and Characterization ofthe Laser beam : 49
viii
5.4 Spatial filtering 56
5.5 Holograms recording and processing 58
5.5.1 Recording of holograms : 58
5.5.2 Processing ofholographic plates 61
5.6 Diffraction efficiency ; 65
5.7 Effects of Polarization on hologram quality 72
5.8 Piston ring analysis 73
CHAPTER 6 87
CONCLUSION AND RECOMMENDATIONS 87
6.1 CONCLUSION 87
6.2 RECOMMENDATIONS 88
REFERENCES 90
APPENDICES 97
APPENDIX A: Chemical developers used in processing holographic plates 97
APPENDIX B:Piston rings Interferograms 98
LIST OF TABLES
Table 4.1: Hologram developer composition .42
Table 4.2: Hologram bleaching solution composition 42
Table 4.3: A summary of steps used in holographic plate processing .43
x
LIST OF FIGURES
Figure 2 l..:In li- me optica set up lor recor. 1 c dingh 10 ogram 9
Figure 2.2: Basic set up for recording transmission hologram 12
Figure 4.1: Laser power analysis setup 35
Figure 4.2: Lens pinhole spatial filter set up. He-Ne Laser beam converged at the focal
point of the objective lens where the pinhole was positioned 36
Figure 4.3: Modified Michelson Interferometer set up 38
Figure 4.4: Schematic illustration of holographic recording set-up 40
Figure 4.5: General procedure used in production ofholograms 44
Figure 4.6: Schematic illustration of holographic recording set up used to investigate the
effect ofpolarization 46
Figure 4.7: Real time holographic interferometric set up 47
Figure 5.1: Shows power distribution across the diverging He-Ne laser beam 51
Figure 52: He-Ne laser beam profile 52
Figure 5.3: Modified Michelson Interferometer configuration 53 Figure 5.4: Fringe patterns from modified Michelson Interferometer. 54
Figure 5.5: Schematic illustration oflens pinhole spatial filtering 56
Figure 5.6: Typical diffraction pattern photograph for He-Ne laser light passing through a
circular pinhole : 57
Figure 5.8: Photographs of hologram developer solution.: 61
Figure 5.9: Completely developed holographic plates 63
Figure 5.10: Photographs of holographic images 65
Figure 5.11: Diffraction efficiency as afunction of exposure time for developer X 67
Figure 5.12: Diffraction efficiency as afunction of exposure time for developer Y 67
Figure 5.l3: Diffraction efficiency as a function of exposure time for developer Z 68
Figure 5.l4: Phase contrast from developer X grating and its profile 70
Figure 5.15: Phase contrast from developer Y grating and its profile 71
Figure 5.l6: Phase contrast from developer Z grating and its profile 71
Figure 5.l7: Diffraction efficiency as a function of HWP angle 72
Figure 5.18: Photographs of piston ring hologram images 74
Figure 5.19: Fringe tracing using Atmosfringe software 75
Figure 5.20: Graphical analysis of wavefront surface of piston rings at 25°C 76
Figure 5.21: Graphical analysis of wavefront surface of piston rings at 40°C. 76
Figure 5.22: Graphical analysis of wavefront surface of piston rings at 60°C. 77
Figure 5.23: Graphical analysis of wavefront surface of piston rings at 80°C 77
Figure 5.24: Sample interferograms captured by CCD for piston ring 2 : 77
Figure 5.25: Piston rings interferograms phase representation with respect to
frequency 77
xii
Figure 5.26: Heating and cooling curves for piston ring 3 774
Figure A2: Interferograms for ring 1 , 98
Figure A3: Interferograms for ring 2 99
2D
3D BNC BS CCD DCG DEHI DOEs HI HOEs HOT HP HUDs HWP KEBS LPSF NA Nd:YAG NDT PBS P-V PSF RTHI TAHIABBREVIATIONS AND ACRONYMS
Two Dimensional Three Dimensional Bayonet Neill-Concelman Beam Splitter
Charged Coupled Device Dichromated Gelatine
Double Exposure Holographic Interferometr:y Diffractive Optical Elements
Holographic Interferometry Holographic Optical Elements Holographic Optical Trapping Holographic Plate
Head Up Displays Half Wave Plate
Kenya Bureau of Standards Lens Pinhole Spatial Filter Numerical Aperture
Neodymium Yttrium Aluminium Garnet Non-Destructive Testing
Polarizing Beam Splitter Peak to Valley
Point spread function
xiv
LIST OF SYMBOLS
£0 Permittivity of free space
Etrans(x, y) Transmitted wavefront
A(x,y) Amplitude
E(x,y,t) Electric field of the scattered light
Pdiffracted Diffracted power
Pincident Incident power
t(x,y) Transmission function
CPo(x,y) Phase of object field
CPr(x,y) Phase of reference field
AgBr Silver Bromide
AgCl Silver Chloride
AgH Silver Halide
AgI Silver Iodide
c Speed of light
g Gram
I Intensity of light
ml/cm" Millijoules/square centimetre
rnl Millilitre
mW Milliwatts
nm Nanometre
s Seconds
11 Diffraction efficiency
grating period
xvi
ABSTRACT
Surface analysis plays a crucial role in determining amaterial character. These have led to increased use of non-destructive tests (NDT) due to their non-invasive nature. However, majority of the NDT rely on data acquisition through point to point scanning
process. The techniques are also costly, less sensitive and some require material preparation prior to inspection. To overcome the highlighted challenges, a novel design for surface analysis set up based on Real Time Holographic Interferometry (RTHI) was developed. This was accomplished by aligning the Laser beam, analysing the Laser beam and determination of optimum conditions for recording of phase holograms. The alignment of the Laser beam was performed by adjusting Laser position until the beam struck the same point on a white screen in the near and far field and also ensuring back reflections along the optical axis. The purpose of aligning the Laser beam was to minimize geometrical aberrations in the optical set-up. The aligned Laser beam was
analyzed using spectra 320 analyzer and power meter. The wavelength of the He-Ne Laser was 632.8nm and had a beam waist of 1.099rnm. The maximum power was 21.656~W which decreased to 21.197~W on introduction of an objective lens. To
determine the optimum conditions for recording and processing of holograms, a transmission hologram recording set up was designed and assembled. Fundamental parameters such as exposure time, object profile, processing chemical compositions and
the angle of polarization between the object and reference beams were investigated and analyzed. Optimizing these parameters resulted to high quality holograms as depicted by the diffraction efficiency. The maximum diffraction efficiency of the recorded object holograms was 16% at an exposure time of 20 seconds. Further study using plane wave transmission holograms resulted to hologram images of 21.1% diffraction efficiency at the same exposure time. To test the design concept, three piston rings from a motorcycle
piston were used as objects in the holographic set-up.The object holograms of piston
rings were recorded and after processing the holographic plate, it was placed back on the
holder. It was at this time, the piston ring was subjected to thermal stress and at the same time illuminated by reference and object beams. The generated interferograms were captured by a CCD camera for analysis. The results demonstrated interferograms abnormalities as a result ofthermal stress. This was exhibited by interferograms bending and compressions. Using Atmosfringe version 3.3 and origin version 8.0 softwares an analysis of the interferograms was performed. The peak to valley aberrations ranged from O.0128A to 1.2989A for the whole range of measurements. Using the Fast Fourier Transform analysis of the interference fringes, phase changes were determined for each of the rings. From this result, it was evident that the three rings on the piston have different structural characteristics due to their function. The compression ring had less
CHAPTER 1
INTRODUCTION
1.1 Background to the study
Detection of flaws is the most important task for total quality control. This is because a
minor defect in a manufactured part such as hair fracture in an airplane wing, crack on a
piston ring, magnetic ring or x-ray tube can result to a disaster at a later stage. To perform
the task of fault detection or surface analysis various techniques are employed. More
preferences are accorded to non-destructive testing methods since they do not interfere
with the object or its functionality. These techniques include: visual inspection,
ultrasonic, eddy current, liquid penetration, optical holographic Interferometry, magnetic
particle testing and radiography. The numerous nondestructive techniques give users a
wide choice of selection. However, the sensitivity and accuracy of a given method must
be considered before using.
Optical Interferometry technique provides a means through which optical path difference
can be measured. The measurements of the path difference are done through analysis of
fringe patterns formed as a result of the interference between wavefronts of coherent
light. The optical path difference may be due to mechanical displacements, contour
variation from one surface to the other or change in refractive index of the material.
Among all the nondestructive testing methods, optical interferometry provides the most
accurate and precise measurement. The main limitation of optical interferometry is in
2
limitation has been overcome by holography since it has the ability to replay the
wavefronts at a later time after recording (Ominde, 2010).
The technique of holography was invented by Gabor in 1948. Since its inception,
holography has developed into a full discipline over time. This has made it possible for
the emergence of new disciplines in holography that have grown to maturity. The
technique has also been applied in various fields. In security, holography has been
employed in preventing falsification of documents and industrial products. Some of the
areas where holograms have been in use include credit cards, original covers of computer
software programmes, tickets, certificates; identification cards among others. In aviation
industries, holography has contributed in making flying easy through the use of Head up
displays (HUDs). This is made possible by allowing the essential flights or weapons
aiming information to be optically superimposed into pilot's field of view. Holography
has also been employed in scanners. By use of holographic scanners, problems associated
with mirror scanners have been solved. The holographic scanners also have the most
promising application in point of sale terminals and high speed non impact printing.
Holographic data storage isone of the applications of holography that has attracted robust
research. This has been catalyzed by demand for high capacity and fast data transfer as a
result of high growth in internet and digitized communication. Since 1960s' holographic
data storage has been promising due to its outstanding characteristic in data storage and
data retrieval rate (Psaltis and Mok, 1995; Coufal and Psaltis, 2000). Unlike other data
offering increased data storage. Heerden (1963) postulated the principle behind
holographic data storage. He also highlighted that multiple holograms can be
superimposed or multiplexed in a volume media.
One of the disciplines of holography that have great potential as a non-destructive
technique is optical holographic interferometry. In optical holographic interferometry the
wavefronts are stored in a hologram and later compared interferometically with another
wavefront (Vest, 1979). Holographic interferometry (HI) has been used both in research
and testing application as a non-contacting tool for displacement, strain and vibration
studies. The technique is highly sensitive, accurate and can be employed on any type of
surface. The advantage of the method over other optical measurement methods is the
non-invasive nature of its operation. For this purpose, HI may be employed in detection
of deformities on automobile parts, electronic circuitry, aeronautic, communication
devices among other surfaces. The technique may be used in defects detection after
production, during and after the normal operations. Applying HI, three dimensional (3D)
interferograms image of an object is obtained (Hartmann and Lucie, 2001).
To detect surface deformation using HI, interferograms of an object are recorded before
and after subjecting it to strain. Light from the two images (holograms) is made to
interfere with each other leading to generation of interferograms. The generated
interferograms are as a result of the phase difference between the wavefronts. The
generated interferograms hold information about the surface deformation of the object
4
information about the object from which the two wa~efronts originated are acquired
(Caulfield, 1979). The object deformation can easily be visualized by the discontinuity in
fringe pattern (Meith, 2002). The contrast of the interference pattern at any point in the
hologram plane ismeasured by the fringe visibility V which is given by the relation:
(1.1)
Where Imax and Imin are maximum irradiance and minimum irradiance respectively.
In order to compare the wavefronts holographically various ways may be employed. The
following are the basic methods of HI;
(i) Double exposure holographic interferometry (DEHI).
(ii) Real time holographic interferometry (RTHI).
(iii) Time average holographic interferometry (TARI).
This work was aimed at using real time holographic interferometry technique in thermal
stress analysis. Through the work, use of the technique as an industrial inspecting tool in
high precision measurement was assessed. One of the noted advantages of using the
technique is that analysis of the object can be done in real time. This makes the technique
1.2 Statement of the research problem
Non-destructive testing techniques have been conventionally applied in surface
inspection. These techniques have been adopted since they do not interfere with the
material under investigation. However, majority of non-destructive techniques rely on
data acquisition through a point to point scanning process. Some of the techniques may
also require surface preparation before inspection process is carried out. Unlike other non-destructive tests (NDT), holographic interferometry (HI) is capable of providing full
field information about the object under test making it more advantageous than the other
non-destructive inspecting techniques. The optical system proposed is capable of making
surface precision measurement. The high sensitivity of the technique ensures that
subsurface and inferior details of the object under investigation are obtained.
To facilitate the application of holographic interferometry determination of optimum
conditions for hologram recording and processing is necessary. This calls for a thorough
investigation and evaluation of holograms recording at certain conditions. As a
6
1.3 Objectives
1.3.1 General objective
The aim of this work is to configure a three dimensional surface inspecting technique based on nondestructive real time holographic interferometry.
1.3.2 Specific objectives
1. To configure a surface analyzing technique for detection of surface defects. 2. To determine optimum conditions for recording and processing of holograms. 3. To test the workability of the concept by inspecting the surface of piston rings. 4. To analyze the recorded interferograms for defects location by use of a software.
1.4 Rationale
There are great challenges for manufacturers to improve the quality of the production at the expense of reducing warranty cost. During life service, materials are subj ected to a variety of misuse which may provoke invisible degradation that leads to collapse. The production process may also degenerate surface quality. This calls for an effective inspection technique to assure precision and accuracy.
methods. Inspection of surfaces plays a very critical role in assuring that the structural
components and systems perform their functions in a reliable and cost effective manner.
This has motivated governments and nongovernmental organisation to set up inspection
bodies.
For most inspecting bodies especially in the developing countries, HI has not yet been
employed as an inspection technique. In comparison with the other classical inspection
methods RTHI is highly sensitive. The method is capable of making full field inspection
unlike other NDT which relies on point to point inspection. These translate to fast
inspection process. The sensitivity of the method to a fraction of the wavelength of laser
light in use allows defect detection before they grow to readily observable macroscopic
size. The technique makes it possible to monitor defect continuously without removing
the specimen from its usual environment. The property makes it possible to investigate
property of a material when subjected to a certain stress such as force, pressure, heat.
More advantages of using HI as an inspection technique includes; strain is measured
regardless of the direction, variation of strain over the entire sample can be obtained with
ease, there is no physical contact with the sample, sample preparation is not required and
8
CHAPTER 2
LITERATURE REVIEW
2.1 Preview
This chapter gives a preview on holographic technology and the application of HI in
anomalies detection. A detailed development of holography and its basic principle has
been highlighted. The application of various branches of HI in different fields as a NDT .
procedure has been discussed comprehensively. This has been done by discussing various
research works done in the HI field.
2.2 Holography
Holography is a technique of recording and reconstruction of wavefronts (Fulari et al.,
2010). The word holography was coined from the Greek words 'holos' which means
'whole' or 'entire' and 'graphein' which means 'to write'(Develis and Reynolds, 1967).
The principle of reconstructing wavefronts was discovered way back in 1948 by Dennis
Gabon, a Hungarian physicist. The invention was accidental as the main purpose of his work was to improve the resolving power of an electron microscope (Magnussen, 2004).
The earlier challenge that Gabor intended to solve on electron microscope was not
The technique involves recording of the interference patterns between wavefield scattered by the scene and a coherence background referred to as reference beam. As a result of the
interference, information is coded in terms of fringes which are invisible to the human eye due to their high spatial frequency. Reconstruction of the object wavefronts is done
by illuminating the hologram using the reference beam. An observer views a 3-D image which exhibits all the effects of perception and depth of the focus (Orninde, 2010).
f--_-1I!!!;::;--_---+-+---I.H 0logra m
plate
Figure 2.1: In-line optical set up for recording hologram. This setup represents Gabor's
optical system for recording holograms of transparent objects (Smith, 1975).
After discovery of holography, it received little attention due to challenges that faced
implementation of the technique. At the time of its invention there lacked a light source
that was sufficiently coherent. The inventor used a mercury lamp asthe light source and this produced holograms of low quality (Harper, 2010). The lack of highly coherent monochromatic source of light thus slowed down activities on the new invention. With the invention of laser technology around 1960, holography was reborn accelerating
10
The other challenge that faced holography at the time of invention was the recording
geometry (in-line axis) used by Gabor asillustrated in figure 2.1. Inthe set up, reference
and object beams were located along the axis normal to the holographic plate. This
method of holograms recording has senous disadvantages during hologram
reconstruction. This is because of superimposing of diffracted order over each other
. leading to formation of 'twin image'. The only suitable objects to be recorded using
Gabor's original set up were transparent bodies (Collier et al., 1971; Kihara, 1997).
Another limitation of the set up is that reference beam must be transmitted through the
hologram for the hologram image to be reconstructed. This result to light propagation on
the viewer's eyes as the image is transmitted through the hologram plate. This causes
safety problems especially when a high power laser is used (Saxby, 1994). The problem
was eliminated by developing an 'off-axis' reference beam technique (Kihara, 1997).
Using 'off-axis' reference beam the two images and the reconstruction wave are spatially
separated. This was attained by bringing two sets of light waves that originate from a
coherent light source to interfere on a holographic plate (Leith and Upatnieks, 1962;
2.3 Hologram classification
Holograms are classified in different ways depending on certain characteristics; the
classification of holograms is based on recording geometry (optical set-up), thickn.ess of
the holographic film/plate and the modulation of incident beam (Magnussen, 2004).·
2.4 Hologram recording geometry
The recording geometry is responsible for the type of hologram recorded. This leads to
formation of either transmission hologram or reflection hologram. This depends on the
angle between the reference beam and object beam. When the angle is less than 1800 a
transmission hologram is formed and when more than 1800 a reflection hologram is
recorded (Magnussen, 2004; Ominde, 2010).
2.4.1 Transmission hologram
The object and reference beam illuminate the holographic plate from the same side.
During reconstruction the hologram must be viewed with coherent light source. This is
done by illuminating the hologram from the opposite side of the viewer or observer. This makes the illuminating light to pass through the emulsion and recreates the object (Vacca,
2001). There are two types of transmission holograms, namely; in-axis transmission
12
Laser
Object
Beam
splitter
Spatial Holographic
filter plate
Figure 2.2: Basic set up for recording transmission hologram (Vest, 1979).
In off-axis transmission holograms, opaque objects are used to record holograms and not
transparent objects as shown in figure 2.2. This is because the object used in recording
hologram using the geometry must reflect light to the holographic plate a property that
lacks on transparent objects. Unlike in-line holographic system, reference beam in off
-axis holography system propagates in a different angular direction from the object beam
(Vest, 1979).
2.4.2 Reflection hologram
Reflection hologram is also referred to as Lippman hologram or Denisyuk hologram or
white light holograms since they can be observed under ordinary light. Reflection
hologram recording has similarities to Lippmann's technique for color photography
(Gabor, 1971). The two interfering waves (object and reference beam) illuminate the
holographic plate from opposite sides. Unlike transmission hologram, reflection
hologram requires 10 to 100 times power for recording to be done. These results in
increased exposure time as compared to transmission hologram recording. The set up
used in recording of reflection hologram is as illustrated by figure 2.3.
Laser
Beam splitter
Holographic plate
Mirror
I
Spatial filter
Figure 2.3: Basic set up for recording reflection hologram (Smith, 1975).
To record a good reflection hologram, the object must be highly reflective as the
reference beam is attenuated as it passes through the emulsion. Unless the object is highly
reflective very little light from the object will be reflected to the film. In reflection
holograms, the interference fringes are formed when the two beams travelling in different
directions interact. The fringes formed are in layers more or less parallel to the emulsion
14
is reflected from the plate. It is from this phenomenon they are referred to as reflection
holograms (Caulfield, 1979).
Reflection holograms can also be recorded in two steps. In the first step a transmission
hologram is recorded (HI) which sometimes is the master hologram through which
multiple copies are made. In the second step, hologram image copies are transferred from
the master hologram. This method ofrecording reflection hologram solves the problem of
getting half the object in front of the plate and the other half at the back of the plate.
2.5 Holographic recording media thickness
Another broad category of hologram classification is made when differentiating between
thin holograms and thick (volume) holograms. This category is based on the thickness of
the film to the interference fringe spacing. A hologram is considered to be thick if the
thickness of the recording medium is greater than the spacing between the interference
fringes. The distance between the fringes is dependent on a number of factors. These
include: wavelength of the light source and the density of the medium which is dependent
on the refractive index of the medium (Ominde, 2010).
The Q-parameter is also used to differentiate between thick and thin hologram. If the Q
less than one, a thick hologram is formed. This criterion IS not always adequate
(Hariharan, 1996). The Q parameter is defined by the equation:
Q
=
2n:J..,dnA (2.1)
Where A is the recording wavelength, d is thickness of the emulsion, n is the refractive
index of the emulsion andA is the grating period (number of fringes per unit length).
2.6 Modulation of the incident beam
This type of hologram classification reveals how incident light is directed and modulated
to form avirtual or a real image of the object. The created structure within the emulsion can lead to the variation of the refractive index or medium density.
In phase modulated materials, the refractive index, n is modulated throughout the entire
emulsion due to the interference waves. After development, phase holograms produce
very bright images since they do not absorb light. In amplitude modulated materials, the
absorption constant changes due to exposed light. During reconstruction, the film absorbs
a lot of light hence reducing the hologram image diffraction efficiency. In order to
transform amplitude hologram to phase hologram, bleaching is done. This leads to
16
2.7 Recording materials for holography
Ideal holographic recording materials must satisfy certain conditions. These are: high
resolving power to ensure that desired interference patterns are completely recorded i.e.
no fine details of the scene are lost, low noise, should be recyclable (reversible), have
linear sensitivity that match with the available laser wavelength, high diffraction
efficiency (modulation capability), no shrinkage (detuning), fast hologram formation, no
absorption, readily and cheaply available. The major disadvantage is that not even one
material satisfies all the required properties to qualify its use in hologram recording since
such materials have not been made. Some of the materials that have been developed are:
silver halide emulsion, dichromated gelatine (DCG), photopolymers, photoresist,
photo chromic, solgel, polyelectrolyte, photorefractive and photo active liquid crystalline
polymer. Another disadvantage of working with holographic recording materials is that
some of them are not available commercially.
2.7.1 Silver halide emulsion
Silver halide emulsion has been widely used as hologram recording material and was the
first used in recording holograms by Gabor. It was originally used since it was both
inexpensive and sensitive to common laser wavelengths. The material consists of a layer
of gelatin in which microscopic grains of silver halide (AgH) are dispersed. The gelatine
layer is coated onto a glass substrate where emulsion thickness ranges from 511m to
AgH emulsion is the most widely used material in recording holograms because it is
highly sensitive with a sensitivity of about 10-S
mj/cm
2to
10-3mj/cm
2, has highresolving power, does not require complex processing and handling equipment, has
numerous applications, commercially available in numerous sizes and quantity. The
emulsion is suitable for making both amplitude and phase holograms. But the material
has certain drawbacks such as high absorption characteristics, inherent noise, limited
linear response, irreversible recording, printout problems in phase hologram and wet
processing requirement which limits its practical application to standard holography
(Bjelkhagen, 1996).
The holographic plates are coated with an emulsion of gelatine containing suspended
grains of silver halide particles. The three types of silver halide are silver bromide
(AgBr), silver chloride (Agel) and silver iodide(AgI). The most widely used silver
halides are AgBr and Agel since they are more sensitive to light. AgI is never used alone. To increase its sensitivity, a combination of AgI and AgBr is used. This mixture
has much higher sensitivity than AgBr and Agel mixture. The sensitivity of each silver
halide compound differs with different light wavelength. Agel is only sensitive to violet
and uv light. AgBr absorbs light to a maximum wavelength of 490nm and on adding Agel the sensitivity is increased to about 520nm. In order to increase the spectral
sensitivity of the silver halide to other parts of the spectrum, dyes are added (Famia et al.,
18
On exposure to light, photon absorption by the grain in the emulsion frees an electron
leading to formation of Br atom
Br:
+
h
v
~ Br
+
e
At the same time, silver ion gains electron forming silver atom
The freed silver atoms produced in the exposed emulsion constitute the latent image. The
advantage of recording latent image is that the optical property of the emulsion does not
vary during exposure unlike recording materials that images are formed in real time
(Hariharan, 1990; Famia et al., 1991; Neipp et al., 2001).
2.7.2 Dichromatedgelatine CDCG)
The material has excellent holographic properties which include: low scattering, high
refractive index modulation, able to provide holographic plane grating of almost
theoretical spectroscopic resolving power, can be redeveloped to get any desired
diffraction efficiency (11), high signal to noise ratio. The low noise is due to low
absorption over awide range of wavelength and good image quality (Wang etal., 1998). The thickness of DCG can be varied by controlling exposure and processing conditions.
This property supersedes other recording materials which shrink after development. This
DCG is not commonly used despite its high promise in property. This has been due to
environmental instability, sensitive only to ultra-violet and blue light, requires a complex
wetting process, low sensitivity requiring a powerful light source and poor shelf life. A
phase hologram of the material is not capable of resisting high relative humidity and
photosensitive layer distorts during image development (Meyerhofer, 1977; Pantelic' and
Muric', 2001). In order to improve the spectral sensitivity of DCG beyond 520 nm
wavelength the material is dye sensitized (Pantelic and Muric, 2001). Since the material
is not commercially available, its uses are limited.
2.7.3 Photopolymer
Though silver halide based holographic recording materials have been used in recording
of holograms since early times they are expensive in-terms of material and processing
cost. They also lack immediate access to the finished products. Dichromated gelatine and
convectional photoresist materials are less expensive in comparison with silver halide
materials, they require wet processing steps to develop, fix image and consequently
involves delayed holographic image access time. Their exposure time is quite long. This
has called for the development of photopolymer based holographic materials.
Photopolymers are inexpensive and they are self processing (Michael at el., 2006)
During the recording process optical interference patterns initiate polymerization in the
photo reactive material. In this case, polymerization occurs in the light intensity maxima
20
regions. In the bright regions, the freed radicals within the monomer lead to vinyl
polymerization. This polymerization lowers the chemical potential of monomers in the
region leading to their migration from dark to bright zones (Dhar, 2006). The material is
very promising in holographic applications especially on holographic data storage and
holographic optical elements (HOEs). To ascertain its applicability in the said areas,
holography research is being carried outto optimize the material (Samui, 2008).
2.7.4 Photoresist
Photoresists are sensitive organic materials. These materials are mostly used in recording
of embossed holograms. After development, the material yields a surface profile whose
depth is proportional to the intensity of the interference patterns. One of the major
drawbacks of the material is the scattering of light during read out. This results in
distortion of read out image as a result of interference of the read out beam with image
beam. The material sensitivity is low thus limiting its application with He-Ne Laser
wavelength. There are two types of photoresist materials, namely, positive and negative
photoresists. For a negative photoresist material, the exposed region becomes insoluble
and unexposed regions are soluble making them easily washed away during development.
For a positive photoresist material, the exposed area becomes soluble while the
unexposed is insoluble. The exposed region is easily washed away during development
2.8 Holographic interferometry
One of the major applications of holography in non-destructive testing is holographic
interferometry (HI). The technique was developed in the late 1960s by Stetson and
Powell (Leith and Upatnieks, 1962; 1964). The technique has been widely used in
detecting deformities on opaque surfaces or refractive index variation in a transparent
media (Matsumoto et al., 1974; Balalovet al., 1990). Unlike other non-destructive testing
methods HI is able to make a full field inspection as opposed to point inspection. Using
the technique, it is possible to resolve optical path change up to one hundredth of the light
source wavelength. This implies that the technique yields extremely accurate
measurement of minute surface deformation hence very advantageous (Hildebrand and
Haines, 1966; Taniguchi and Takagi, 2001).
Other advantages of using HI as an inspection technique include: strain is measured
regardless of the direction, variation of strain over the entire sample can be obtained with
ease, there is no physical contact with the sample, sample preparation is not required and
the experimental set up is simple to implement. HI technique involves interference of two
coherent wavefronts reflected from two different states of the object or scene (Hariharan,
1996; Habib, 200 1). The technique involves comparison of wavefronts reflected by an
object under test in three major ways. These are: double exposure, real time and time
22
2.8.1 Double exposure holographic interferometry
Double exposure holographic interferometry is an effective and convenient method of
measuring surface displacement, especially the out of plane displacement. In double
exposure holographic interferometry (DEHI), the wavefronts to be compared are stored in
the same hologram. The hologram of the object under study is recorded at two exposures
in the same holographic plate separated by times and the plate developed properly (Ilio et
al., 1997). On reconstruction the two images interfere with each other. Any disturbance
of the object between exposures is observed in the interference patterns produced as a
result of change in the optical path length of the object beam (Lyavshuk and Lyalikov,
2006). The method has been used in recording of fast events e.g. bullet flight in a
chamber.
Hong et al. (1996) described a method for using DEHI in early detection ofbreast cancer.
The method is capable of detecting mild breast lesion which X-ray mammography is
unable to detect. DEHI is capable of detecting lesion of less than 5mm thus increasing
survival rate ofthe patient to an accuracy of more than 75%. The technique has been used
by Kozuchi (2002) for deformation measurement of bones due to thermal stress. A good
correlation between deformation and thermal stress of the bone surface was observed.
Almoro and Daza (1998) described how HI can be used to detect microscopic
deformation using DEHI. For quantitative analysis of three dimensional deformations,
single DEHI to get a progressive phase distribution. The phase distribution is
proportional to actual surface deformation (Kreis, 1986; 1996). The work was able to
overcome the limitation of earlier work done by Pryputneculcz and Bowley, 1978;
Rightley et al. (1992) on quantitative analysis. The earlier methods used micrometer
translators which are devices with poor spatial resolution.
Sfarra et al. (2010) described comparative investigation of nondestructive testing of
honey comb structures by HI and infrared thermography. In this work HI was
successively applied in detection of debond between the skin and the honeycomb core on
honeycomb panel. The work was carried out under controlled environmental condition.
The technique leads to obtaining meaningful information on the structural characteristics
of the components by observing surface deformations produced as the specimen was
subjected to thermal stress.
Evans and Premier (1989) studied thermal deformation of diesel engine pistons. The
work was aimed at studying absolute movement measurement at diametrically opposite
piston position. The obtained results compared very well with finite-element method. Ratman and Evans (1993) detected thermal expansion of the piston using holographic
technique. The results obtained using holography technique compared well with those
obtained from finite element method. Holography also was used to access the effect of
assumptions made in generation of finite element model. Holographic method gave
reliable results whose accuracy was higher than the result obtained from finite element
24
This led to obtaining radial deformation of heated piston. Ratnam and Evans (1991)
described a method of investigating expansion control characteristics of steel inserts on
piston using holographic interferometry. From the study it was noted that at temperature
range of 130De to 140De steel insert lost control of aluminum alloy skirt. The study
demonstrated that HI technique provides deformation behavior of the piston subjeoted to
different temperature.
Mohammend et at. (2008) investigated thermal stress leading to nano-defects formation
on butt welding joints. This was investigated using DEHI and the results obtained
compared with X-ray technique. The fringe patterns obtained through DEHI indicated
position of the defects as a result of thermal stress. They reported a good correlation of
results deduced from the two techniques.
2.8.2 Time average holographic interferometry
In time average holographic interferometry (TAHI) , a simple holographic exposure is
made during 0bj ect oscillation or movement. The technique is mostly employed on
steady state vibration problems. Using TARI, parameters in vibration analyses are
obtained. They include vibration models and amplitude distribution.
Unlike the other HI techniques, TARI exposure period is much longer that the oscillation
period, thus time average view of the object field is recorded (powell and Stetson, 1965).
during the exposure time of the hologram recording. This translates to formation of interference patterns upon the hologram reconstruction. The technique has been applied
to study the vibration of musical instruments (Friedberg, 2004).
Holographic interferometry has been used in inspection of new Lita bank notes
(Vasiliauskas etal.,2004). The use ofthe method made itpossible to distinguish between genuine and fake bank notes. The technique involved recording of the interference pattern produced by the notes that did not coincide with each other.
2.8.3 Real time holographic interferometry
Real time holographic interferometry eritails recording of a hologram in a photosensitive plate. Upon proper development the plate is replaced exactly in its original position. The hologram is then illuminated by both reference and object beam. In real time holographic
interferometry (RTHI), light scattered by the object is made to interfere with holographic reconstructed image of the object itself. When the model under test is loaded,
deformation takes place. This results in change of the optical path length of the object
26
interference fringes observed. The method is highly sensitive to external influence thus
Optical set up used should be constructed to be extremely stable (Magnussen, 2004).
RTHI was used to measure strain caused by polymerization shrinkage of dental
composite. The technique was able to precisely measure deformation on hard dental
tissue (Puskar et al., 2010). Similarly Matsmoto et al. (2007) proposed a method of
analyzing deformation by real time holographic interferometry (RTHI). A load was
applied on femur and reconstructed image recorded on a video tape through CCD camera.
Radha, 1989 undertook a study of thermal stress on thin films by use ofRTHI. Using the
novel technique, thermal stress on the conductive coatings was studied. The work led.to
presentation of thermal stress evaluation on iron and copper thin films. Toal et al. (2012)
demonstrated the use of RTHI in study of photopolymer material shrinkage as this is one
of its major drawbacks in holography application. Interferograms obtained were captured
by use of a CMOS for analysis. From their study, evaluation of the material shrinkage
and optical path length changes were determined. The work resulted in observing
photopolmer shrinkage of the order of3.5%.
To test the design concept piston rings were used. In an automotive, piston rings are
designed to effectively transfer heat from the piston to the cylinder walls, stabilize the
piston, regulate oil consumption and seal the combustion chamber (Anderson et al.,
2002). These translate to high powered engines, zero fuel wastage, adequate fuel
contributes to friction reduction. This attribute leads to reduction of energy loss inform of
heat, reduces material thermal stress, strain and stiction. In mechanical systems,
efficiency is increased (Etsion and Ryk, 2006).
The studies carried out by different authors have clearly demonstrated how holography
and holographic techniques have been applied in different fields. Despite the much work
carried out there still lie some challenges that require to be addressed. Some of the
challenges are; the composition of chemicals to be used in development of holograms,
angle of polarisation between object and reference beams, holographic plate exposure
time and object profile. The problem of replacing the developed plate on the holder was
28
CHAPTER 3
THEORETICAL CONSIDERATION
3.1 Holography theory
During the recording process, the electric field, Eo (x, y, t) of the scattered light by the
object inthe x-y plane can be expressed as:
(3.1)
where Ea(x, y) is complex amplitude given by the expression:
Ea(x,y) =Ao(x,y)eiq>,,(x,y) (3.2)
where Ao(x,y)and cpo(x,y)represent amplitude and phase, respectively. The electric field
represented by equation (3.1) can be expressed as (Kihara, 1997)
Eo (x,y, t) =Aa(x,y)[ cos(wt -qJo(x,y)] -sin[wt -qJo(x,y)] (3.3)
the resulting intensity described by equation (3.3) averaged over a number of optical
period is proportional to amplitude squared given as:
(3.4)
where c is the speed of light and Cois permittivity of free space. This is the intensity
recorded in the holographic film placed at an x-y plane. Phase relation is obtained by
(3.5)
ArCx,y) and CPr(x,y) are amplitude and phase of reference beam respectively. When the
object and reference beams interfere, the total intensity, Itat the interference plane is
given by:
(3.6)
where
I
E
tl2 is the magnitude of the resultant amplitude and is given by:1 12 2 2
Er(x,y) =Ao (x,y)+Ar (x,y)+2Ao(x,y)Ar(x,y)cos[tpo(x,y)-tpr(x,y)] (3.7)
Too btain athree dimensional image, reconstruction of the wavefront is done. During this
process, one of the original wavefronts is used to reconstruct the other. In a situation
where the wavefronts have acquired extra information, the information will appear in the
reconstruction wavefront.
The transmission function t (x, y)of the developed holographic film is largest when the
intensity of the incident light is high. Hence one can assume that
t
(x, y) is directlyproportional to the intensity [(x, y)to which the film was exposed. If the developed film
is illuminated with E(x,y), the transmitted wavefront becomes.
Errans(x,y) =t(x,y)E(x,y)
=yl(x,y)E(x,y) (3.8)
where y is a constant of proportionality between t(x,y) and I(x,y) and is determined by
30
lex, y)=lt(x,y) , it implies that the total intensity to which the film is exposed initially is
from object and reference fields only. Thus from equation 3.8 we can get
Elrons(x,y) =y[Ao2(x, y) +Ar2(x,y) +2Ao (x,y)Ar 2(x, Y)COS[qJo(x, y) -qJr(x, y)]]Areirp,
.(3.9)
The last part ofthe equation 3.9; (yA/ (x, y)[Ao(x, y)eiY'o(x,y)]) can be expressed as:
(3.10)
whereEa(x,y) is the complex amplitude of the object wavefront. If yA2r is a constant
independent of co-ordinates (x, y) and by equating this constant to be S, we get the
expression
(3.ll)
Implying that Elrans(x, y) is proportional to object wavefront Eo(x,y) hence reconstruction is
met.
In determination changes in an object whose hologram has been recorded, the complex
amplitude of the holographically reconstructed wave EaCx,y), that is the instantaneous
object wave can be expressed as Eo(x,y)eiD.q>(X,y,l), where Ilcp(x,Y,t) is the phase change at
time, t. Since in real time holographic Interferometry interferograms are recorded
(3.12)
The interferograms anses from the second term of equation (3.12). To capture the interferogram a CCD of high sampling rate is used.
3.2 Fringe analysis
Fringe analysis is the process of extracting quantitative measurement from fringes. During fringe processing phase fields are extracted from one or many intensities fields
that have been acquired. To analyse the fringes various algorithms have been used which include; phase stepping (Chan et al., 1995), Fourier Fringe Analysis (Takeda et al., 1982), wavelet transform (Abidet al., 2006) and many other.
In Fourier Fringe Analysis (FFA), analysis of the fringes is carried out in two major
stages. These are phase extraction and phase unwrapping. In the first stage the extraction of the phase of the fringe pattern is done by use of the Fourier transform and carrying out
the filtering of the frequency domain. This leads to production ofwrapped phase which is
limited to 71: and -71: range. The wrapped phase contains 271: jump which should be
32
The phase signal cp(x,y) has to be extracted from the intensity distribution of the source fringe pattern by the fringe analysis procedure. An intensity profile g(x,y) in a fringe
pattern may be expressed by the relation (Robinson and Reid, 1993).
g(x,y) =a(x,y) +b(x,y)cos[27ifox +tp(x,y)] (3.13)
Where a(x,y); b(x,y) and <p(x,y) represents background illumination, amplitude information and phase modulation of fringes respectively while farepresent the carrier frequency. Takeda et al. (1982) expressed the cosine term in equation 3.13 as a
summation of two components
g(x,y) =a(x,y)c(x,y)ei2n.hIX +c'(x,y)e-i27ifox (3.14)
b(x y)eil'(x,y) * b(x,y)e-irp(x,y)
where c(x,y) = '2 and c = 2 Taking one dimensional Fourier transform we get
(3.15) Where A(fx, y) describes spectrum of background illumination, ctf ;-fo,Y) and
c* (fx +fo,y) are spectra of the deformed fringes. Transforming the term c(fx,y) back into its original spatial domain using; the one dimension Fourier transform we get the real and imaginary part of c(x;y) given as;
Im{c(x,y)} =b(x,y)sin(ip(x,y)) (3.17)
And the phase information isexpressed as;
If/(x,y)
=
tan" Im{c(x,y)}Re{c(x,y)}
(3.18)
This implies that the phase extracted from the fringe is equal to the tan inverse of the
34
CHAPTER 4
MATERIALS AND METHODS
4.1 Introduction
This chapter discusses in detail the design and configuration of surface analyses set up
based on real time holographic interferometry. The experimental procedures of
holography and holographic interferometry techniques are presented. The work begins by
considering hologram recording and processing fundamentals as well as the
implementation of real time holographic interferometry.
4.2 Laser alignment and Laser Beam analysis.
Laser alignment is an important activity while working with Lasers. To align the Laser
the beam from the He-Ne Laser was made to illuminate a white screen. The points at
which the Laser beam struck the white screen were marked. This exercise was performed
when the screen was near the Laser head (near field) and at the far field on the same path
line. Using the screws on the Laser mount, the Laser beam was adjusted until it struck the
same spot in the near field and the far field on the screen. The exercise was repeated for
each optical device introduced in the set up.
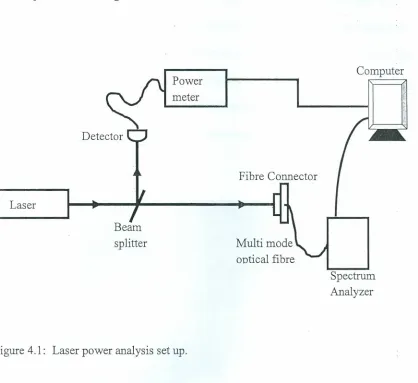
After aligning the Laser beam, the analysis of the beam was done. This was dictated by
necessity of a well collimated coherent laser source in hologram recording. To satisfy this
meter and a modified Michelson Interferometer. Analysis of the Laser beam was done to
determine its wavelength, the beam waist and power of the Laser beam used in the
experiment. Using the power analysing instruments (spectrum analyser and power meter)
the set up illustrated in figure 4.1 was used.
Computer
Laser
Power
meter
Fibre Connector
Beam splitter
Spectrum Analyzer
Figure 4.1: Laser power analysis set up.
Using the optical Spectra Analyser and power meter the laser beam was focused onto a
detector head. A BNC cable was used to interface Spectra Analyser with the computer
while a USB cable was used to interface the power meter to a computer for data
36
4.3 Lens- pinhole spatial filter
The Laser beam must have a smooth intensity profile for its applications in holography.
In practical situation this is not the case since the beam acquires undesirable intensity
variation as it propagates. These variations in intensity affect its profile and thus its
applicability. To ensure a smooth Laser beam profile, spatial filtering was carried out.
The spatial filtering set up comprised of a microscope objective lens and a pinhole. The
microscope objective lens of magnification XIO and 0.25 numerical aperture (NA) was
placed on the path of the aligned Laser beam followed by a pinhole as in figure 4.2. The
pinhole was placed at the focal length of the microscope objective lens.
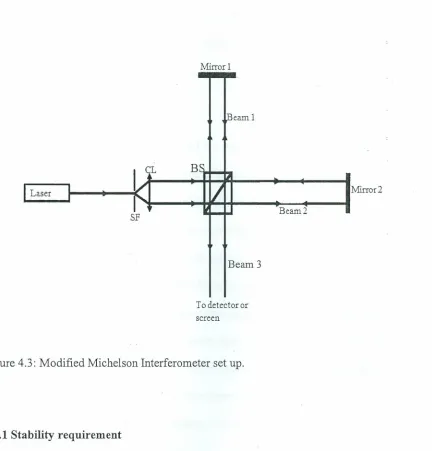
4.4 Modified Michelson Interferometer set up
Michelson Interferometer is an optical device of high precision and versatility. The
instrument is used in investigating small changes in the optical path lengths. In this work,
a modified Michelson Interferometer was set up to investigate the stability of the optical
set up. The Interferometer set up consisted of the following: a He-Ne Laser (~35 mW and
632.8 nm) as the source of light, a 50:50 Beam Splitter, two reflecting mirrors (one of the
mirrors was fixed (mirror 1) while the mirror 2 was movable i.e. adjustable), 30flm
pinhole, white screen, CCD camera and personal computer (pc) used to display the
captured interferograms by the CCD camera. The modification of the Michelson
interferometer was done by introducing spatial filtering optical devices.
Light from the He-Ne laser was directed onto a lens pinhole spatial filter (LPSF) as shown in figure 4.3. The beam splitter (BS) was oriented at 45° with respect to the Laser
beam. The reflected beam by the BS, along with the beam reflected by mirror 1 formed
Beams 1. The transmitted beam by the BS, along with the beam reflected by mirror 2
formed Beams 2. After reflections by the plane mirrors, Beams 1and 2 recombine at the
BS and form an interference pattern which is observed as interference, Beams 3. On
impinging this beam on a screen or CCD interference fringes were observed. The nature
38
Mirrorl
[Beam 1
I;L
BI;;~
I
LaserJ
I
Beam 2SF
Beam 3
Mirror 2
To detector or screen
Figure 4.3: Modified Michelson Interferometer set up.
4.4.1 Stability requirement
The recording of the hologram image is sensitive to vibration even of very low amplitude
(a fraction of Laser beam wavelength). The vibration that may occur during the
holographic plate/ film exposure adversely affects' the quality of the hologram image recorded. Since under normal circumstance the sources of vibrations are so diverse,
Michelson Interferometer was employed. The stability of the interference fringes was
studied when different activities were being performed inthe laboratory and its environs.·
4.5 Hologram recording set up
The recording of the holograms was carried out in a darkroom. This was done at a time
when the movements within the room minimized and temperature equilibrium attained.
All the apparatus (optical components and the object) were mounted on the optical table by use of magnetic mounts or screws. The object was placed in such a way that beam illumination was maxima andequalized at all parts of the object whose hologram was to
be recorded. To record the holograms PFG-01 holographic plates ofdimensions 63mrn x
40
.CL BS Object
Objectbeam
SF
Figure 4.4: Schematic illustration ofholographic recording set-up.
Light from the linearly polarised He-Ne laser was directed into the microscope objective
lens and later through the pinhole. Using abeam splitter BS the Laser beam was split to
give two arms. The object beam is the beam transmitted through the Beam Splitter and
incident on the object whose hologram is to be recorded. This beam was reflected to the
holographic plate by the object as depicted in figure 4.4. The beam reflected by the beam
splitter (the reference beam) was incident on the holographic plate.
Before exposing the holographic plate, the set-up was allowed to stabilize for about 120
seconds and the stability of the Laser beam was ensured by monitoring through a
spectrum analyzer. The two beams were superimposed on the holographic plate and
seconds in steps of 5 seconds. After the holographic plates were exposed, the plates were
ready for processing.
4.6 Hologram processing
4.6.1 Developing solutions
After the holographic plate had been exposed it was ready for processing to obtain the
holographic image. To process the exposed holographic plates, different developing
solutions were prepared. The three developers used in the experiments were labelled as
developer X, Z and Y for ease of reference. Developer Z is a commercial developer by
trade name JD-2 processing kit from which the other two developers were derived. Each
of the proposed developing solutions consisted of two main parts (Part A and Part B)
dissolved in one litre of distilled water. The solution to be used inprocessing the exposed
holographic plate was prepared by mixing equal volumes of part A and part B. The
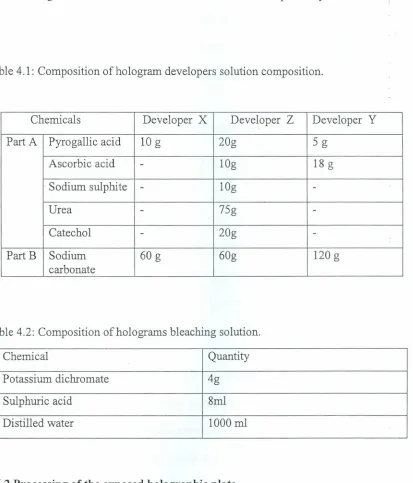
chemicals compositions ofthe three developers are as illustrated intable 4.1. Each part of
the developer was dissolved into one litre of clean distilled water tomake a solution.
The bleaching solution was prepared by dissolving 4g of potassium dichromate (VI) in 8
ml of concentrated sulphuric acid and the mixture made to one litre using distilled water
as summarized in table 4.2. To accelerate the drying of the processed holographic plate
42
litre of distilled water. The summary of the composition of the holographic developer
and bleaching solutions are as shown in tables 4.1 and 4.2 respectively.
Table 4.1: Composition of hologram developers solution composition.
Chemicals Developer X Developer Z Developer Y
Part A Pyrogallic acid 10g 20g 5 g
Ascorbic acid - 109 18g
.Sodium sulphite - 109
-Urea - 75g
-Catechol - 20g
-PartB Sodium 60g 60g 120g
carbonate
Table 4.2: Composition of holograms bleaching solution.
Chemical Quantity
Potassium dichromate 4g
Sulphuric acid 8ml
Distilled water 1000 rnl
4.6.2 Processing of the exposed holographic plate
The processing ofthe exposed holographic plate was done using the developer chemicals
as tabulated in the tables 4.1 and 4.2. Each holographic plate was developed using a
was dipped into containers containing freshly prepared developer solution for a
controlled period of time. In the developing solution the already exposed holographic
plate was dipped and held with emulsion side facing upward for 120s. All through the
developing period the exposed holographic plate was swirled in the developing solution.
The plate was then rinsed for about 150s by use of distilled water.
Table 4.3: A summary of steps used in holographic plate processing.
Activity Time (s)
Developer solution 120
Rinsing 150
Bleaching 120
Rinsing 180
Wetting of plate using photo flow 30
The exposed holographic plate after rinsing was dipped into a bleaching solution for 120s
followed by rinsing for 180s. The rinsed holographic plate was placed into a photo flow
solution for 30s. After the holographic plate had been processed through the five steps it
was placed in an upright position for natural drying.
4.7 Hologram reconstruction
To replay the hologram, the dry processed holographic plate was placed back in the
44
blocked usmg a shutter. In order to determine the quality of the hologram images
formed, the reconstructed hologram was analyzed to determine its diffraction efficiency
.defined as:
f)
=
PdiffractedPincident
(4.1)
Where 11is the diffraction efficiency, Pdiffracted is power of the first order diffracted beam
and Pincident is power of the incident beam. A summary of the hologram production
experimental work is as shown infigure 4.5 as a flow chart.
Optical alignment of holographic system
~ 7
\!
Recording process
I
~ 7
\/
I
Developing processI
\7
I
Reconstruction processI
7
Capturing ·ofholo gram images
4.8 Polarization and holography
Investigation of the effect of polarization on plane wave transmission holograms was also carried out. The experiment involved the introduction of a polarizing beam splitter (PBS) on the reference beam path. This was done to generate the s-polarized and p-polarized beams. The power of the emerging s- and p-polarized beams from the reference. beam was measured.
46
~vI1
Figure 4.6: Schematic illustration of holographic recording set up used to investigate the effect of polarization
The set-up illustrated in figure 4.6 was used to study the effect of polarization on
hologram quality. Using the set-up plane wave transmission holograms were recorded as
. fO 00 0 dOh
the commercial half wave plate was rotated atangles 0 0,22.5,45,67.5, an 90. T e
reconstructed holographic images were analysed and their diffraction efficiencies
determined.
4.9 Measurement of thermal stress on piston rings
To test the design concept, three motor cycle piston rings from the same piston were used. First the object holograms for each piston ring were recorded and processed as
plate containing the piston ring image. The interferograms generated were captured and
used as the reference interferogram. Caution was observed to avoid piston ring or plate
displacement in reference to their initial positions.
To measure the thermal effect on the piston rings the set up shown in figure 4.7 was used.
The heating device was placed behind the piston ring and a CCD camera (resolution of
the camera used is 1024x768 pixels) placed at a position behind the holographic plate. To
measure the temperature changes, two thermo couples were used.
48
On heating the piston nng as the developed holographic plate was illuminated by
reference and object beams m the same orientation as during hologram recording,
interferograms were generated. The generated interferograms were captured by the CCD
camera at temperature intervals of 5°C. The experiment was done for each of the three
piston rings. The recording of the interferogram for each ring varied. The maximum
temper~~re used in recording of the interferograms for ring 1, 2 and 3 were l20DC,
110DC and 135°C respectively. Using ring 1 cooling effect on the piston ring was studied.
To determine the effect of thermal stress on the piston rings analysis of the
interferograms was done using Atmosfringe version 3.3 and origin version 8.0 softwares.
The experimental procedures discussed in this chapter led to attainment of the results