Multi Objective Optimization for Distributed
Generation Allocation in Distribution Systems
Prof. Dr. Z. H. Osman1, Mena Ragy Amen2
Professor, Dept. of Electrical Power &Mach., Faculty of Engineering, Cairo Univ., Egypt1 M.Sc Student, Dept. of Electrical Power & Mach., Faculty of Engineering, Cairo Univ., Egypt 2
ABSTRACT: Due to the rapid increase of electricity consumption, operations of conventional power systems have several disadvantages, e.g. considerable amount of transmission loss; transmission line congestion; increasing environmental impact, etc. These problems can be solved via installing Distributed Generation (DG) in distribution systems. For realizing technical and economical advantages for the distribution systems, proper allocation and type of these units have been investigated.
The aim of this paper is to propose an algorithm for solving DG allocation problem in distribution systems taking into consideration technical and economic aspects. To realize this objective, the revised non-dominated sorting genetic algorithm (NSGA-II) has been utilized. The proposed algorithm has been applied on IEEE 69- bus system. The results show good agreement with the previous given in literature results of that standard distribution system.
KEYWORDS: Distributed Generation, NSGA-II, Multi objective Optimization, Cost, Losses, Voltage Deviations.
I. INTRODUCTION
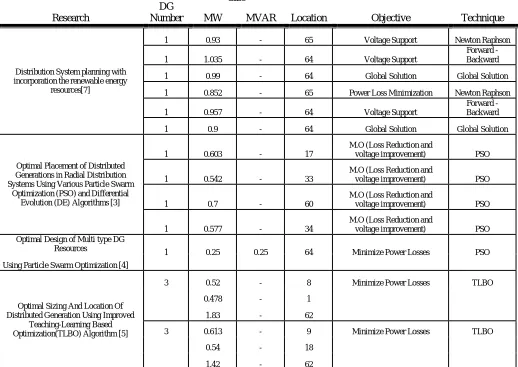
Electricity demand is growing in faster rate compared to the other forms of energy because it can be generated efficiently, transmitted easily and utilized ultimately at a very reasonable cost. The electrical energy is generated in bulk at a centralized place, called Generating Station and is transmitted over a long distance (Transmission System) to Distribution System, and finally is used ultimately by a large number of users. During all these processes, several technical and non-technical problems such as amount of transmission loss, transmission line congestion, increasing environmental impact etc., arise. These problems can be solved/minimized by the installation of Distributed Generation (DG) [1]. A number of studies were conducted to investigate the criteria, e.g. power loss reduction, improve system voltage profile, and increase system reliability, for optimal sizing and sitting of DGs units. Different techniques, such as particle swarm, genetic algorithm, and differential evolution, have been adopted to solve the problem of DG allocation in Distribution Systems [2] - [7]. These techniques have been applied on standard test systems, such as 33-bus and 69 bus systems, etc. Table -1 summarizes the literature results of IEEE-69 Test system including the related objectives and the used optimization technique.
Research
DG Number
Size
Location Objective Technique MW MVAR
Distribution System planning with incorporation the renewable energy
resources[7]
1 0.93 - 65 Voltage Support Newton Raphson
1 1.035 - 64 Voltage Support
Forward - Backward
1 0.99 - 64 Global Solution Global Solution
1 0.852 - 65 Power Loss Minimization Newton Raphson
1 0.957 - 64 Voltage Support
Forward - Backward
1 0.9 - 64 Global Solution Global Solution
Optimal Placement of Distributed Generations in Radial Distribution Systems Using Various Particle Swarm
Optimization (PSO) and Differential Evolution (DE) Algorithms [3]
1 0.603 - 17
M.O (Loss Reduction and
voltage improvement) PSO
1 0.542 - 33
M.O (Loss Reduction and
voltage improvement) PSO
1 0.7 - 60
M.O (Loss Reduction and
voltage improvement) PSO
1 0.577 - 34
M.O (Loss Reduction and
voltage improvement) PSO
Optimal Design of Multi type DG
Resources 1 0.25 0.25 64 Minimize Power Losses PSO
Using Particle Swarm Optimization [4]
Optimal Sizing And Location Of Distributed Generation Using Improved
Teaching-Learning Based Optimization(TLBO) Algorithm [5]
3 0.52 - 8 Minimize Power Losses TLBO
0.478 - 1
1.83 - 62
3 0.613 - 9 Minimize Power Losses TLBO
0.54 - 18
1.42 - 62
II. METHODOLOGY
The formulation of DG location and sizing problem as a mono-objective optimization is not quite practical. Power system planners aim to take advantage of multi-type DG considering several objectives at the same time. This study proposes a multi-objective optimal placement of multi-type of DG for enhancement of primary distribution system performance. A Pareto-based NSGA-II is proposed to find locations and sizes of a specified number of DG within distribution system. Multi objective functions include levelized voltage deviation LVD, minimize system real power loss and total investment cost. The final decision can be made by the fuzzy method to find the trade off solutions among the three different objective functions
.
Objective Function
DG planning problem formulation:
The multi-objective optimization technique to determine the optimal locations and sizes of DG units within primary distribution system is as follows:
Min f(x, u) = [ (x, u), (x, u), (x, u)]
Where, , and are the system real power loss , annualized investment cost, and load voltage deviation, respectively.
The first objective is to minimize the system real power loss
Min (x, u) =
Minimize the annualized Investment Cost:
Min (x ,u) = (∗( ) ) ∗(C .+ (h∗C + C )∗n)∗P
Where, ‘r’ is the interest rate, ‘n’ study period to be 5 years, C .& C &C ($/KW) are the capital and
variable operation and maintenance costs ($/KWH) and fixed operation and maintenance costs ($/KW-year) respectively, h is number of operation hour per year and P (KW) is the DG active Power.
Minimize the bus voltage deviation:
Min (x , u) = V −V
V
nB is the number of system buses (exclude main feeding bus) Constraints:
≤ ≤
≤ ≤
S is the transmission capacity of branch i
NSGA-II Algorithm
Non-dominated Sorting Genetic Algorithm (NSGA) has established itself as a benchmark algorithm for Multi objective Optimization. The determination of pareto-optimal solutions is the key to its success. However, the basic algorithm suffers from a high order of complexity, which renders its useful for practical applications. Among the variants of NSGA, several attempts have been made to reduce the complexity. Though successful in reducing the runtime complexity, there is scope for further improvements, especially considering that the populations involved are frequently of large size. The improved algorithm NSGA-II is applied to the problem. Results of comparative tests are presented showing that the improved algorithm performs well on large populations [8]-[10].
Load Flow Analysis
Distribution systems are mainly radial system. Therefore, the traditional Newton-Raphson or Gauss Siedle method may not converge, and special load flow method must be used, such as forward-backward sweep method [11]. Simply, the forward sweep (FW) starts the calculation from the root to final bus in the system. The backward sweep (BW) is the opposite which starts calculation from the last order bus to the root bus. In the following, the standard BW/FW sweep power flow method is written in metrical notation using complex variables. Branch impedances are given as a vector Z corresponding to distribution line model containing a series positive sequence impedance for line or transformer. Shunt impedances are not considered in this approach. Branches are organized according to an appropriate numbering scheme (list), which details are provided in [11].
Z =[Z01 ... Zij ... ZmnB] where, Zij = Rij + jXij
(2)
(4) (3)
(6) (5)
A. Step 1 - Backward Sweep
For each iteration k, branch currents are aggregated from loads to origin: Jk = − T · Ik
The relationship between nodal currents Ik and branch currents Jk is set through an upper triangular matrix T accomplishing the Kirchhoff Current Laws (KCL). Each element Iik of Ik associated to node i, is calculated as function of injected powers Si and its voltage profile Vk as shown below
Iik = Si*/Vik* i = 1, ..., nB
B. Step 2 - Forward Sweep
Nodal voltage vector V is updated according to the Kirchhoff Voltage Laws (KVL), using previously calculated branch currents vector J, branch impedances vector Z, and TT is the Transpose of matrix T.
V k+1 = V0 − TT · DZ · Jk
Where, V0 is nB elements vector with all entries set at voltage at origin (swing node), and the branch impedances DZ is the diagonal matrix of vector Z.
Vk+1 = V0 + TT · DZ · T · Ik V k+1 = V0 + TRX · Ik where, TRX = TT ·DZ ·T
C. Convergence
Updated voltages are compared with previous voltages in order to perform the convergence check
ε ≥ |Vi k+1− Vik| i = 1, ..., nB
Fuzzy Decision Making
Fuzzy ranking method is employed to extract the best compromise solution out of the available non-dominated solutions depending upon its highest rank. In real applications, due to imprecision of judgments by decision makers a fuzzy membership function adopted to provide the best compromise solution out of the pareto-optimal solutions which satisfies different goals to some extent.
The membership value (μ) ‘0’ indicates incompatibility with the sets, while ‘1’ means full compatibility. In other words, the membership value indicates the degree of satisfaction of the solution for an objective. μ (Fi) is a strictly monotonic decreasing function [12].
III. DEVELOPED ALGORITHM
Step 1: Read Power System Data.
Step 2: Enter the cost optimization function constants that illustrated later in Table - 2. Step 3: Start NSGA-II with the initial population.
Step 5: Start Backward/Forward Sweep to calculate the load flow from equations (9) and (10). Step 6: Calculate objective function values.
Step 7: Creating New population, crowding sort, creating offspring population. Step 8: Perform tournament selection, crossover and mutation.
Step 9: Perform the non dominated sorting algorithm to find the optimal solutions for the design variables (Size and Location) .
Step 10: Select the best compromise solution in the output result.
Step 11: Rerun the system Power flow to calculate the power losses, voltage profile and voltage deviation and calculate the solution overall cost.
Step 12: Repeat the previous steps for the various types of distributed generation unit.
(9)
(10)
(11)
(13) (12)
(14)
IV. APPLICATIONS General Assumptions
Study Period is 5 Years. Loads are constant PQ loads with constant power factor and constant during study period. DG power factor is unity. All DG resources can install at every bus within system (except at the slack bus). Interest rate is 10 %. For Wind and Solar DGs, there are main factors which affect the placement of DG for example the value of the average wind speed for the wind DG and the solar irradiation value for the solar DG. These factors did not consider in this paper, i.e. all buses are suitable for DG location irrespective of each type. DG placement of different types do not allow at the same bus. Multiple DG placement of the same type is allowed at the same bus. Cost function constants of equation (3) are given in Table 1[13]. The revenue from power loss saving is not taken into account in this work. The approach is minimizing the system peak real power loss (f ), annualized investment cost (f ) and LVD (f ). NSGA-II Parameters are as follows [10]:
Objective functions (M): 3 Population size: 600 Iteration: 200
The study is applied on the IEEE 69 Bus system. The parameters, namely C , C and C in equation (3) take the values given in Table -2 [13] according to the type of DG. Then, after the optimization process ended, selected solutions are studied beside the compromise solution.
V. RESULTS AND DISCUSSION
In this paper, modified NSGA-II technique is utilized to solve the DG optimization allocation problem and find the optimal size and Location according to the type of DG unit and the developed algorithm. Seven Different types are studied in this paper, namely, Biomass, Micro Turbine, Solar, Wind, Hydro, Combined Heat and Power CHP, and Fuel Cell. Single DG Solution has been studied as well as the Multi DG Solutions.
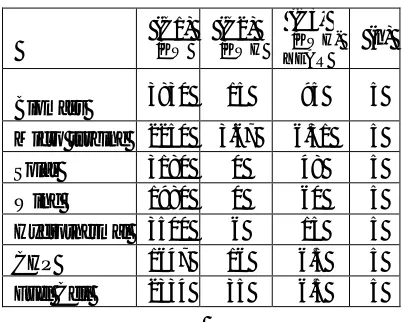
Table -3 shows the Single DG Studied solutions brief. Highlighted solution refers to the matching results with the literature survey in Sec. I.
(C1)
$/KW
(C2)
$/KWH
(C3)
$/KWH- YEAR
(n)
Technology P loss (KW)
DG Size
(KW) Location
Loss Reduction
Voltage Deviation
min Voltage
p.u.
Total Cost M$
Biomass 173 459 58 23% 7% 0.9247 2.3 Biomass 198 723 67 12% 7% 0.915 3.6 MicroTurbine 215 138 25 4% 8% 0.9111 0.3 MicroTurbine 141 633 64 37% 8% 0.9133 1.5 Solar 199 534 19 11% 6% 0.9138 1.8 Solar 199 920 23 11% 5% 0.9164 3.1 Wind 129 764 64 43% 5% 0.9442 1.7 Wind 198 725 66 12% 7% 0.915 1.7 Hydro 202 430 26 10% 7% 0.9135 1.7 Hydro 164 408 64 27% 6% 0.9301 1.6 Hydro 194 493 10 14% 7% 0.9159 1.9 CHP 196 815 20 13% 6% 0.9157 1.9 Fuel cell 201 499 11 10% 8% 0.9141 1.9
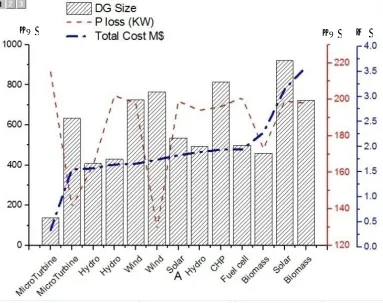
Fig. 1 illustrates the DG size (KW); the corresponding Ploss (KW) and the total cost (M$). The presentation is according to the cost in ascending manner.
Table -3: Single DG Studied Solutions Brief
Fig. 1: Single DG Size Studied Cases (Cost Ascending) Summary
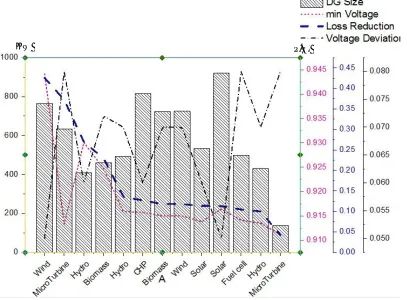
Fig. 2 depicts the DG size (KW) and the corresponding min voltage (p.u.); percentage Loss reduction and percentage voltage deviation.
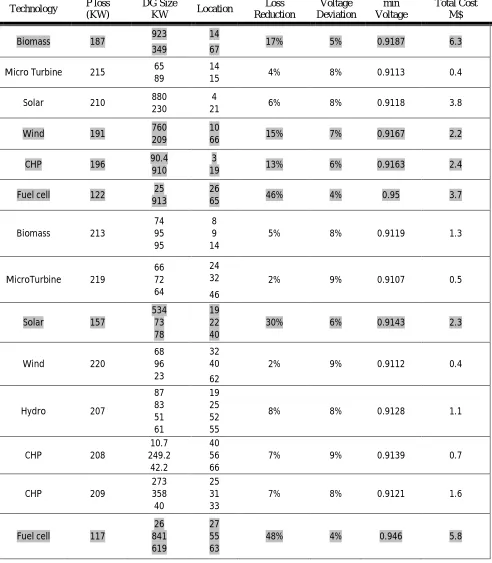
Table -4 shows the Multi DG Studied Solutions brief. For Multi DG Solution, the Total cost during the study period (5 Years) is varied from 0.4 to 6.3 M$, while the Loss reduction is ranged from 2% to 48%. Voltage Deviation according to eq. (4) is changed from 4% to 9% compared to 9% in the original case. The min voltage is ranged from 0.9107 to 0.95 p.u. compared to 0.9102 p.u. in the original case. Highlighted solution refers to the matching results with the literature survey in Sec. I.
Fig 2: Single DG Size Studied Cases (Losses Reduction Descending) Summary
Technology P loss (KW)
DG Size
KW Location
Loss Reduction Voltage Deviation min Voltage Total Cost M$
Biomass 187 923 14 17% 5% 0.9187 6.3
349 67
Micro Turbine 215 65 89
14
15 4% 8% 0.9113 0.4
Solar 210 880
230
4
21 6% 8% 0.9118 3.8
Wind 191 760
209
10
66 15% 7% 0.9167 2.2
CHP 196 90.4
910
3
19 13% 6% 0.9163 2.4
Fuel cell 122 25 913
26
65 46% 4% 0.95 3.7
Biomass 213
74 95 95 8 9 14
5% 8% 0.9119 1.3
MicroTurbine 219
66 72 64
24
32 2% 9% 0.9107 0.5
46
Solar 157
534 73 78 19 22 40
30% 6% 0.9143 2.3
Wind 220
68 96 23
32
40 2% 9% 0.9112 0.4
62
Hydro 207
87 83 51 61 19 25 52 55
8% 8% 0.9128 1.1
CHP 208
10.7 249.2 42.2 40 56 66
7% 9% 0.9139 0.7
CHP 209
273 358 40 25 31 33
7% 8% 0.9121 1.6
Fuel cell 117
26 841 619 27 55 63
48% 4% 0.946 5.8
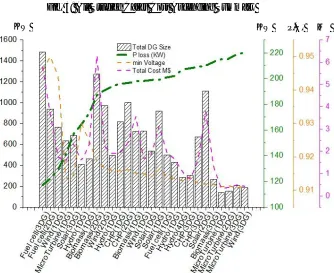
Fig. 3 illustrates the DG size (KW) and the corresponding Ploss (KW) , min voltage (P.U.) and the total cost (M$). The presentation depicts the cost values in ascending manner. Fig. 4 depicts all DG studied solutions. It illustrates the DG size (KW) and the corresponding Ploss (KW), min voltage (P.U.) and the total cost (M$). The drawing shows the Ploss values in ascending order.
KW KW P.U. M$
Fig. 3: All Studied Cases Cost Ascending Summary
Fig. 4: All Studied Cases (PlossAscending) Summary
Compromising Solutions using Fuzzy ranking Method
By applying Fuzzy compromise concept, the compromise solutions are summarized in table -5
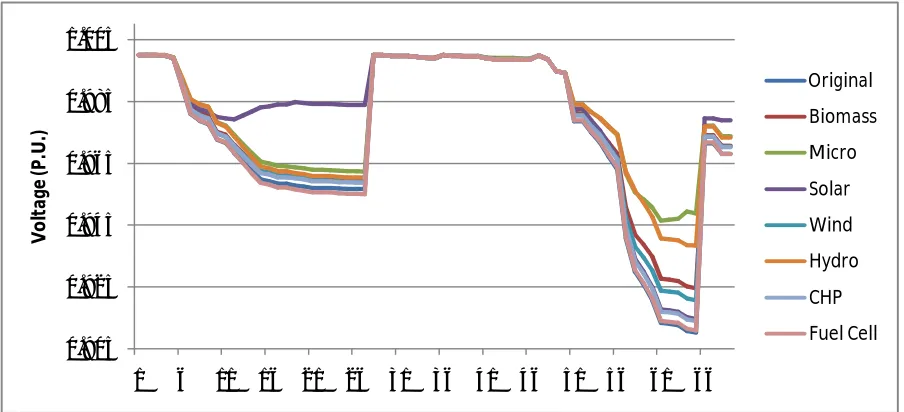
Following are the indicative drawings and summary of the compromise solutions. Fig. 5 shows the system voltage profile for different technologies. Micro turbine solution shows great enhancement in the voltage profile (min value).
DG Size (KW)
Location DG Total (KW) µ Compromise Ploss (KW) Voltage Deviation Cost (M$) Bus No.
Biomass 386 60 386 0.0999 173.73 7.30% 1.915332
Micro Turbine
64 44
884 0.0585 125.18 4.80% 2.15899 820 64
Solar
534 19
732 0.0577 193 6.40% 2.50344 73 22
78 40 47 52
Wind 75 15 325 0.108 185 7.90% 0.741 250 61
Hydro
84 6
951 0.0671 140.427 5.50% 3.649748 816 58
51 65
CHP
70.7 40
362.4 0.0683 208 8.70% 0.862621 249.5 56
42.2 66
Fuel Cell 52 23 523 0.0984 220 9.80% 2.039439 471 50
Fig. 5: Voltage Profile Summary of all compromise solutions
0.905 0.925 0.945 0.965 0.985 1.005
1 6 11 16 21 26 31 36 41 46 51 56 61 66
V o lt ag e (P .U .) Original Biomass Micro Solar Wind Hydro CHP Fuel Cell
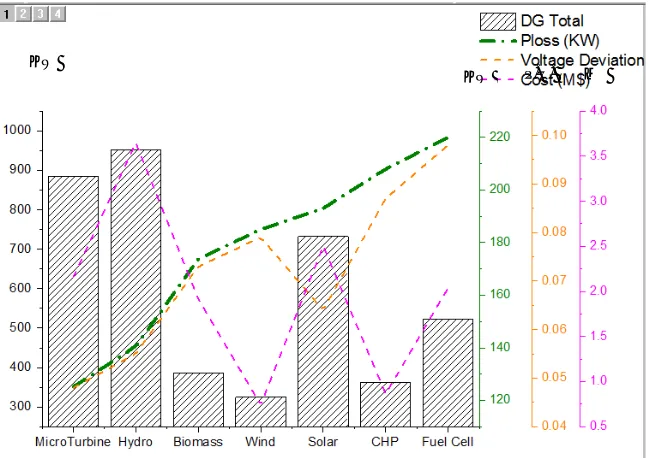
From Table -5 the DG size is ranged from 325 to 951 KW. All cases show good loss reduction except the Fuel Cell solution. The voltage deviation is varied form 4.8% to 9.8%; the total cost is changed from 0.7 to 3.6 M$. Fig. 6 summarizes DG compromise solutions. It illustrates the DG size (KW) and the corresponding Ploss (KW), min voltage (p.u.) and the total cost (M$). The Ploss is illustrated in ascending manner.
Fig. 7 gives DG compromise solutions. It illustrates the DG size (KW); and the corresponding Ploss (KW); min voltage (p.u.) and the total cost (M$). In that figure the cost is illustrated in ascending values.
KW
KW P.U. M$
KW KW P.U. M$
Fig. 6: All compromise solutions - Ploss Ascending Summary
Comparing the above results with that given in table -1 that summarizes the results of previous studies on that system (IEEE 69- bus system), however, not taking into account the economical point, but using various objectives and optimization techniques, show that bus 64 is the global solution for the location of DG unit, whose size is ranged from 0.8 MW to 1.2 MW irrespective of the DG technology.
VI. CONCLUSION
Due to the rapid increase of electricity consumption; and to make use of renewable energy generation, distributed generation units are now applied in distribution systems. For realizing technical and economical benefits of them, proper allocation of these units has been studied.
A review of literature indicates that most of the problem of optimal location and sizing of DG has formulated as a objective optimization problem. However, the formulation of DG location and sizing problem as a mono-objective optimization is not quite practical. This paper formulates the problem as multi mono-objectives and presents an algorithm which differentiates between different technologies of DG applications. The objectives are minimization of capital and operation cost of DG units; minimization of system peak loss; and minimization of voltage deviation with respect to nominal bus voltage. The optimization tool is the modified Non-Dominated Sorting Genetic Algorithm NSGA-II. For verification of the proposed algorithm, it is applied on IEEE 69- bus system.
The system has been studied for various generating unit types to trace their effect on changing the optimized size and location of distributed generation units. The results compared to the published works, and it was showing great potential for the proposed algorithm. In addition, the study concludes that certain bus (buses) in the system may be preferable for DG applications irrespective of the considered objectives.
REFERENCES
[1] Pavlos S. Georgilakis, and Nikos D. Hatziargyriou, " Optimal Distributed Generation Placement in Power Distribution Networks: Models, Methods, and Future Research," IEEE Transaction on Power Systems, vol. 28, no. 3, pp.3420- 3428, Aug. 2013.
[2] R. SrinivasaRao, K. Ravindra, K. Satish, and S. V. L. Narasimham, "Power loss minimization in distribution system using network reconfiguration in the presence of distributed generation, "IEEE Transaction on Power Systems, vol. 28, no. 1, pp. 317- 325, Feb. 2013. [3] H. Manafi,, N. Ghadimi, M. Ojaroudi2, P. Farhadi "Optimal Placement of Distributed Generations in Radial Distribution Systems Using
Various PSO and DE Algorithms", Elektronika Ir Elektrotechnika, VOL. 19, NO. 10, pp. 53-57, 2013.
[4] G.P.Amisha Vishnu Priya, "Optimal Design of Multi type DG Resources Using Particle Swarm Optimization" IJAREEIE Vol. 3, Issue 4, pp. 8899- 8911, 2014.
[5] Ramakanth Siripuram , " Optimal sizing and location of distributed generation using improved teaching-learning based optimization algorithm", IJATER , Vol. 4, Issue 4, pp. 116-123, 2014
[6] S. Deshmukh, , KS Manhattan, B. Natarajan, and A, Pahwa, "Voltage/VAR Control in Distribution Networks via Reactive Power Injection Through Distributed Generators," IEEE Transactions on Smart Grid, vol. 3, no. 3, pp. 1226 – 1234, Sept. 2012.
[7] Zou,Kai, "Distribution System planning with incorporate with renewable energy resource" Doctor of Philosophy Thesis, University of Wollongong, 2011.
[8] W Sheng, and Ke-Yan Liu, " Optimal Placement and Sizing of Distributed Generation via Improved Non dominated Sorting Genetic Algorithm II", IEEE transaction On Power Delivery, Vol. 30, No. 2, April 2015, pp. 569-577.
[9] Hossein Ghiasi,
"
A non-dominated sorting hybrid algorithm for multi-objective optimization of engineering problems"
, Engineering Optimization, Volume 43, Issue 1, 2011, pp.39-59.[10] LIN Song " NGPM -- A NSGA-II Program in Matlab", College of Astronautics, Northwestern Polytechnical University, China, July 2011. [11] J.A.Michline Rupa , S. Ganesh, " Power Flow Analysis for Radial Distribution System Using Backward/Forward Sweep Method "
International Journal of Electrical, Computer, Energetic, Electronic and Communication Engineering Vol. 8, No.10, pp. 1543-1547, 2014. [12] National Renewable Energy Laboratory, "Cost and performance data for power generation technologies", Black & Veatec
http://bv.com/docs/reports-studies/nrel-cost-report.pdf, February 2012.