IJEDR1603056
International Journal of Engineering Development and Research (www.ijedr.org)352
Seismic Analysis of Foot Over Bridge for Different
Soil Conditions
1Mr. Vipin A. Saluja, 2Mr. S. R. Satone 1PG Student, 2Assistant Professor
Dept. Of Civil Engineering
KDK College of Engineering, Nagpur, India
________________________________________________________________________________________________________
Abstract - Due to fast construction of a large number of foot over bridges, many existing bridges located in seismic zones are deficient to withstand earthquakes. In order fulfil the requirement of this increased traffic in the limited land the length of bridge becomes medium to large. During an earthquake, failure of structure starts at points of weakness. Generally, weakness is due to geometry, mass discontinuity and stiffness of structure. In earlier days, embankment design and construction were not given adequate attention. Embankments were constructed and left for compaction by natural process. Due to loads imposed by heavier axle loads, very high degree of sub-grade support has become necessary in present scenario which requires fast and heavy compaction by suitable compacting equipment. In this project work seismic analysis of foot over bridge for different soil conditions are carried out. This paper highlights the effect of different soil conditions in different earthquake zones with Response Spectrum analysis using Staad-Pro.
Keywords - N-Type Foot Over Bridge Structure, Different Spans of Bridge, Seismic Analysis, Different Soil Conditions.
________________________________________________________________________________________________________
INTRODUCTION -
Soil is one of the most abundant materials available throughout the world. This fact along with the demand for local construction material led to this investigation on the suitability of soil for use as a building material.
Structural analysis is a process to analyze a structural system to predict its responses and behaviors by using physical laws and mathematical equations. The main objective of structural analysis is to determine internal forces, stresses and deformations of structures under various load effects. There has been much progress in foot over bridge design in recent years with increasing use of advanced analytical design methods, use of new materials and new bridge concepts.
Truss Element
A truss element is a two-force member that is subjected to axial loads either tension or compression. The only degree of freedom for a truss (bar) element is axial displacement at each node. The cross sectional dimensions and material properties of each element are usually assumed constant along its length. The element may interconnect in a two-dimensional (2-D) or three-dimensional (3-D) configuration. Truss elements are typically used in analysis of truss structures
Figure 1: Foot Over Bridge.
OBJECTIVES –
IJEDR1603056
International Journal of Engineering Development and Research (www.ijedr.org)353
To analyze foot over bridge by using STAAD PRO software. To check the effects of different soil conditions in different earthquake zones for foot over bridge.
MODELLING –
Fig.- Front View of Foot Over Bridge of 20m Span.
GEOMETRY OF FOOT OVER BRIDGE -
SR NO.
DETAILS DIAMENTIONS
1. Effective Span of Foot Over Bridge 20 m & 30m
2. Height of Bridge Deck From Ground Level 6.6m
3. Panel Length 5m
4. No. of Panels 4 (20m), 6 (30m)
5. Width of Bridge Deck 3m
LOADIND CALCULATIONS –
1) Dead Load Calculation of concrete deck slab – Thickness of concrete deck slab- 200MM
Density of concrete- 25 KN/m3 Dead load of deck slab = 25 * 0.2 * 1
= 5 kN/m2 2) Live load – 4 kN/m2
PHYSICAL PROPERTIES OF STRUCTURAL STEEL -
a) Unit mass of steel, p = 7850 kg/m
b) Modulus of elasticity, E = 2.0 x 10s N/mm2 (MPa) c) Poisson ratio, p = 0.3
d) Modulus of rigidity, G = 0.769 x 10s N/mm2 (MPa) e) Co-efficient of thermal expansion cx = 12 x 10’ / “c
IJEDR1603056
International Journal of Engineering Development and Research (www.ijedr.org)354
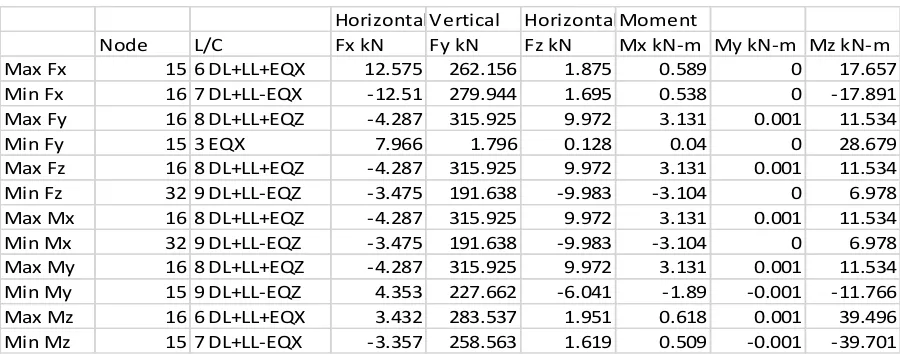
Table Shows Reactions at Nodes in II Earthquake Zone with 1St Soil Condition (i.e. Hard soil) For Foot Over Bridge of 20mSpan.
Table Shows Reactions at Nodes in II Earthquake Zone with 2Nd Soil Condition (i.e. Medium Soil) For Foot Over Bridge of
20m Span.
Table Shows Reactions at Nodes in II Earthquake Zone with 3rd Soil Condition (i.e. Soft Soil) For Foot Over Bridge of 20m
Span.
HorizontalVertical HorizontalMoment
Node L/C Fx kN Fy kN Fz kN Mx kN-m My kN-m Mz kN-m
Max Fx 15 6 DL+LL+EQX 12.575 262.156 1.875 0.589 0 17.657
Min Fx 16 7 DL+LL-EQX -12.51 279.944 1.695 0.538 0 -17.891
Max Fy 16 8 DL+LL+EQZ -4.287 315.925 9.972 3.131 0.001 11.534
Min Fy 15 3 EQX 7.966 1.796 0.128 0.04 0 28.679
Max Fz 16 8 DL+LL+EQZ -4.287 315.925 9.972 3.131 0.001 11.534
Min Fz 32 9 DL+LL-EQZ -3.475 191.638 -9.983 -3.104 0 6.978
Max Mx 16 8 DL+LL+EQZ -4.287 315.925 9.972 3.131 0.001 11.534
Min Mx 32 9 DL+LL-EQZ -3.475 191.638 -9.983 -3.104 0 6.978
Max My 16 8 DL+LL+EQZ -4.287 315.925 9.972 3.131 0.001 11.534
Min My 15 9 DL+LL-EQZ 4.353 227.662 -6.041 -1.89 -0.001 -11.766
Max Mz 16 6 DL+LL+EQX 3.432 283.537 1.951 0.618 0.001 39.496
Min Mz 15 7 DL+LL-EQX -3.357 258.563 1.619 0.509 -0.001 -39.701
HorizontalVertical HorizontalMoment
Node L/C Fx kN Fy kN Fz kN Mx kN-m My kN-m Mz kN-m
Max Fx 15 6 DL+LL+EQX 13.637 262.396 1.892 0.594 0 21.481
Min Fx 16 7 DL+LL-EQX -13.572 279.704 1.678 0.533 0 -21.716
Max Fy 16 8 DL+LL+EQZ -4.253 320.483 11.059 3.471 0.001 11.631
Min Fy 15 3 EQX 9.028 2.036 0.145 0.045 0 32.503
Max Fz 16 8 DL+LL+EQZ -4.253 320.483 11.059 3.471 0.001 11.631
Min Fz 32 9 DL+LL-EQZ -3.508 187.08 -11.069 -3.444 0 6.88
Max Mx 16 8 DL+LL+EQZ -4.253 320.483 11.059 3.471 0.001 11.631
Min Mx 32 9 DL+LL-EQZ -3.508 187.08 -11.069 -3.444 0 6.88
Max My 16 8 DL+LL+EQZ -4.253 320.483 11.059 3.471 0.001 11.631
Min My 15 9 DL+LL-EQZ 4.319 223.303 -7.079 -2.216 -0.001 -11.865
Max Mz 16 6 DL+LL+EQX 4.495 283.777 1.969 0.623 0.001 43.321
Min Mz 15 7 DL+LL-EQX -4.419 258.324 1.601 0.504 -0.001 -43.525
HorizontalVertical HorizontalMoment
IJEDR1603056
International Journal of Engineering Development and Research (www.ijedr.org)355
Table Shows Reactions at Nodes in III Earthquake Zone with 1st Soil Condition (i.e. Hard Soil) For Foot Over Bridge of 20mSpan.
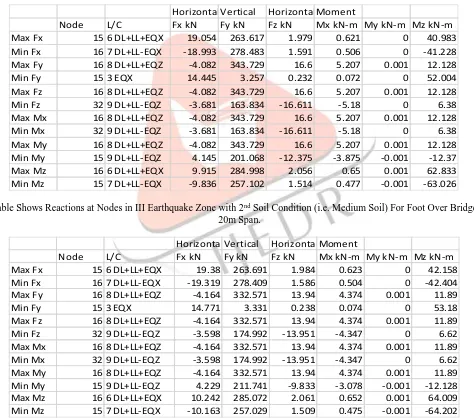
Table Shows Reactions at Nodes in III Earthquake Zone with 2nd Soil Condition (i.e. Medium Soil) For Foot Over Bridge of
20m Span.
Table Shows Reactions at Nodes in III Earthquake Zone with 3rd Soil Condition (i.e. Soft Soil) For Foot Over Bridge of 20m
Span.
HorizontalVertical HorizontalMoment
Node L/C Fx kN Fy kN Fz kN Mx kN-m My kN-m Mz kN-m
Max Fx 15 6 DL+LL+EQX 19.054 263.617 1.979 0.621 0 40.983
Min Fx 16 7 DL+LL-EQX -18.993 278.483 1.591 0.506 0 -41.228
Max Fy 16 8 DL+LL+EQZ -4.082 343.729 16.6 5.207 0.001 12.128
Min Fy 15 3 EQX 14.445 3.257 0.232 0.072 0 52.004
Max Fz 16 8 DL+LL+EQZ -4.082 343.729 16.6 5.207 0.001 12.128
Min Fz 32 9 DL+LL-EQZ -3.681 163.834 -16.611 -5.18 0 6.38
Max Mx 16 8 DL+LL+EQZ -4.082 343.729 16.6 5.207 0.001 12.128
Min Mx 32 9 DL+LL-EQZ -3.681 163.834 -16.611 -5.18 0 6.38
Max My 16 8 DL+LL+EQZ -4.082 343.729 16.6 5.207 0.001 12.128
Min My 15 9 DL+LL-EQZ 4.145 201.068 -12.375 -3.875 -0.001 -12.37
Max Mz 16 6 DL+LL+EQX 9.915 284.998 2.056 0.65 0.001 62.833
Min Mz 15 7 DL+LL-EQX -9.836 257.102 1.514 0.477 -0.001 -63.026
HorizontalVertical HorizontalMoment
Node L/C Fx kN Fy kN Fz kN Mx kN-m My kN-m Mz kN-m
Max Fx 15 6 DL+LL+EQX 19.38 263.691 1.984 0.623 0 42.158
Min Fx 16 7 DL+LL-EQX -19.319 278.409 1.586 0.504 0 -42.404
Max Fy 16 8 DL+LL+EQZ -4.164 332.571 13.94 4.374 0.001 11.89
Min Fy 15 3 EQX 14.771 3.331 0.238 0.074 0 53.18
Max Fz 16 8 DL+LL+EQZ -4.164 332.571 13.94 4.374 0.001 11.89
Min Fz 32 9 DL+LL-EQZ -3.598 174.992 -13.951 -4.347 0 6.62
Max Mx 16 8 DL+LL+EQZ -4.164 332.571 13.94 4.374 0.001 11.89
Min Mx 32 9 DL+LL-EQZ -3.598 174.992 -13.951 -4.347 0 6.62
Max My 16 8 DL+LL+EQZ -4.164 332.571 13.94 4.374 0.001 11.89
Min My 15 9 DL+LL-EQZ 4.229 211.741 -9.833 -3.078 -0.001 -12.128
Max Mz 16 6 DL+LL+EQX 10.242 285.072 2.061 0.652 0.001 64.009
IJEDR1603056
International Journal of Engineering Development and Research (www.ijedr.org)356
METHODOLOGY –
If the structure not properly designed and constructed with required quality, they may cause large destruction of structures due to earthquakes. Response spectrum analysis is a useful technique for seismic analysis of structure when the structure shows linear response.
Extensive literature survey by referring books, technical papers carried out to understand basic concept of topic. Selection of an appropriate model of foot over bridge.
Computation of loads and selection of preliminary cross-sections of various structural members.
Geometrical modeling and structural analysis of foot over bridge for various loading conditions as per IS Codal provisions. Interpretation of results.
In the present work it is proposed to carry out seismic analysis of foot over bridge using Response spectrum analysis method considering different soil condition with the help of STAAD PRO software.
CONCLUSION –
Many of the studies have shown seismic analysis of the foot over bridges with different soil conditions. Whenever a structure having different length, it is necessary to analyse the bridge in various earthquake zones. The reactions and moments at nodes goes on increasing with earthquake zone and with change in soil conditions.
REFERENCES –
1. M. Ciampoli and P.E. Pinto. “Effects of soil-structure interaction on inelastic seismic response of bridge piers”. Journal of structural engineering, 121(5):806–814, 1995.
2. Durkee, Jackson L., “Foot Over Bridge Erected by Launching”, Journal of The
Structural Division, ASCE, Vol. 98, No. ST7, Proc. Paper 9028, Pp. 1443-1463, July,1997 3. Durkee, Jackson, “Steel Bridge Construction”, Bridge Engineering Handbook, Crcpress, PP 45-58, 2000.
4. Granath, P., “Distribution of Support Reaction Against A Steel Girder On A Launching Shoe.” Journal of Constructional Steel Research, Vol. 47, No.3, Pp. 245-270, 1998.
5. G. Mylonakis and G. Gazetas. “Seismic soil-structure interaction: beneficial or detrimental”, Journal of Earthquake Engineering, 4(03):277–301, 2000.
6. M.J.N. Priestley and R. Park. “Strength and ductility of concrete bridge columns under Seismic loading”. ACI Structural Journal, 84(1):61–76, 1987.
7. D. Resendiz and J.M. Roesset. “Soil-structure interaction in Mexico City during the 1985 Earthquake. In Proc. of Int’l. Conf. on The Mexico Earthquakes – 1985”, ASCE, volume Factors Involved and Lessons Learned, pages 193–203, 1987.
8. J.C. Wilson and B.S. Tan. “Bridge abutments: assessing their influence on earthquake response of meloland road overpass.” Journal of Engineering Mechanics, 116(8):1838–1856, 1990.