Modeling Document Dynamics: An Evolutionary Approach
Jahna Otterbacher, Dragomir R. Radev
University of Michigan Ann Arbor, Michigan, USA
{jahna,radev}@umich.edu
Abstract
News articles about the same event published over time have properties that challenge NLP and IR applications. A cluster of such texts typically exhibits instances of paraphrase and contradiction, as sources update the facts surrounding the story, often due to an ongoing investigation. The current hypothesis is that the stories “evolve” over time, beginning with thefirst text published on a given topic. This is tested using a phylogenetic approach as well as one based on language modeling. Thefit of the evolutionary models is evaluated with respect to how well they facilitate the recovery of chronological relationships between the documents. Over all data clusters, the language modeling approach consistently outperforms the phylogenetics model. However, on manually collected clusters in which the documents are published within short time spans of one another, both have a similar performance, and produce statistically significant results on the document chronology recovery evaluation.
1. Introduction
When an important event happens, large numbers of news sources report on it. In doing so, they draw information from direct participants in the event, eyewitnesses, official reports, copy from the newswire, as well as from each other. As anyone who follows an event can attest, often multiple sources present complementary accounts of the news. Each source has its own reputation, biases, and agenda. In addi-tion to source, news accounts of an event vary over time. Often initial reports turn out to be partially or fully incor-rect. It takes a certain amount of time for accounts to stabi-lize and to be accepted as the ground truth.
In considering how information evolves over time and is ex-pressed through text, we have examined sets of documents on the same story published over time by multiple news agencies, and have found that they exhibit a number of in-teresting relationships. For example, a given pair of related documents may express some of the same factual informa-tion and yet each may contain novel informainforma-tion that the other does not. An example with respect to a single fact is illustrated in Figure 1. The sentences shown were extracted from documents describing the crash of a small plane into a skyscraper, and concern the location from where the plane departed.
In short, following information in a news story over time and across sources is a challenging task due to the dynamic nature of such texts. As facts, beliefs and opinions sur-rounding an event change, so do the texts that report on them. In other words, such stories can be viewed as “evolv-ing” over time, beginning with the information reported in thefirst story that makes the news. Currently, we attempt to model these phenomena using a phylogenetic approach. In phylogenetics, the history of a set of species is recon-structed, under the assumption that they evolved from a common ancestor, with genetic mutations occurring at dif-ferent points in time. The “species” we study are related documents describing the same news story.
In addition, we will test a second approach that is inspired by language modeling. We use a language model generated from the earliest document in each set, to chronologically
order the remaining documents. In doing so, we hypothe-size that as time goes on and the story changes, the like-lihood that the original language model could have gen-erated a later document should decrease. In both experi-ments, we evaluate thefit of the evolutionary models with respect to their ability to recover the chronological relation-ships between the documents in a given cluster. Rather than experimenting with a large number of text represen-tation methods within each approach, we have applied the same preprocessing techniques to the texts in the corpus before implementing the models. It is likely that we will be able to improve the performance of both approaches on the chronology recovery task in our future work. However, the goal of the current paper is to evaluate the extent to which multi-document clusters of news articles exhibit evo-lutionary properties as well as to see which approach, phy-logeny or language modeling, is more promising for mod-eling inter-document dynamics.
2. Related work
2.1. A method for phylogenetic analysis
The Fitch-Margoliash method is used in the biological sci-ences for constructing a phylogenetic tree for a set of species, based on sequences of amino acids found in their DNA (Fitch and Margoliash, 1967). First, mutation dis-tances are calculated between each pair of species. This distance is the minimum number of sites that would have to be changed in order for one string to mutate into the other. Initially, each of the N species is assigned to its own subset, such that there are N subsets. They are then joined together, starting with those that have the smallest mutation distance between them, such that the number of subsets is reduced by one at each cycle, until all subsets have been joined to the tree.
Because of the manner in which the initial sets are chosen, various phylogenetic trees will result from the different ini-tial assignments. Therefore, it is necessary to test between alternative trees. For each tree, one sums over the distances between each pair of species, resulting in a new distance matrix that can be compared to the original mutation
04/18/02 13:17 (CNN)
The plane, en route from Locarno in Switzerland, to Rome, Italy, smashed into the Pirelli building’s 26th floor at 5:50 p.m. (1450 GMT) on Thursday.
04/18/02 13:42 (ABCNews)
The plane was destined for Italy’s capital Rome, but there were conflicting reports as to whether it had come from Locarno, Switzerland or Sofia, Bulgaria.
04/18/02 13:42 (CNN)
The plane, en route from Locarno in Switzerland, to Rome, Italy, smashed into the Pirelli building’s 26th floor at 5:50 p.m. (1450 GMT) on Thursday.
04/18/02 13:42 (FoxNews)
The plane had taken off from Locarno, Switzerland, and was heading to Milan’s Linate airport,
De Simone said.
Figure 1: Dynamic information example.
tances. The “percent deviation” of the reconstructed values in the tree from the original input distances are found by summing the squared percent change for each species. For example, if the original mutation distances between pairs of species are in the upper triangle of the distance matrix, while the new distances according to the candidate tree are in the lower triangle, then for each species pair the original distance is(i, j)and the new distance is(j, i).
Percent deviation=
i<j
(|(i, j()−(j, i)|
i, j)
2
)∗100
Seeking the statistically optimal phylogenetic tree from the set of all possible trees involves minimizing the percent de-viation.
2.2. Phylogenetic trees and text analysis
Bennett and colleagues applied phylogenetic inference al-gorithms to reconstruct the evolutionary history of 33 chain letters collected between 1980 and 1995 (Bennett et al., 2003). Because the chain letters circulated before the widespread use of email, they proposed that the letters mu-tated and evolved as generations of receivers photocopied them until no longer legible. At such a point, the next re-cipient would likely retype the letter, introducing new er-rors and variations.
The distance metric between each pair of chain lettersxand yused in constructing the tree was the amount of informa-tion,d(x, y)shared by the pair of letters. Once the distance matrix was computed, the authors used various methods, including Fitch-Margoliash, in constructing phylogenetic trees. The tree was rooted using the letter with the earli-est known date. Using the same distance metric, the vari-ous methods for constructing the tree yielded similar trees. Once the tree was constructed, the authors were able to ex-plain how the chain letters evolved over time. For exam-ple, names of individuals and the dates of different events mentioned in the letter (such as the death of someone who
broke the chain) changed at different points in its evolution. In addition, new “genes” often appeared. The resulting tree was almost a perfect phylogeny, as the authors were able to confirm that letters containing the same characteristics were always grouped together.
2.3. Our approach
The current work is inspired by Bennett’s research but dif-fers in some important ways. In the chain letters, muta-tions occurred over time because of letters being recopied by recipients, who might misspell or misinterpret words in the letter when preparing copies to mail out to the next re-ceivers. Alternatively, details of the letters were occasion-ally changed deliberately. For example, when the letters werefirst brought to the U.S. from Europe, certain names and titles were changed. In our work, we assume that over time, we will observe mutations in news stories because they reflect events and facts in the real world that are con-stantly changing.
There are some other interesting nuances in the current problem. For example, while we assume that the texts we observe express the facts in the world, there is rarely only one way to express the same concept or fact in natural lan-guage. Therefore, we expect to encounter many instances of paraphrases in our data. At the same time, it is known that journalists use newswire sources and may also copy large parts of previously published news stories in creating an update on a given situation (Clough et al., 2002; Mitchell and West, 1996). Therefore, we will also observe many instances of identical expressions, published by different sources and perhaps even at different points in time. In our experiments, we attempt to recover the chronological relationships between related documents using two differ-ent approaches. In thefirst approach, we create an unrooted phylogenetic tree for each document cluster, and then re-root each tree at the document in the cluster that has the earliest publication date. Therefore, S1 (Species 1) is at the base of the tree, and we propose that the remaining
S1: Italian TV says the crash put a hole in the 25th floor of the Pirelli building, and that smoke is pouring from the
opening. (04/18/02 12:22, CNN)
S2: Italian TV showed a hole in the side of the Pirelli building with smoke pouring from the opening. (04/18/02 12:32, CNN)
S3: Italian state television said the crash put a hole in the 25th floor of the Pirelli building. (04/18/02 12:42, MSNBC)
S4: Italian state television said the crash put a hole in the 25th floor of the 30-story building. (04/18/02 12:44, FOX)
Figure 2: Sample document “species” in chronological order.
Algorithm 1TD tree rerooting algorithm. Root tree atS1
depth(S1) = 0
Initialize stackqof next documents to process PushS1ontoq
repeat
Si= next element inq
seen(Si) = 1
Find depth ofSiin tree
depth(Si)=Find depth(Si)
untilstackqis empty FunctionFind depth(Si)
foreach elementaiin treedo
biis element adjacent toaianddistance(ai, bi) =ci
ifai=Siand seen(bi)=0then
Pushbiontoq
depth(bi)=ci+ depth(Si)
Returndepth(bi)
end if
ifbi=Siand seen(ai)=0then
Pushaiontoq
depth(ai)=ci+ depth(Si)
Returndepth(ai)
end if end for
date, time stamp and source in Figure 2.
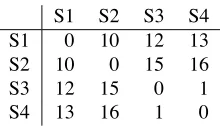
First, the Levenshtein matrix is calculated, yielding the dis-tance matrix for Fitch. The disdis-tance matrix for the above example is shown in Figure 3. Each entry(i, j)in the ma-trix shows the word-level edit distance between document iandj. Note that the Levenshtein matrix is also symmetric with zeros along the diagonal.
S1 S2 S3 S4 S1 0 10 12 13 S2 10 0 15 16 S3 12 15 0 1 S4 13 16 1 0
Figure 3: Levenshtein matrix for 4 input document species.
Once the bestfitting evolutionary tree is found by the
Fitch-Margoliash method, it is then rerooted at the earliest doc-ument in the cluster. The unrooted tree (output of Fitch) for the example is shown in Figure 4. Note that the tree shows both the document species as well as internal nodes, intermediate points at which a mutations occur. The nodes and species are shown with their respective distances from node I1, an arbitrary point. The corresponding rerooted
tree is shown in Figure 5. Here, the distances shown are from the given node or species to S1, the root. To obtain these distances, the tree is traversed from the root out. The system ranking is then determined with respect to the dis-tances, with species closer to the root having higher ranks. The ranks correspond to the chronological ordering of the document species. To evaluate, the system rankings are compared to the actual chronological ordering of the docu-ments. Figure 6 illustrates this process.
5. Language modeling experiments
As previously mentioned, for each document cluster, a lan-guage model was built from the earliest document in the set. More specifically, a simple trigram backoff language model with Good Turing discounting was created and eval-uated against every other document in the cluster using the CMU-Cambridge toolkit (Clarkson and Rosenfeld, 1997). Since thefirst document in a cluster typically had a much smaller vocabulary than latter documents, we used the out-of-vocabulary (OOV) rates as well as the backoff event in-formation rather than model perplexity in order to assess thefit with respect to each document in the cluster. We hy-pothesized that for documents published later on, the OOV rate should be greater. Likewise, we expect to see more backoff events, such that the trigram-hit ratios should be smaller, and unigram-hit ratios larger, as compared to ear-lier documents. There were three experiments per clus-ter: one in which documents were ordered by OOV, by unigram-hit ratio and by trigram-hit ratio (ranked in reverse order). We then compared the system orderings to the true orderings in the same manner as in the phylogenetic exper-iments.
6. Experimental results
6.1. Evaluation method
For each cluster and system ordering, the Kendall rank-order correlation coefficient was calculated (Siegel and
Document species Distance from root System rank Actual rank
S1 0 1 1
S2 10 2 2
S3 12 3 3
S4 13 4 4
Figure 6: Chronological ordering of the input documents.
Med.τ # Sig. Full doc 0.16 8/15
Summ-1 0.13 6
Summ-2 0.12 5
Summ-3 0.13 6
Summ-4 0.16 6
Summ-5 0.17 6
Summ-6 0.09 6
Summ-8 0.12 6
3gram 0.17 7
1gram 0.21 11
OOV 0.28 13
Table 2: Medianτ and the number of data clusters with a significant result.
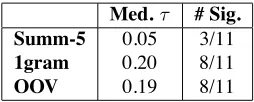
Med.τ # Sig. Summ-5 0.05 3/11 1gram 0.20 8/11
OOV 0.19 8/11
Table 3: Medianτand the number of clusters with a signif-icant result for the 11 Novelty training clusters.
shown in Table 2. Over all clusters, the language modeling OOV approach performed the best, having a medianτ of 0.28. In addition, for 13 of 15 training clusters, the results were statistically significant.
The best run for the phylogenetic approach was the one which calculated the edit distance between each document species based on the 5-sentence summary of each docu-ment. Tables 3 and 4 show the comparison of this ap-proach against the two best language modeling apap-proaches (1gram and OOV) on the 11 Novelty data clusters and the 3 manually-created clusters, respectively. As mentioned in Section 3., the manual clusters differ from the Novelty clus-ters not only in that all discuss emergency news topics (that are likely to report changes rapidly over time) but also in that the publication times of the documents are relatively closer together. Here we can see that on the manual clus-ters, all three methods yield statistically significant results on all three manual clusters. However, for the Novelty clus-ters, 1gram and OOV perform much better than the phylo-genetic technique.
6.3. Development/test phase
In the development/test phase, we evaluated the top two language modeling approaches (1gram and OOV) as well as the best two phylogenetic techniques (Summ-4 and Summ-5) in order to distinguish them further in terms of performance. Table 5 shows theτfor each of the six
devel-Med.τ # Sig. Summ-5 0.32 3/3
1gram 0.42 3/3
OOV 0.26 3/3
Table 4: Medianτand the number of clusters with a signif-icant result for the 3 manual training clusters.
Med.τ # Sig. Summ-5 0.15 5/15 1gram 0.14 6/15
OOV 0.22 9/15
Table 6: Medianτand the number of clusters with a signif-icant result for 15 test clusters.
opment/test clusters as well as the median over all clusters and the number of significant orderings. In this set, only one cluster, which describes the Columbia shuttle disaster, is a manually-created cluster and as expected, all four tech-niques achieve a statistically significant result on ordering the 41 documents in the cluster. However, we again observe some poor performances on the Novelty clusters. In partic-ular, Summ-4 achieves aτof only 0.04 on clusters N53 and N81. Given its lower medianτas well as having a signifi-cant performance on only half of the clusters, we eliminate Summ-4 and evaluate the remaining three techniques on the unseen test data set.
6.4. Test phase
The performance of the three remaining techniques is shown in Table 6. The technique that orders documents with respect to their OOV rate when evaluated against the language model created by the earliest document in the set outperformed the other two methods. In particu-lar, the OOV technique achieved a statistically significant Kendall’sτon 9 of the 15 unseen test clusters.
7.
Conclusions
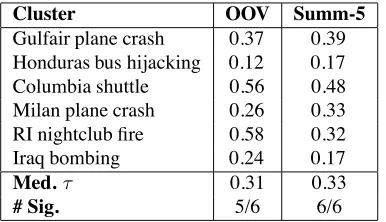
While over all data clusters, the OOV technique outper-formed all others, we have also seen that in general, we achieved better results on the manually-collected document sets as compared to the Novelty clusters. Table 7 shows the performance of the OOV (language model) and Summ-5 (phylogenetic) techniques the six manual clusters over all data sets. To contrast, over all 27 Novelty clusters in our corpus, the medianτfor the OOV and Summ-5 techniques was 0.22 and 0.17, respectively. Therefore, one conclusion from our experiments is that the evolutionary models that we have proposed and implemented fit the manual clus-ters rather well. As previously mentioned, these clusclus-ters were collected over shorter periods of time from Web-based
Cluster OOV 1gram Summ-4 Summ-5 Columbia shuttle 0.56 0.52 0.46 0.48 Bali bombing 0.20 0.24 0.51 0.29 N7 - Olympics bombing 0.32 0.27 0.15 0.24 N49 - Nobel prize 0 0.29 0.25 0.31 N53 - Death of J. Byrd 0.21 0.27 0.04 0.20 N81 - Matthew Shepard 0.35 0.23 0.04 0.19
Med.τ 0.26 0.27 0.20 0.26
# Sig. 4/6 5/6 3/6 5/6
Table 5: Individual clusterτ, and medianτand significance for all 6 dev/test clusters.
Cluster OOV Summ-5
Gulfair plane crash 0.37 0.39 Honduras bus hijacking 0.12 0.17 Columbia shuttle 0.56 0.48 Milan plane crash 0.26 0.33 RI nightclubfire 0.58 0.32 Iraq bombing 0.24 0.17
Med.τ 0.31 0.33
# Sig. 5/6 6/6
Table 7: Performance over all 6 manually-created clusters.
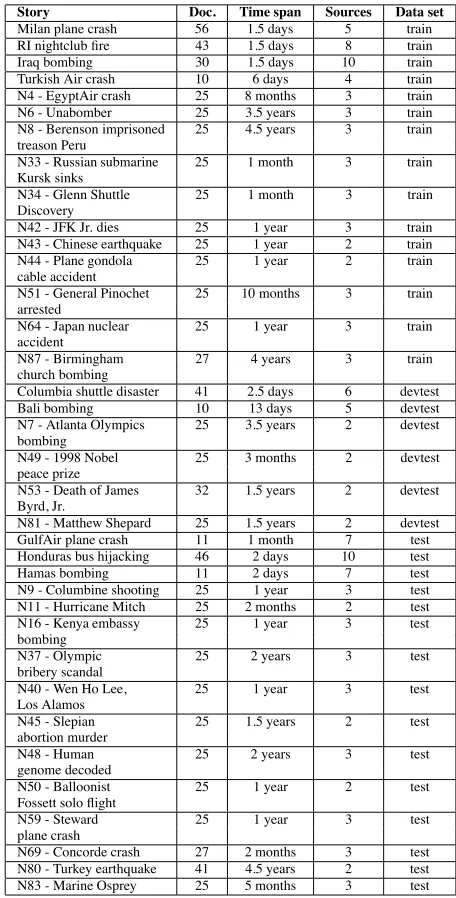
news sources. In addition, we tried to collect as many docu-ments as possible that were published over time describing the given subject, which was an emergency situation. To contrast, the Novelty cluster topics are more varied and as can be seen in Table 1, the publication time spans are typically larger (e.g. over months or years) rather than over days, as in our manual clusters. It is obvious that our evo-lutionary models in general, do notfit these types of doc-ument clusters as well. In fact, the poorest performances observed in the test data are on Novelty clusters. For exam-ple, for the cluster N80 about the Turkey earthquake, which contains 41 documents published over a period of 4.1 years, none of the techniques achieves a statistically significant re-sult. Therefore, we conclude that the evolutionary models are most useful for predicting relationships between docu-ments describing related, breaking news stories and that are published over shorter time intervals.
7.1. Future work
Having shown that clusters of breaking news stories pub-lished over time and by different sources have evolutionary properties that can be modeled, we plan to improve and ex-tend our methods for chronology recovery between texts. In particular, we plan to adapt our current techniques to the problem of following changing information in clusters of “evolving” texts, such as the emergency news stories cur-rently studied. Given a set of documents of interest, the goal will be to chronologically order the individual facts they express (rather than the documents themselves). Even-tually, we hope to implement this work into a Web-based system that will help users monitor changing news events at the factual level.
8. Acknowledgements
This work was supported in part by NSF Grants IIS 0534323 and BCS 0527513. Any opinions, findings, and conclusions or recommendations expressed in this paper are those of the authors and do not necessarily reflect the views of the National Science Foundation.
9.
References
Charles H. Bennett, Ming Li, and Bin Ma. 2003. Chain Letters and Evolutionary Histories. Scientific American, pages 76–81, June.
P.R. Clarkson and R. Rosenfeld. 1997. Statistical Lan-guage Modeling Using the CMU-Cambridge Toolkit. In ESCA Eurospeech.
Paul Clough, Robert Gaizauskas, Scott S.L. Piao, and Yorick Wilks. 2002. Measuring text reuse. In Proceed-ings of the 40th Annual Meeting of the Association for Computational Linguistics (ACL), pages 152–159. Joseph Felsenstein. 1995. PHYLIP: Phylogeny Inference
Package. Technical report, Department of Genome Sci-ences, University of Washington.
Walter M. Fitch and Emanuel Margoliash. 1967. Construc-tion of Phylogenetic Trees. Science, 155(3760):279– 284, January.
Oren Kurland and Lillian Lee. 2004. Corpus Structure, Language Models, and Ad Hoc Information Retrieval.
InSIGIR 2004.
Catherine C. Mitchell and Mark D. West. 1996. The News Formula: A Concise Guide to News Writing and Report-ing. St. Martin’s Press, New York.
Jay M. Ponte and W. Bruce Croft. 1998. A Language Mod-eling Approach to Information Retrieval. InSIGIR 1998. Dragomir R. Radev, Hongyan Jing, Malgorzata Sty´s, and Daniel Tam. 2004. Centroid-based summarization of multiple documents. Information Processing and Man-agement, 40:919–938, December.
Sidney Siegel and N. John Castellan. 1988.Nonparametric Statistics for the Behavioral Sciences. McGraw Hill. Ian Soboroff and Donna Harman. 2003. Overview of
the TREC 2003 Novelty Track. In Proceedings of the Twelfth Text Retrieval Conference (TREC 2003), NIST, Gaithersburg, ML.