International Journal of Scientific Research in Computer Science, Engineering and Information Technology © 2018 IJSRCSEIT | Volume 3 | Issue 1 | ISSN : 2456-3307
Case Study on Static k-Means Clustering Algorithm
Dr. Chatti Subba Lakshmi
Department of CSE, Guru Nanak Institutions, Hyderabad, India
ABSTRACT
Data clustering is frequent research problem in many data mining applications. In this view, many clustering methods proposed in literature. One type of clustering is partitioning method which is centroid based technique. In this paper we are presenting the case study on conventional or static k-means partition clustering algorithm. Here we used static means the basic input parameter given to k-means is number of cluster (k), which constant for complete execution of data set. We need to decide the k values before algorithm starts and It does not changes, when there is a change in data set. We considered the some cases like distance measures, what is right number of clusters and relations between the algorithm parameters. We executed k-means algorithm on small data set and large data set and we presented the detailed steps for each case by showing the results
Keywords : Data Clustering, Partitioning Clustering, K-Means Clustering Algorithm, Static
I.
INTRODUCTION
For given data objects for analysis, we can perform unsupervised method called clustering [1]. Clustering is a process of grouping the data into partition. Each partition is known as clusters [2]. The data objects are grouped based on the characteristics or features. The data objects with same properties or similar to each other is grouped in to one [3]. The basic criteria in clustering are, the similarity between the clusters have minimum and similarity within the clusters have high. To find the similarity or dissimilarity, in literature there many methods present. In general, distance measures are used to calculate the similarity in data objects. Clustering is used many potential applications, it become a challenging field in research. Based on requirements of applications, many categories of clustering algorithms [4] are exits in literature. The traditional clustering algorithms are Partition clustering, Hierarchical methods, Density-based algorithms etc.
In clustering problem, we need to input the some parameters like number of clusters labeled as k, cluster size, constraints, etc. The frequent problem of clustering is determining the number of clusters in a given data set. In one of type of clustering algorithms, in particular partition clustering algorithms and EM algorithms, the input parameter given to algorithm is k that specifies the number of clusters. We need prior knowledge on number of clusters. The correct value of k is uncertain, with interpretations depending on the shape and scale of the distribution of points in a data set and the desired clustering resolutions of the user. If appropriate value of k is not known from the prior knowledge of the properties of the data set, it must be chosen somehow. For finding the number of clusters, several methods exits in literature.
relationships on cluster parameter by executing and analyzing the static k-means algorithm. The static means, the main input value given to k-means is k (cluster number) value is constant or no change in entire cluster process. But if there is change in data set, it does not change. Hence, we called the static k-means algorithm. In this view, our objective is to discuss the below cases on static k-means algorithm in following sections:
The static k-means clustering algorithm
Distance measures in k-means algorithm
Results analysis of k-means algorithm
Finding the right number of clusters
The Static K-Means Clustering Algorithm
The k-means algorithm is centroid based algorithm, clusters represented with central vector, which may not be a member of data set. When the number of clusters fixed to k, k-mean clustering gives a formal optimization problems: find the k cluster centers and assign the objects to nearest cluster center, such that the square distance from the clusters are minimized. The optimization problem is NP-hard, which is common approach is search for approximate solutions. The well known approximate solution is Lloyd’s algorithm [5], actually referred as k-mean clustering algorithm. Given data set D of n objects and k number of clusters to form, a partitioning algorithm organizes the objects into k partitions. The actual To form the clusters, it uses the objective partitioning criterion defined as dissimilarity function based on distance. Consider two data objects x and y and the dissimilarity function is d(x, y), which the distance between x and y. The aim of algorithm is organize the clusters such that the value of d is minimum within the clusters and its is high between the clusters. The most commonly used partitioning methods are k-means and k-medoids. Here we are presenting the k-means clustering algorithm.
The k-means clustering algorithm is a centroid-based technique and it takes input parameters a set of n objects and k number of clusters. It clusters n objects into k number of partitions, so that resulting intra-cluster similarity is high but the inter-intra-cluster similarity is low. In this algorithm cluster similarity is measured in mean value of the objects in a cluster and which can be represented as centroid of cluster. The k- means clustering algorithm takes data set D and number of clusters k as inputs to the algorithm. Its picks k number of data objects from data set D randomly and assign as initial cluster centers or mean. For each remaining n-1 objects, it calculates the distance between the object and mean of each cluster center. It assigns the data object which is near to cluster mean by comparing their distances. The result of this step is, all data objects are grouped into initial clusters. And then calculate the cluster means, which represents new cluster means. This process is repeated until there is no change in the cluster points. We given this algorithms steps in the table 1.
Table 1 : the k-means partitioning algorithm
Algorithm: k-means. The k-means algorithm for partitioning, where each cluster’s center is represented by the mean value of the objects in the cluster.
Input:
k : the number of clusters D: data set containing n objects. Output: A set of k clusters.
Process:
Step1. Randomly choose k objects from D as initial cluster centers
Step 2: repeat
Step 3: (re)assign each object to the cluster to which the objects is the most similar, based on the mean value of the objects in the cluster;
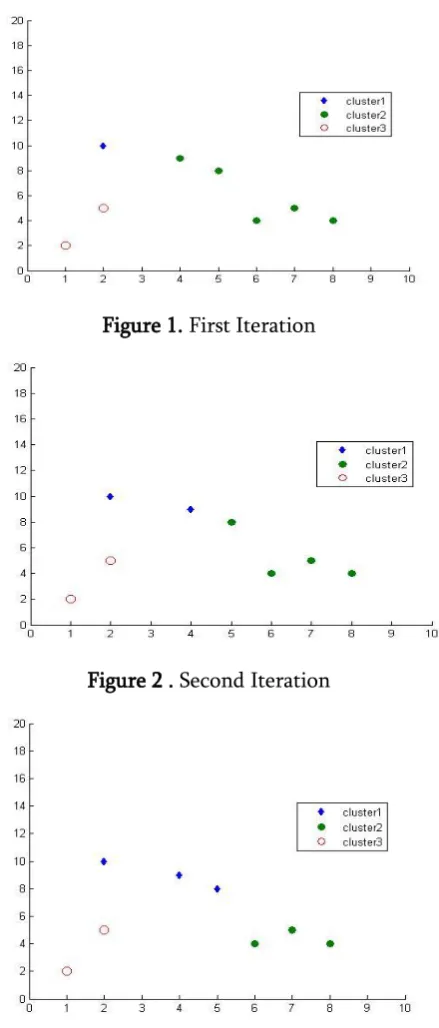
Example: to show the execution of k-means algorithm, we took the small two-dimensional data set with eight points. The data set D = { (2,10), (2,5), (8,4), (5,8), (7,5), (6,4), (1,2), (4,9) } and the number of clusters k =3. It takes 4 iterations to cluster these points. We have shown these iterations in graphs starting figure 1 to fig.4. We can identify the changes in the cluster points.
Figure 1. First Iteration
Figure 2 . Second Iteration
Figure 3. Third Iteration
Figure 4. Fourth Iteration
Distance Measures In K-Means Clustering Algorithm
In data clustering, group the points into some number of clusters, so that members of clusters are in some sense as close to other as possible. Each clustering algorithm based on some kind of distance between points. There two major classes of distance measure, one is Euclidean distance measure and other one is non-Euclidean distance measure. A Euclidean space has some number of real-valued dimensions and dense points. A Euclidean distance is based on locations of points in such a space. It uses the notation of average of two points. A non-Euclidean distance is based on properties of points, but not their location in space. The basic k-means clustering algorithm uses Euclidean distance measures to find the similarity between the data objects.
Basically Euclidian distance can be represented in two norms. L2 norm: d(x,y) = square root of the sum of the squares of the difference between x and y in each dimension as in equ. (2). This is notation is common
l used. The k-means algorithm uses L2 norm. Other norm is L1 norm: sum uat the difference in each dimension. This norm is called Manhattan distance. This norm is used when you had to travel along the coordinates only.
L2 norm: d(x, y) = √(x1-y1)2 + (x2-y2)2 + ....+(xn-yn)2 (2)
Where (x1, x2 , ... xn) and (y1, y2, ...,yn) are data points with n dimensions. D(x,y) represents the distance between the x and y data points.
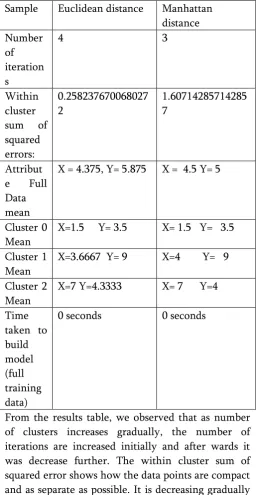
In this paper we are presenting the both norms of Euclidean distance on k-means algorithm. To show difference between two norms, we took 8 two-dimension points and executed on k-means algorithm in Weka data mining tool. The comparison between the Euclidean and Manhattan distance is given in the table. II.
TABLE II. DIFFERENCE BETWEEN EUCLIDIAN AND
MANHATTAN DISTANCE EXECUTION ON K-MEANS
CLUSTERING ALGORITHM
Result analysis on k-means clustering algorithm
We executed the static k-means clustering algorithm on sample data set and large data set with 1000 records German credit risk assessment data set in Weka data mining tool. From the result of k-means algorithm, we analyzed and identify the some relationships between the parameters of algorithm. The parameters which we are identified are number of clusters, number of iterations, time taken to cluster the points, sum of square errors and others. All these parameters are depends on the number of clusters and which is static in the sense we need to decide the number of clusters before execution of algorithm. This value is same for all iterations.
Experirment 1: we executed static k-means algorithm for data set D= D = { (2,10), (2,5), (8,4), (5,8), (7,5), (6,4), (1,2), (4,9) } on different number of clusters starting with k=2 to 8 and results are present in table.
From the results table, we observed that as number of clusters increases gradually, the number of iterations are increased initially and after wards it was decrease further. The within cluster sum of squared error shows how the data points are compact and as separate as possible. It is decreasing gradually as we are increasing the number of cluster. At last iteration it becomes zero due to each point becomes individual clusters and mean is equal to data point.
TABLE FOR STATIC K-MEANS ALGORITHM RESUSTS WITH DIFF K VALUES Sample Euclidean distance Manhattan
distance
Experiment 2: We worked on static k-means algorithm on German credit risk data set consists of 1000 records. Each record consist details of customers who applied for loan. We took the numerical attributes from the data set are duration, credit_amout, instalment_commited, residence_since, age, exiting_credits, num_dependencies, to show the execution of k-means algorithm. Since conventional k-k-means algorithms works on numerical data. The algorithm
is executed by drdially increasing number of clusters i.e. k value in Weka software and results are given the table. The k-means algorithm takes number of clusters as input parameter which is static does not change and decided before.
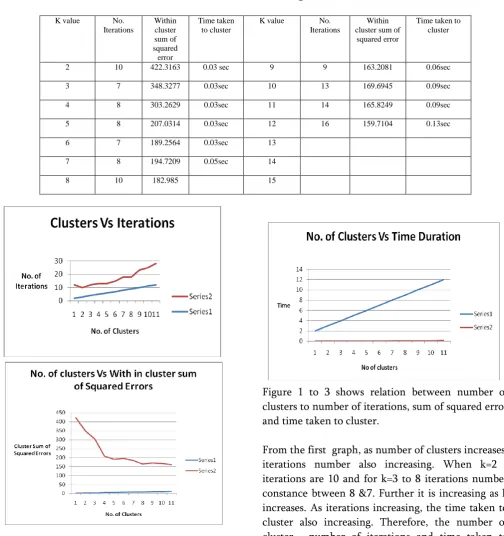
The table gives the for each k value number of iterations, time taken for clustering and within-group squared error. The same shown on graphs fig.1
Table 3. Results of static k-means clustering with different k values
Figure 1 to 3 shows relation between number of clusters to number of iterations, sum of squared error and time taken to cluster.
From the first graph, as number of clusters increases, iterations number also increasing. When k=2 , iterations are 10 and for k=3 to 8 iterations number constance btween 8 &7. Further it is increasing as k increases. As iterations increasing, the time taken to cluster also increasing. Therefore, the number of cluster , number of iterations and time taken to cluster are preprotional to each other. By analysing K value No.
Iterations
Within cluster sum of squared error
Time taken to cluster
K value No. Iterations
Within cluster sum of
squared error
Time taken to cluster
2 10 422.3163 0.03 sec 9 9 163.2081 0.06sec
3 7 348.3277 0.03sec 10 13 169.6945 0.09sec
4 8 303.2629 0.03sec 11 14 165.8249 0.09sec
5 8 207.0314 0.03sec 12 16 159.7104 0.13sec
6 7 189.2564 0.03sec 13
7 8 194.7209 0.05sec 14
these values, one can Select k (cluster number ). The complexity of static or conventional k-means algorithm is O(ntk), where k is number of clusters, n is size of data set and t is number of iterations.
Finding The Right Number of Clusters In K-Means Clustering Algorithm
Determining the number of clusters in a given data set is frequent problem in data clustering. The right number of clusters is uncertain and depends on the type application data sets. As an example, if we take market analysis they prefer 6-8 numbers of clusters. In survey, many methods are given to find the number of clusters. Here, we are presenting some of the methods.
A. Rule of thumb
Rule of thumb[] is a primary with broad applications. it is easy to use for approximately calculating or making some determination. It may not give strictly accurate or reliable for every
]\plication. Rule of thumb can be used to determine the number of clusters as in equ.1.
K ≈ √ n / 2 (1) Where k is number of clusters and n is number of data objects in data set D.
Example: consider n=100 then k= √ 100 /2 = √50 = 7.071068 i.e. we can select k= 7.
B. The Elbow Method
The Elbow method introduced by [].In this method, it follows the elbow criterion to choose the right number of clusters. The elbow mean, when we draw a graph the line will bend at one point making an angle. To decide the number of clusters, plot percentage of variance by clusters against number clusters k. The percentage of variance is ratio of between-group variance to within-group variance. Identify the elbow point where the line bend or making angle in graph and it is the right number of clusters.
PERCENTAGE OF VARIANCE
Variance:
In probability or statistics variance is measure to find the how far a set of points spread out. This measure is suitable for our clustering problem due to its properties. The zero variance indicates that all the values are identical. Always variance is non-negative and a small variance indicates that the data tend to be very close to the mean. The high variance indicates that the data are very spread out around the mean and from each other. In general, the variance of the a finite group of size N with values xi is given as,
Where µ is group mean.
The percentage of variance is also known as F-test[]. The formula for percentage of variance is,
F= explained variance/unexplained variance or F= between-group variance/within group variance The between-group variance is,
Where denotes sample mean in the ith group, ni is the number of observations in the ith group.
denotes the overall mean of the data, and k denotes the number of groups.
The within-group variance is,
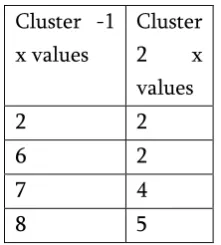
We experiment this method on simple data set with 8 data points as given example of k-means algorithm. We are presenting the complete steps to find the cluster points using k-means clustering algorithm as given table.1, we got the cluster point as,
Table 4. out put of k-means clustering algorithm with k=2
To find the right number of clusters, we took the x observations from the clusters as,
Step1: calculate the mean for each group :
Mean of cluster-1 Mx1= 1/n ∑xi = ¼ (2+6+7+8) = 5.75 Mean of cluster-2 Mx2 = 1/n ∑xi = ¼ (2+2+4+5) = 3.25 Step 2: calculate the overall mean :
Mx = ∑I Mxi / a = Mx1 + Mx2 / a = 5.75 + 3.25 / 2 = 4.5 where a is number of groups or clusters.
Step 3: calculate between-group sum of squares: SB = n (Mx1 - Mx ) 2 + n (Mx2 - Mx )2 = 4 (5.75 – 4.5 ) 2 + 4(3.5 – 4.5 ) 2 = 6.25 + 6.25 = 12.5
The between-group freedom is one less than the
number of groups, fb = a-1 = 2-1 = 1
So, the between-group mean square error is, MSB = SB / fb = 12.5/1=12.5
Step 4: calculate within-group sum of squares. Being by centering the data in each group.
The sum of square of both clusters =SW = 37.5
Within-group degree of freedom is , fw = a ( n – 1) = 2 ( 8 – 1) = 2*7 = 14 , where a is number of groups or clusters and n is number of observations or data points. Thus within-group mean square value is, MSW = SW / fw = 37.5 /14 = 2.678571
Step 5: the percentage variance is,
F = MSB / MSW = 12.5 / 2.678571 = 4.666667
We executed k-means algorithm in Weka data mining tool for k= 2 to 8 and we are presenting the x-values for all clusters in table. For the reaming k values, k=3,4,5,6,7 and 8 following the same steps as mentioned above , we calculated the percentage of variance is given in table.
Table 5. The X- Values For Different K Values After Execution of K- Means Algorithm
Cluster -1
Table
6.
Percentage of variance for k= 3Figure 4. shows the percentage of variance vs number of clusters
From the graph, we can identify the elbow point at cluster number 3 where curve is made an angle and further percentage of variance is increased as k increases. Hence, the right cluster number is k=3 in elbow method. But in this method, we have to performe once clustering for all k vaules to decide k.
II.
CONCLUSIONS
We considered clustering problems as case study and those are discussed on conventional k-means partition clustering algorithm. We presented the basic k-means algorithm, followed to find similarity between data objects distance measures are used, those are described. In next section, we presented result analysis of k-means clustering algorithm on small and large data sets. Finally we presented elbow method to decide the right number of clusters by executing the complete calculations and experiment results. We basically focus on main problems in k-means algorithm, which supports only static data sets.
We called conventional algorithm as static k-means, where k is static. In future we can enhance these cases for better performance and give enhance algorithm to support dynamic (changes over time) data set.
III.
REFERENCES
[1]. Bailey, Ken (1994). "Numerical Taxonomy and Cluster Analysis". Typologies and Taxonomies. p. 34. ISBN 9780803952591.
[2]. Tryon, Robert C. (1939). Cluster Analysis: Correlation Profile and Orthometric (factor) Analysis for the Isolation of Unities in Mind and Personality. Edwards Brothers.
[3]. Cattell, R. B. (1943). "The description of personality: Basic traits resolved into clusters". Journal of Abnormal and Social Psychology 38: 476-506.
[4]. Estivill-Castro, Vladimir (20 June 2002). "Why so many clustering algorithms — A Position Paper". ACM SIGKDD Explorations Newsletter 4 (1): 65-75.doi:10.1145/568574.568575
[5]. Lloyd, S. (1982). "Least squares quantization in PCM". IEEE Transactions on Information
Theory 28 (2): 129-137.
doi:10.1109/TIT.1982.1056489M. Young, The Technical Writer's Handbook. Mill Valley, CA: University Science, 1989.
[6]. Elena Deza & Michel Marie Deza (2009) Encyclopedia of Distances, page 94, Springer. [7]. Eugene F. Krause (1987). Taxicab Geometry.
Dover. ISBN 0-486-25202-7
[8]. Yuli Zhang,Huaiyu Wu,Lei Cheng (June 2012). "Some new deformation formulas about variance and covariance". Proceedings of 4th International Conference on Modelling, Identification and Control(ICMIC2012). pp. 987-992.
[9]. Goodman, Leo A., "The variance of the product of K random variables," Journal of the American Statistical Association, March 1962, 54ff.
K value
SB fb MSB SW fw MSW Percentage
of variance
2 12.5000 1 12.5000 37.50 14 2.6785 4.66666
3 39.5232 2 19.7616 06.90 21 0.3285 60.1570
4 46.0000 3 15.3333 03.00 28 0.1071 143.111
5 44.5000 4 11.2500 01.25 35 0.0357 311.530
6 35.4444 5 7.08888 01.00 42 0.0238 297.733
7 45.3775 6 7.56292 00.50 49 0.0102 747.294