DOI : https://doi.org/10.32628/CSEIT19525
A Deep Convolutional Neural Network Based Lung Disorder Diagnosis
J. Juditha Mercina, J. Madhumathi, V. Priyanga, M. Deva PriyaDepartment of Computer Science and Engineering, Sri Krishna College of Technology, Coimbatore, Tamil Nadu, India
ABSTRACT
Lungs play an important role in human respiratory system. There are diseases that affect the functioning of lungs. To analyse lung diseases in the chest region using X-ray based Computer-Aided Diagnosis (CAD) system, it is necessary to determine the lung regions subject to analysis. In this paper, an intelligent system is proposed for lung disease detection. In this paper, Interstitial Lung Disease (ILD) patterns are classified using Convolutional Neural Networks (CNN). The proposed system involves five convolutional layers and three dense layers. The performance of the classification demonstrates the potential of CNN in analysing lung patterns.
Keywords : Convolution Neural Networks, X-Ray, Lung Diseases, Keras, Softmax Accuracy, Confidence, Confusion Matrix, Training, Testing
I. INTRODUCTION
There are various lung diseases which include Lung Cancer, Interstitial Lung Disease (ILD), Chronic Obstructive Pulmonary Diseases (COPD), Asthma, Influenza, Fibrosis, and Emphysema. ILD is a complex group of disorders.
The diagnosis and treatment of each disease at initial stage is crucial for proper functioning of human body [1]. According to the latest WHO data published in the year 2017, Lung disease deaths in India have reached 896,779 or 10.19% of total deaths.
The age adjusted death rate of 96.92 per 100,000 of population ranks India #4 in the World. Recent years have witnessed a great technological progress in designing Computed Tomography (CT) equipments, which acquires 3-Dimensional (3D) CT images containing very fine details. The number of CT images that must be examined by physicians
increases as the imaging resolution increases, placing an increasing burden on physicians.
Convolutional Neural Networks (CNNs) are very similar to normal Neural Networks (NNs). They are made up of neurons with their weights and biases. Each neuron receives inputs, performs a dot product followed by non-linearity. The whole NN still expresses a single differentiable score function, ranging from the raw image on one end to class scores at the other. The loss function (SVM/ Softmax) is included in the last layer.
CNN architectures make the assumption that the inputs are images, which allows encoding certain properties into the architecture. The efficiency of the forward function is improved and the amount of parameters in the network is reduced [2].
II. RELATED WORKS
Hou et al (2011) [3] have discussed about the current uses of Optical Coherence Tomography (OCT), its potential applications as it relates to specific pulmonary diseases, and the future directions for OCT.
Budd (2012) [4] has introduced dysregulation of the Transforming Growth Factor β (TGFβ) pathway that is implicated to underlie a number of disease indications including chronic lung disorders such as asthma, COPD, Interstitial Pneumonia and Pulmonary Arterial Hypertension.
Jaeger et al (2012) [5] have proposed an automated system that screens chest X-rays for manifestations of Tuberculosis (TB) and other lung diseases. For a given input chest X-ray, the lung field is segmented using a combination of an intensity mask, a statistical lung model mask and a Log Gabor mask.
Hadavi et al (2014) [6] have designed an algorithm using Cellular Learning Automata (CLA). Each cell chooses an action from its possible action vector, after which, based on the selected actions, a pattern sends response signal to the lattice.
Noor et al (2014) [7] have proposed a novel texture-based statistical discrimination procedure using chest radiograph to detect PNEUmonia (PNEU), Pulmonary Tuberculosis (PTB) and Liquid Chromatography (LC). The statistical discrimination procedure uses Wavelet Texture Measure (WTM) and the modified Principal Component (modPC) method.
Karasawa et al (2015) [8] have used anatomical structures and pulmonary textures for determining the lung regions in the chest region CT imaging. To evaluate the method’s performance, experiments are conducted using healthy and diseased cases to
calculate the percentage contents and concordance rates, and to estimate the processing time. The experiments yielded the same level of outcome for diseased and healthy cases. Improvement of selection accuracy and reduction of processing time remain to be addressed.
Poreva et al (2017) [9] have dealt with different types of classifiers for the detection of lung diseases. The classifier based on K-Nearest Neighbors (KNN) method, decision trees, Support Vector Machine (SVM), Naive Bayes Classifier (NBC) and Logistic Regression Classifier (LRC) are studied. Algorithms implementing the classifiers for breathing sounds dataset have also been developed. The SVM and the decision tree classifiers turn out as optimal.
Alam & Hossan (2018) [10] have proposed an algorithm which can predict lung cancer and gives extremely encouraging outcomes in contrast to other techniques. A set of textural features extracted from the separated Region of Interests (ROIs) is classified using SVM. The algorithm identifies whether the input image contains tumor cell or not and anticipates whether there is any likelihood of growth. Patel & Nayak (2018) [11] have propounded an algorithm that is better than the existing algorithms as the efficiency of decision making process improves. In addition, the features extracted are evaluated for classification. Regardless of giving a decent yield, this algorithm in future can be enhanced to get precise outcomes.
III. BENIGN-MALIGNANT CLASSIFICATION
The benign-malignant classification consists of a Multi-View Knowledge-Based Collaborative (MV-KBC) deep model to separate malignant from benign nodules using limited chest CT data [13]. The MV-KBC algorithm includes 4 major steps:
• Extracting 2D nodule slices from nine views of planes
• Extracting the Overall Appearance, Heterogeneity in Voxel Values (HVV) and Heterogeneity in Shapes (HS) patches on 2D nodule slices
• Constructing nine Knowledge Based Collaborative (KBC) sub-models
• Training them using patches extracted from each view of planes
The MV-KBC model consists of nine KBC sub-models. The two-neuron output layer of each KBC sub-model is connected to the same one-neuron classification layer followed by the sigmoid function.
The output of this classification layer is the prediction made by the MV-KBC model. The results show that the MV-KBC model achieved an accuracy of 91.60% for lung nodule classification with an Accuracy of 95.70%. The results show that the model is more accurate than current state of-the-art approaches on the Lung Image Database Consortium image collection (LIDC-IDRI) dataset [14].
IV.METHODS
This section gives a brief description about the methodologies used in the proposed system.
4.1 Convolutional Neural Networks (CNNs)
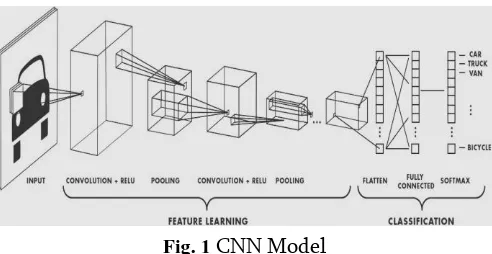
Convolutional Neural Networks (CNNs) are designed to identify the patterns from pixel images. It is done
by incorporating feature extraction and classification from the four convolutional layers. The four layers include Convolutional, Activation, Pooling and Fully-connected (dense) layers. The neurons in each layer are connected to small inputs which resemble receptive fields in the human visual system. To obtain a better representation of the image, neurons respond to different local areas of the input which overlap with each other [15].
The neurons of a convolutional layer are grouped into feature maps which share the same weights, so that the overall procedure becomes equivalent to convolution. Weight sharing among neurons reduces the number of parameters of the network, increases the efficiency and prevents overriding. To capture more complex properties of the input signal, convolutional layers are often followed by a non-linear activation layer. MAX or Average Pooling is applied by replacing the input values with the maximum or the average value. The pooling layers reduce the sensitivity of the output to small input shifts. One or more dense layers are put in place, each followed by an activation layer which produces the classification result.
In this paper, a deep CNN for the classification of ILD patterns that exploits the capability of deep neural networks is proposed. The method has been evaluated on a dataset of 5606 X-ray images and the results confirm its superiority compared to the state of the art.
To the best of our knowledge, deep CNN is not trained and used for lung tissue characterization so far. Rules and principles on the design of CNN architectures for similar texture classification problems are provided.
Softmax Function
Softmax is often used in NNs to map the non-normalized output to a probability distribution over predicted output classes in the system. In mathematics, the Softmax function takes an un-normalized vector and normalizes it into a probability distribution.
Softmax is used in the final layer of a NN based classifier. The networks are commonly trained under a log loss regime giving a non-linear variant of multinomial logistic regression that is produced. It uses cross entropy loss.
This classifier derives its name from the Softmax function. It squashes the raw class scores into normalized positive values that sum to 1 so that the cross entropy loss can be applied.
Fig. 1 CNN Model
Softmax activation is normally applied to the last layer in a NN instead of using ReLU, sigmoid, tanh or
other activation functions [18]. It converts the output of the last layer in NN into a probability distribution. It is actually viewed as an activation function like sigmoid or ReLU.
Softmax is not a loss function but is used to make the output of a NN more ‘compatible’ with the cross entropy or negative log loss functions.
V. LUNG DISORDERS
There are various diseases which disturb the functioning of lungs as discussed below.
Consolidation
Consolidation is a region of lung tissue that is filled with liquid instead of air. The condition is marked by swelling or hardening of normally soft tissue of a normally aerated lung. It is considered as a radiologic sign. Consolidation is due to the accumulation of inflammatory cellular exudate in the adjoining ducts [19]. The liquid can be pus, inhaled water or blood.
Infiltration
An infiltrate is a substance which is denser than air, such as pus or blood which lingers within the lungs. It is associated with pneumonia and tuberculosis. Pulmonary infiltrates can be observed in a chest X-ray image.
Pneumothorax
Effusion
A pleural effusion is a collection of fluid in the space between the linings of the lung. When air is inhaled into lungs, the ribs move out and the diaphragm moves down. For the lung to expand, the lining has to slide along with the chest wall movement. For this, both the lungs and the ribs are covered with pleura. A small amount of fluid acts as a lubricant for these surfaces to slide easily against each other. Excess fluid impairs the ability of the lung to expand and move.
Nodule
A lung nodule is a medical term that describes a picture on a chest X-ray with a small spot in the lung. If the finding is larger, it would be described as a
mass. It can occur for a number of reasons, may be due to previous infection. But a nodule could also indicate an early cancer. If a lung nodule is less than 1 cm, it is monitored with a series of CT scans over a period of time. If there is no change, it might be a scar tissue. If it grows, it doesn’t mean that it is a cancer but it needs to be removed to find out [21].
Atelectasis
Atelectasis is due to the collapsing of the small air sacs positioned in the bottom and back of the lungs. When these air sacs collapse, the airflow in and out of the lungs is restricted. This occurs when the air sacs in question is underutilized from shallow breathing.
VI.DATASETS
Montgomery set and Shenzhen set [22] are used for training, while National Institutes of Health (NIH) dataset [] is used for testing.
Montgomery set
The Montgomery set is provided by the Department of Health and Human Services, Maryland, USA. This set contains CXRs collected under Montgomery County`s TB control program. This dataset consists of 138 images, 80 of which are normal images and 58 images are abnormal with manifestations of tuberculosis. The X-Ray images are captured with a Eureka stationary X-ray machine in 12-bit gray-scale. The images in this dataset have a resolution of 4020 pixels x 4892 pixels. The pixel spacing in both vertical and horizontal directions is 0.0875 mm.
Shenzhen set
Shenzhen set is available in collaboration with Guangdong Medical College, Shenzhen, China. The X-Ray images are from outpatient clinics and they were acquired as a part of the daily hospital routine using a Philips DR digital diagnostic system. This set contains 662 images, out of which 326 are normal images and 336 are images with manifestations of TB.
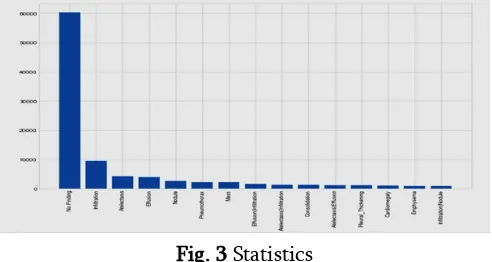
Fig. 3 shows the count of patients affected by diverse diseases.
Fig. 3 Statistics
National Institutes of Health (NIH) Dataset
The National Institutes of Health (NIH) Clinical Center recently released over 100,000 anonymized chest X-ray images and their corresponding data to the scientific community. NIH compiled the dataset of scans from more than 30,000 patients including many with advanced lung diseases.
VII. IMPLEMENTATION
The paradigm for implementing the proposed system is discussed below.
Pre-processing
The data sets are taken and all the redundant, unnecessary and unused parameters are removed from the data set using appropriate normalization techniques [24]. The directories are created for each of the disease classes, and the directories create links for each image under the appropriate disease classification.
Selection
When selecting a model, some of the initial considerations like area accuracy, complexity, performance, time required based on available resources and others are with respect to the particular input dataset size and type. Initial considerations for this particular project include a pre-trained model on ImageNet which is complex to fit the chest x-ray imagery. It is capable of training on the full NIH dataset in under a day, and an existing application in Keras and a model with high accuracy [25]
Loading
new top layer is created with the # of classifiers that are trained for prediction. In case of NIH dataset, there are 15 disease categories including ‘No Finding’.
Compilation
The model will be compiled in preparation for training the dataset. Here, many of the tunable hyper parameters are selected. First, the Loss function is selected for classification followed by cross entropy loss which is ubiquitous in modern deep neural networks. Next, an Optimization algorithm is selected. With the selection of a given optimizer, the values for the hyper parameters associated with each optimizer are selected.
Initially, a simpler Stochastic Gradient Descent (SGD) optimizer along with a variety of momentum values and learning rates are selected [20]. The authors have used the RMSProp optimizer. Since Adam resembles RMSProp to a greater extent and is more commonly used, Adam optimizer is used.
In case of Adam, there are a few additional hyper parameters: α = 0.001, β1 = 0.9, β2 = 0.999 and ∈ = 1e -8.
Callbacks
The metrics to be evaluated are selected. Both accuracy and top_k_categorical_accuracy are selected based on the metrics. After every training, one or more call back(s) are enabled to take some action. A common use-case is used to checkpoint the weights, if the measured metric shows some improvement.
If the validation loss improves, then the weights are saved so that it can be reloaded at any future time when it is to be retrained. The process starts with the best known weights at that time. In this case, there are 2 additional call backs: Early Stopping and Tensor Board log entries [27].
Early Stopping is also a common call back for many projects. If the measured metric have not improved over some N# epochs, early Stopping aids in stopping the training early.
Training
With each passing, backpropagation occurs and weights are updated. Here, a single epoch covers every single sample in the training set, updates the weights and repeats these ‘N’ times. Due to Graphics Processing Unit (GPU) memory limitations, it is not advisable to load all samples in a single batch. It is not good to plan for # epochs to be equal to # training samples divided by batch size. In this work, a small batch size with many epochs for at least full coverage of the training set is selected.
Visualisation
Keras records a history of training which is accessible as the output of the fit generator methods. History attribute is a record of training loss values and metrics values at successive epochs, and also validation of loss values and metric values [28]. The training and validation losses are plotted to gain an intuition about whether the model is over fitting (low train loss, high valid loss, most common), under fitting (high train loss, need more complexity in the model), or generalizing as desired (low train loss, low valid loss).
Saving
Evaluation
This is a traditional metrics used to evaluate a system. It is a reiteration of what was seen per epoch during training. Various models are compared against the validation set [30].
Favg= 2 7 ∑
recallc ∗precisionc
recallc+precisionc
7
c=1 (1) where,
recallc=
samples correctly classified as c
samples of class c (2)
precisionc=
samples correctly classified as c
samples classified as c (3)
Accuracyc=
correctly classified samples
total number of samples (4)
VIII. RESULTS AND DISCUSSIONS
Softmax is often used in NNS to map the non-normalized output to a probability distribution over predicted output classes in the system.
Keras is an open-source NN library written in Python. It is capable of running on top of TensorFlow, Microsoft Cognitive Toolkit, Theano, or PlaidML. It is designed to enable fast experimentation with deep NN and focuses on being user-friendly, modular and extensible.
A chest X-ray produces a black-and-white image of the organs in the chest. Structures that block the radiation appear white and those structures that let the radiation appear black.
Bones appear white as they are very dense. Heart appears as a lighter area and lungs are filled with air that block very little radiation, so that they appear as darker areas in the images.
Confidence
Truly reliable neural prediction systems require the prediction to be qualified by a confidence measure. A reliable and practical measure of prediction confidence is essential for real-world tasks.
Inter-Quartile Range (IQR) is a descriptive statistic which measures the ‘middle 50’ of a distribution; the difference between the 75th and 25th percentiles
(IQR=Q3-Q1). IQR is useful in identifying outliers which are considered for determining the confidence metric with respect to each of the model predictions. Fig. 4 shows the confidence of CNN based scheme.
Fig. 4. Confidence of CNN based Scheme
Accuracy
Accuracy describes the closeness of a measurement to the true value. It involves a component of random error and a component of systematic error.
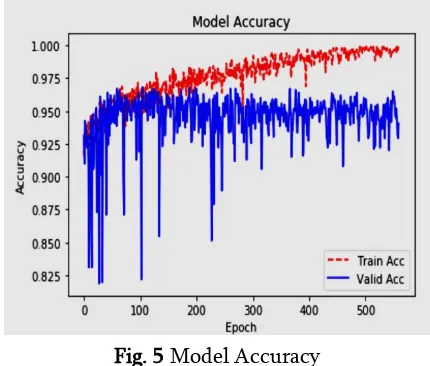
Fig. 5 shows the Accuracy of CNN based scheme.
Fig. 5 Model Accuracy
case of Hybrid dataset (combination of Montgomery dataset and Shenzen dataset), accuracy falls to 91%.
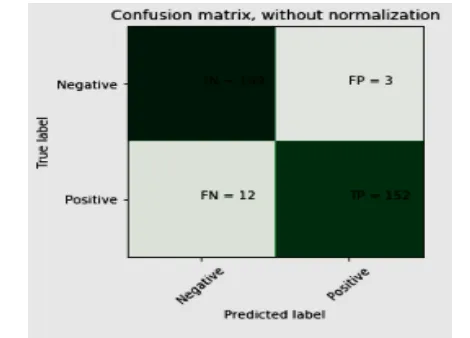
Confusion matrix
Plotting a confusion matrix helps to evaluate the quality of our model classification. The predictions are plotted against true labels. It is observed whether particular classes are repeatedly misclassified.
Fig. 6 shows the Confusion Matrix.
Fig. 6 Confusion Matrix
IX.CONCLUSION
In this paper, lung X-RAY image patches are classified into seven classes, including six different ILD patterns and healthy tissue using Deep CNN. Novel network architecture is designed to capture the low-level textural features of the lung tissue. The network consists of four convolutional layers, followed by one average pooling layer with size equal to the size of final feature maps. The proposed approach gives promising results; outperforming the state-of-the-art schemes on a very challenging dataset of 5606 X-ray scans collected from different hospitals and scan centres. The method can be easily trained on additional textural lung patterns, while performance could be further improved by a more extensive investigation of the involved parameters.
X. REFERENCES
[1]. Vanaudenaerde, B. M., Verleden, S. E., Vos, R., Vleeschauwer, S. I. D., Willems-Widyastuti, A., Geenens, R., & Meyts, I., Innate and Adaptive Interleukin-17-producing Lymphocytes in Chronic Inflammatory Lung Disorders, American Journal of Respiratory and Critical Care Medicine, Vol.183, No.8, pp. 977-986, 2011.
[2]. Lichtenstein, D. A., & Meziere, G. A., The BLUE-Points: Three Standardized Points used in the BLUE-Protocol for Ultrasound Assessment of the Lung in Acute Respiratory Failure, Critical Ultrasound Journal, Vol. 3, No. 2 , 2011.
[3]. Hou, R., Le, T., Murgu, S. D., Chen, Z., & Brenner, M., Recent Advances in Optical Coherence Tomography for the Diagnoses of Lung Disorders, Expert Review of Respiratory Medicine, Vol.5, No.5, pp.711-724, 2011. [4]. Budd, D. C., & Holmes, A. M., Targeting TGFβ
Superfamily Ligand Accessory Proteins as Novel Therapeutics for Chronic Lung Disorders, Pharmacology & Therapeutics, Vol. 135, No. 3, pp. 279-291, 2012.
[5]. Jaeger, S., Karargyris, A., Antani, S., & Thoma, G., Detecting Tuberculosis in Radiographs Using Combined Lung Masks, In Proceedings of the Annual International Conference of the IEEE Engineering in Medicine and Biology Society, pp. 4978-4981, 2012.
[6]. Hadavi, N., Nordin, M. J., & Shojaeipour, A., Lung Cancer Diagnosis using CT-scan Images based on Cellular Learning Automata, In Proceedings of International Conference on Computer and Information Sciences, pp. 1-5, 2014.
Lung Diseases using Chest Radiography, IEEE Region Symposium, pp. 151-156, 2014.
[8]. Karasawa, K., Kido, S., Hirano, Y., & Kozuka, K., Determination of Lung Regions on Chest CT Images with Diffuse Lung Diseases by use of Anatomical Structures and Pulmonary Textures, In Proceedings of 37th Annual International Conference of the IEEE Engineering in Medicine and Biology Society, pp. 2985-2988, 2015.
[9]. Poreva, A., Karplyuk, Y., & Vaityshyn, V., Machine Learning Techniques Application for Lung Diseases Diagnosis, In 5th IEEE Workshop on Advances in Information, Electronic and Electrical Engineering, pp. 1-5, 2017.
[10]. Alam, J., Alam, S., & Hossan, A., Multi-Stage Lung Cancer Detection and Prediction using Multi-class SVM Classifier, In Proceedings of the International Conference on Computer, Communication, Chemical, Material and Electronic Engineering, pp. 1-4, 2018.
[11]. Patel, T., & Nayak, V, Hybrid Approach for Feature Extraction of Lung Cancer Detection, In Proceedings of the 2nd International Conference on Inventive Communication and Computational Technologies, pp. 1431-1433, 2018.
[12]. Lee, H. K., Ju, F., Osarogiagbon, R. U., Faris, N., Yu, X., Rugless, F., Jiang, S., & Li, J, A System-Theoretic Method for Modeling, Analysis, and Improvement of Lung Cancer Diagnosis-to-Surgery Process, IEEE Transactions on Automation Science and Engineering, Vol. 15, No. 2, pp. 531-544, 2018.
[13]. Zhang, X., Osborn, T., Zhou, B., Bartholmai, B., Greenleaf, J. F., & Kalra, S., An Ultrasound Surface Wave Elastography Technique for Noninvasive Measurement of Surface Lung Tissue, The Journal of the Acoustical Society of America, Vol. 141, No. 5, pp. 3721-3721, 2017.
[14]. Volpicelli, G., Lung Sonography, Journal of Ultrasound in Medicine, Vol. 32, No. 1, pp. 165-171, 2013.
[15]. Reid, P. A., & Reid, P. T., Occupational Lung Disease, The Journal of the Royal College of Physicians of Edinburgh, Vol. 43, No. 1, pp. 44-48, 2013.
[16]. Carrillo, J., Restrepo, C. S., de Christenson, M. R., Leon, P. O., Rivera, A. L., & Koss, M. N., Lymphoproliferative Lung Disorders: a Radiologic-Pathologic Overview, In Seminars in Ultrasound, CT and MRI, Vol. 34, No. 6, pp. 525-534, 2013.
[17]. Inamdar, A. C., & Inamdar, A. A., Mesenchymal Stem Cell Therapy in Lung Disorders: Pathogenesis of Lung Diseases and Mechanism of Action of Mesenchymal Stem Cel, Experimental Lung Research, Vol. 39, No. 8, pp. 315-327, 2013.
[18]. Akella, A., & Deshpande, S. B., Pulmonary Surfactants and their Role in Pathophysiology of Lung Disorders, 2013.
[19]. Rama, J. A., Fan, L. L., Faro, A., Elidemir, O., Morales, D. L., Heinle, J. S., & Schecter, M., G., Lung Transplantation for Childhood Diffuse Lung Disease, Pediatric Pulmonology, Vol. 48, No. 5, pp. 490-496, 2013.
[20]. Andersson-Sjoland, A., Hallgren, O., Rolandsson, S., Weitoft, M., Tykesson, E., Larsson-Callerfelt, A. K., & Westergren-Thorsson, G., Versican in Inflammation and Tissue Remodeling: the Impact on Lung Disorders. Glycobiology, Vol. 25, No. 3, pp. 243-251, 2014.
[21]. Royce, S. G., Moodley, Y., & Samuel, C. S., Novel Therapeutic Strategies for Lung Disorders associated with Airway Remodelling and Fibrosis, Pharmacology & Therapeutics, Vol. 141, No. 4, pp. 250-260, 2014.
[23]. https://www.kaggle.com/shrikantds/cnn-in-nih-dataset/notebook
[24]. Thannickal, V. J., Murthy, M., Balch, W. E., Chandel, N. S., Meiners, S., Eickelberg, O., Selman, M., Pardo, A., White, E.S., Levy, B.D., Busse, P. J., Tuder, R. M., Antony, V. B., Sznajder, J. I., & Budinger, G. R. S., Aging and Susceptibility to lung disease, Blue Journal Conference, American Journal of Respiratory and Critical Care Medicine, vol.191, No.3, pp. 261-269, 2015.
[25]. Gao, M., Bagci, U., Lu, L., Wu, A., Buty, M., Shin, H. C., & Xu, Z., Holistic Classification of CT Attenuation Patterns for Interstitial Lung Diseases via Deep Convolutional Neural Networks, Computer Methods in Biomechanics and Biomedical Engineering: Imaging & Visualization, Vol. 6, No. 1, pp. 1-6, 2016 [26]. Faisal, A., Alghamdi, B. J., Ciavaglia, C. E.,
Elbehairy, A. F., Webb, K. A., Ora, J., & O’Donnell, D. E., Common Mechanisms of Dyspnea in Chronic Interstitial and Obstructive Lung Disorders, American Journal of Respiratory and Critical Care Medicine, Vol.193, No.3, pp. 299-309, 2016.
[27]. Malode, V. B., New Approach of Statistical Analysis for Lung Disease Diagnosis using Microscopy Images, In Proceedings of International Conference on Automatic Control and Dynamic Optimization Techniques, pp. 378-383, 2016.
[28]. Anthimopoulos, M., Christodoulidis, S., Ebner, L., Christe, A., & Mougiakakou, S., LUNG Pattern Classification for Interstitial Lung Diseases using a Deep Convolutional Neural Network, IEEE Transactions on Medical Imaging, Vol. 35, No. 5, pp. 1207-1216, 2016. [29]. Zhang, Y., Rong, J., Lu, H., Xing, Y., & Meng,
J., Low-dose Lung CT Image Restoration using Adaptive Prior Features from Full-dose Training Database, IEEE Transactions on
Medical Imaging, Vol. 36, No. 12, pp. 2510-2523, 2017.
[30]. Xie, Y., Xia, Y., Zhang, J., Song, Y., Feng, D., Fulham, M., & Cai, W., Knowledge-based Collaborative Deep Learning for Benign-Malignant Lung Nodule Classification on Chest CT, IEEE Transactions on Medical Imaging, 2018.
Cite this article as :
J. Juditha Mercina, J. Madhumathi, V. Priyanga, M. Deva Priya, "A Deep Convolutional Neural Network Based Lung Disorder Diagnosis", International Journal of Scientific Research in Computer Science, Engineering and Information Technology (IJSRCSEIT), ISSN : 2456-3307, Volume 5 Issue 2, pp. 102-112, March-April 2019. Available at doi : https://doi.org/10.32628/CSEIT19525