DOI : https://doi.org/10.32628/CSEIT195128
Finite/Infinite Queueing Models Performance Analysis in
Optical Switching Network Nodes
Waleed M. Gaballah** Department of Electronics and Communication Engineering, Mansoura High Institute of Engineering and Technology, Mansoura, Egypt
ABSTRACT
In optical switching networks, optical information (packets/bursts) that are forwarded from an optical switch to another through the network could entering a queue of a certain length in each node and may be waiting inside this node before it will be transmitted to the next node. Various queueing models have been widely applied as the main tool in optical switching networks for modeling and performance evaluation analysis of the switching nodes. In this paper, studying the performance analysis of an optical switching node is discussed at Finite and Infinite queueing models to have the optimum queueing model for optical core node switch design. The waiting delay time, the average expected number of optical packets and the loss probability of packets in the optical switch are estimated at variable traffic loads and different wavelength channels.
Keywords : Queueing Models, Optical Switching Network, Finite Queue, Infinite Queue, Blocking Probability
I. INTRODUCTION
An optical information traffic access to the network with a given capacity is modeled in optical nodes as a queue with a certain distribution of traffic arrival times and a certain distribution of traffic service time.
Queueing in the network nodes are modeled in a variety of network techniques and principles [1, 2]. The Queueing model is a theoretical aspect of such the network node [3]. Typically, a queueing model represents the network node physical configuration by determining the number of optical packets in the switch and how fast that switch serves the optical packet traffic. Also, the queueing models give a statistical nature of the optical switch node, by specifying the variability in the arrival process to the switch and in the switch service process. In an optical switching, optical packets arrive at a system (switch) as random intervals and are served during a random
time. In the switch if the wavelength channel is busy serving other packets, the arrivals are queued in the switch queueing buffer. Therefore, the model can determine the distribution of the number of packets in the system and their waiting time.
Queueing models in the optical switching networks have various application aspects. Queueing models with optical delay lines in optical packet switching networks are studied in [4]. The edge OBS node queueing is modelled in [5]. An analytical model optical delay line buffers in OBS networks using queueing theory are developed in [6].
For this, our work first presents some specific queueing models overview that can be used in optical switching networks, at section 2. The infinite and
finite queueing models’ numerical analysis is
obtained in section 3. Finally, conclude in section 4.
II. Queueing Models in Optical Switches
At the optical switches, the arriving optical information traffic request some specific amount of resources such as; circuit, bandwidth, wavelength channel, etc. to be served. The most common queueing models assume that the optical information traffic inter-arrival and service times follow the exponential distribution or equivalently follow a Poisson distribution process with Markovian or memoryless properties [7]. A commonly used shorthand notation, called Kendall’s notation [8], for such queue models describes the arrival process, service distribution, the number of servers and the buffer size (waiting line). The complete notation expressed as (a/b/c/d) where, Arrival process/service distribution/ number of servers/waiting line.
In optical switching networks, the commonly used characters for the first two positions in the shorthand notations are M (Markovian – Poisson for the arrival or Exponential for the service time). The third positions used for the number of the output optical wavelength channels w. The fourth position indicates the switch queueing size m and it's usually not used in infinity waiting room buffers.
There are single server queueing models such as M/M/1 and M/M/1/w, and multiple server's systems such as M/M/w, M/M/w/m, and M/M/w/w systems [9]. There is an infinite queue system such as M/M/w, where the optical traffic arrivals are hold waiting for service and not affected by the number of packets already on the queue because there is unlimited buffer size. In addition, there is a finite queue system such as M/M/w/m, which has a limited buffer
capacity. In finite queue, the optical arrivals that attempt to enter the full-occupied system are denied entry or blocked.
Table 1 represents the main differences between Finite and Infinite queueing models.
TABLEI
FINITE VS. INFINITE QUEUEING MODELS
Finite Queueing Model Infinite Queueing
Model
M/M/w/m M/M/w
The arrival rate
depends on the number of served and waiting packets in the system.
The arrival rate is not affected by the number of packets being served and waiting.
Limited buffer capacity. Unlimited buffer
capacity. Faster and has lower
average number of
waiting packets in the system.
Packets waiting long times in the buffer.
There is a packet loss probability.
No packet loss
probability.
III. Infinite/Finite Queueing Models Performance Analysis
packet/sec and average service rate µ packets/sec values.
The performance parameters that measured are:
- The average number of optical packets resident in the system Ls packets.
- The average number of optical packets waiting in
the queue Lq packets.
- The average time of optical packets spend in the
system (the average switch queueing delay time) Ws sec.
- The average time of optical packets waiting in the queue (the average waiting time to serviced) Wq sec.
- The blocking probability of optical packets PB (at
finite queueing models). At Infinite model we will study the influence of the wavelength channel numbers at the different two analysis cases. At Finite model the effect of the switch queueing size and the number of wavelength channels are illustrated on the optical switch performance taking in consideration the second analysis case.
A. Infinite Queueing Models
With infinite queuing systems M/M/w, where w is the number of servers or optical wavelength channels, the queue buffer size is infinite. The system filling Ls and the waiting times Wq and Ws, in the queue and the optical switch respectively, establish the main optical switch characteristics.
In figures from 1 to 4, the optical switch performance is studied at an infinite queueing models. Ws, Wq and Ls parameters are represented at different number of
wavelengths (servers), w = 1, 2, 8, 16, 32. In Fig. 1, the mean time in the system is very low and equal to 1/µ = 1 time unit. As the load increases, in the M/M/1 queue, the mean total time in the optical switch increases greatly and increased slightly as the number of wavelengths w increased. At the M/M/32 queue, the mean total time in the system only has a slightly increment. Therefore, as the number of wavelengths increased the queue has a superior performance than M/M/1 queue.
Figure 1. Average waiting time in the system vs. the offered load of M/M/w with different number of wavelength channels and μ = 1 packet/time unit per
channel
wavelength numbers w in order to keep the switching capacity constant.
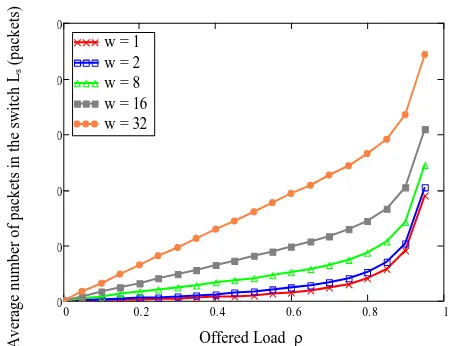
At high loads the mean time in the optical switch increases significantly because the waiting time in the queue component Wq becomes dominant. This increase in queueing waiting time also causes the increase in the system filling (Number of packets in the system) Ls shown in Fig. 3. However, this only results from the longer serving interval required per server and not from an increase in the mean waiting queueing time Wq. Figure 4 shows the mean waiting time in the switch queue Wq. It is decreased dramatically with increasing wavelength numbers w, and the service rate per channel be slower. So, in this case, it is clear that a single wavelength queueing model is preferred over a multi-wavelength model because it has less average number of packets resident in the system and lower mean time in the system.
Figure 2. Average waiting time in the system vs. the offered load of M/M/w with different number of wavelength channels and normalized to equal system load = by setting μ = 1/w packet/time unit per channel
Figure 3. Average number of packets in the system vs. the offered load of M/M/w with different number of wavelength channels and normalized to equal system load = by setting μ = 1/w packet/time unit
Figure 4. Average waiting time in the queue vs. the offered load of M/M/w with different number of wavelength channels and normalized to equal system load = by setting μ = 1/w packet/time unit
In a realistic view, if we consider that the switching capacity is constant, the best service is provided for the lower number of wavelengths possible. While, if the service rate per channel is constant, increasing a system wavelength channels is preferred.
optical switch with an adequately chosen number of wavelengths is the better choice.
B. Finite Queueing Models
In finite queueing model systems M/M/w/m, an arriving optical packet may be admitted to the free wavelength channel immediately. It may be placed in the queue until a wavelength channel is available, or it may be blocked due to all wavelengths are busy and all buffer places are occupied.
Figures from 5 to 8 illustrate how the finite queueing M/M/w/m performance depends on the system size m. systems. The analysis is using eight wavelengths, w = 8, and the switch buffer size m = (8, 16, 32, 64). Impact of the system size m on the optical switch declared at high traffic loads > 1. As the system buffer size increases, with a constant wavelength number, the more load can be buffered and that may increase the mean optical packets number in the system (switch filling) Ls, Fig. 5. Therefore, it is increasing the waiting time in the queue and in the system Wq and Ws, figures 6 and 7 respectively.
Figure 5. Average number of packets in the system vs. the offered load of M/M/w/m with different switch buffer size m and w = 8 wavelengths
Figure 6. Average waiting time in the switch vs. the offered load of M/M/w/m with different switch buffer size m and w = 8 wavelengths
Figure 7. Average waiting time in the queue vs. the offered load of M/M/w/m with different switch buffer size m and w = 8 wavelengths
However, this cause a heavily decreases in the switching blocking probability PB as in Fig. 8.
Figure 8. Packets blocking probability PB in the consequently, these systems are commonly called loss systems.
To study the influence of the number of wavelength channels on the queueing model performance, figures from 9 to 12 show the performance of M/M/w/m
Figure 10. Average number of packets in the switch vs. Average number of wavelengths for M/M/w/m
Average number of wavelengths w
1 1.2 1.4 1.6 1.8
Average number of wavelengths w
20 40 60
Figure 12. Packets blocking probability PB in the gives the better performance, less average number of packets and low waiting time in the system. However, the strong reduction of the blocking probability PB is gained from the implicit queue size increase.
Then, on finite queueing optical switches, the blocking probability decreases at increasing the number of wavelengths (servers).
Finally, Fig. 13 investigates the switch blocking probability PB for the M/M/w/w model at different number of wavelength channels w = 8, 16, 32. The switch performance illustrated at different traffic loads = 0 to 2.
Figure 13. Packet blocking probability PB in the system vs. the offered load of M/M/w/w at different servers and =
It is clear that as the load increases, the blocking probability also increases at low traffic and saturated at high traffic. However, as the number of wavelength channels increases, the blocking probability decreases because the incoming traffic has a more chance to be serviced.
IV.CONCLUSION
Optical switching network node performance analysis was done with Finite and Infinite queueing models to indicate the optimum model at optical switch design. Queue delay time, expected number of packets in the system and blocking probability are the main parameters in the analysis to demonstrate the optical switch performance. At Infinite queueing model, two different analysis cases were used to represent the wavelength channel number impact on the optical switch node performance. First analysis was considered a constant service rate per channel which is preferred if the costs of using more wavelengths switch less. However, fixed switching capacity analysis is better at lower wavelength
Average number of wavelengths w
traffic loads. As the system buffer size increases, with a constant wavelength number, the more load can be buffered and that may increase the mean optical packets number in the system. Therefore, it is increasing the waiting time in the queue and in the system. Also, the switching blocking probability PB is heavily decreases.
As the number of wavelength channels increased with fixed queue buffer size, the blocking probability increased due to the switch buffer capacity lowered until it reaches zero at M/M/w/w queueing system. At M/M/w/w queue system, it is faster and has less waiting packets in the switch, while it has high blocking probability due to no queue buffer. At this model, as the number of wavelength channels increases, the blocking probability decreases due to that the incoming traffic has a more chance to serviced. Therefore, using M/M/w/w queueing system can be modelled well at optical switching nodes under a certain predefined number of wavelengths to lower the blocking probability problem.
V. REFERENCES
[1] Van Do, Tien, et al., eds., Queueing Theory and Network Applications, Springer International Publishing, 2016.
[2] E. Yue, Wuyi, Quan-Lin Li, Shunfu Jin, and
Zhanyou Ma, “Queueing Theory and Network
Applications,” in 12th International
Conference, QTNA 2017, 2017.
[3] Thomopoulos, Nick T., Fundamentals of
Queuing Systems: Statistical Methods for Analyzing Queuing Models, Springer Science & Business Media, 2012.
[4] Zhu, Xiaoming, and Joseph M. Kahn,
"Queueing models of optical delay lines in synchronous and asynchronous optical packet-switching networks," Optical Engineering, vol. 42, no. 6, pp. 1741-1748, 2003.
[5] Lisong Xu, Harry G. Perros and G. N. R., “A
Queueing Network Model of an Edge Optical
Burst Switching Node,” in INFOCOM 2003.
Twenty-Second Annual Joint Conference of the IEEE Computer and Communications. IEEE Societies, 2003, pp. 2019–2029.
[6] Kumar, OS Sunish, C. S. Jaison, Indu Reena
Varughese and V. K. J., “The Analysis of M/M/r
Queuing Model for Fiber Delay Lines to
Resolve BLP in OBS Networks,” In Emerging
Research Areas and 2013 International
Conference on Microelectronics,
Communications and Renewable Energy (AICERA/ICMiCR), 2013 Annual International Conference, 2013, pp. 1–3.
[7] Bolch Gunter, Stefan Greiner, Hermann de Meer, and Kishor S. Trivedi, Queueing networks and Markov chains: modeling and performance evaluation with computer science applications, John Wiley & Sons, 2006.
[8] Harchol-Balter, Performance modeling and
design of computer systems: queueing theory in action, Cambridge University Press, 2013.
[9] Zukerman M., “Introduction to queueing
theory and stochastic teletraffic models,”
arXiv:1307.2968, 2018.
[10] Bhat, U. Narayan. An introduction to queueing theory: modeling and analysis in applications, Birkhäuser, 2015.
Cite this article as :
Waleed M. Gaballah, "Finite/Infinite Queueing Models Performance Analysis in Optical Switching Network Nodes", International Journal of Scientific Research in Computer Science, Engineering and Information Technology (IJSRCSEIT), ISSN : 2456-3307, Volume 5 Issue 1, pp. 163-170,
January-February 2019. Available at doi :
https://doi.org/10.32628/CSEIT195128