CSEIT184629 | Published – 08 May 2018 | May-June 2018 [ (4 ) 6 : 140-148 ]
National Conference on Engineering Innovations and Solutions (NCEIS – 2018)
International Journal of Scientific Research in Computer Science, Engineering and Information Technology © 2018 IJSRCSEIT | Volume 4 | Issue 6 | ISSN : 2456-3307
140
Automated Detection of Optic Disc Location in Retinal Images
using Histogram Matching
Rachana k*, Ashwini H, Navya N V
ECE, Cauvery institute of technology, Mandya, Karnataka, India
ABSTRACT
In this article, we propose a new method for localizing optic disc in retinal images. Localizing the optic disc and its center is the first step of most vessel segmentation, disease diagnostic, and retinal recognition algorithms. We use optic disc of the first four retinal images in DRIVE dataset to extract the histograms of each color component. Then, we calculate the average of histograms for each color as template for localizing the center of optic disc. On this data set, our method achieved 95% success rate for the localization of the optic disc and 70% success rate for the identification of the optic disc contour (as a circle).
Keywords. Optic disc’, Retinal image, Identification algorithms, Diabetes, DRIVE and STARE dataset
I.
INTRODUCTION
OD(optic disc)detection is the main step while developing automated screening systems for diabetic retinopathy and glaucoma. OD boundary and localization of macula are the two features of retina necessary for the detection of exudates and also knowing the severity of the diabetic maculopathy Retina is the innermost layer of the eye which can be visua-lized using adequate apparatus such as fundus camera. The two main structures used in retinal image analysis are blood vessels and optic disc. The automatic and efficient detection of the position of the OD in colour retinal images is an important and fundamental step in the automated retinal image analysis system [1]. Optic disc is a key reference for recog-nition algorithms [2,3], blood vessels segmentation [4], and diagnosing some diseases such as diabetes [5]. Histo-gram is the main character of each image and histogram-based methods are used as the first step of most prepro-cessing methods to improve the contrast and illumination of retina images. One of the main drawbacks of uneven
illumination in retina images and their poor quality is the inability to analyze the optic disc. Applying illumination equalization (histogram equalization, histogram specifica-tion, and other normalization methods) as preprocessing methods to retina images considerably improves the contrast, and illumination for further analysis tasks such as optic disc localization and vessel segmentation [6,7]. In this article, we propose a new method based on the histo-grams of some optic discs extracted from retinal images. For this purpose, we extract the optic disc of the first four retinal images in DRIVE dataset. Then, we calculate the average of histograms for each color component as template to localize the center of optic disc.
II.
REVIEW OF PREVIOUS METHODS
Osareh [8] proposed a method based on template matching for localizing the center of optic disc. In this algorithm, some of retinal images in dataset were used to create a template and the correlation between each image and template is computed. The point which has the maximum correlation value is selected as the center of optic disc.
The registration of retinal images is an important step for super-resolution and image change detection. Unique feature points within image are used as control points for registration. OD is an unique anatomic structure within retinal image. These methods play major role in automatic clinical evaluation system. When feature based registration algorithms are used, the accuracy of the features themselves must be considered in addition to the accuracy of the registration algorithms [9]. OD acts as landmark feature in registration of multimodal or temporal images.
Li and Chutatape [10] proposed a new method to localize optic disc center. The candidate regions were first determined by clustering the brightest pixels in retinal images. This strategy can only work when there is no abnormality in the retina image. Principal component analysis was applied to these candidate regions. The minimum distance between the original retinal image and its projection onto disk space was located as the center of optic disc.
Rangayyan et al. [11,12] proposed two different methods. In the first method, optic disc center was localized based on the property that it appears as the focal point of the blood vessels in retina mage. The method includes detec-tion of the blood vessels using Gabor filters and detection of peaks in the node map via phase portrait analysis. In the second method, edge detection using the Sobel operators and detection of circles using the Hough transform were employed to localize optic disc and its center.
Aquino et al. [13] used two independent methodologies to detect optic disc in retina images.
Location methodology obtains a pixel that belongs to the optic disc using image contrast analysis and structural filtering techniques. Then, a boundary segmentation methodology estimates a circular approximation of the optic disc boundary by applying mathematical morphology, edge detection techniques, and the circular Hough transform.
Siddalingaswamy and Gopalakrishna Prabhu [14] pro-posed a new approach for the automatic localization and accurate boundary detection of the optic disc. Iterative thresholding method followed by connected component analysis was employed to localize the approximate center of the optic disc. Then, geometric model based on
Foracchia et al. [15] presented a new technique for localizing the optic disc center in retinal images. The method was based on the preliminary detection of the main retinal vessels. All retinal vessels originate from the optic disc and their path follows a similar directional pattern (parabolic course) in all images. To describe the general direction of retinal vessels at any given position in the image, a geometrical parametric model was proposed, where two of the model parameters are the coordinates of the optic disc.
Carmona et al. [16] used genetic algorithm method to obtain an ellipse approximating the optic disc in retinal images. A set of hypothesis points were initially obtained that exhibited geometric properties and intensity levels similar to the optic disc contour pixels. Then, a genetic algorithm was used to find an ellipse containing the maximum number of hypothesis points in an offset of its perimeter, considering some constraints.
A number of other interesting algorithms can be found in the literature that used vessel segmentation results for optic disc localization [17-20].
main course of the vasculature based on the location of the OD. Next, the information from the active shape model was used to find the macular centre.
Huajun Ying et al. [22] utilized fractal analysis to differentiate OD area from other large and bright regions in retinal images due to the fact that the OD area is the converging point of all major vessels.
An important prerequisite for automation is the accurate localization of the main anatomical features in the image. An accurate and efficient detection of these structures is a significant task in an automated retinal image analysis system.
The contribution of this work is that we propose an automatic system to locate an OD not only in normal, healthy images but also in images affected because of diseases such as diabetic retinopathy and images of poorer quality. There are more chances of false OD detection in images affected due to diseases and images of poor quality than desirable. The problem with retinal images is that the quality of the acquired images is usually not good. As the eye-specialist does not have complete control over the patient’s eye which forms a part of the imaging optical system, retinal images often contain artifacts and/or are of poorer quality than desirable [24]. Despite controlled conditions, many retinal images suffer from non-uniform illumination given by several factors. the curved surfaces of the retina, pupil dilation (highly variable among patients) or presence of disease among others [25]. However, our system avoids detecting false OD applying different criteria based on different principles. We tested proposed system on 453 retinal images which include normal (healthy) as well as abnormal (affected) retinal images. We are able to locate OD in 98.45% of all tested cases. Once the OD is located accurately, its centre is also located accurately.
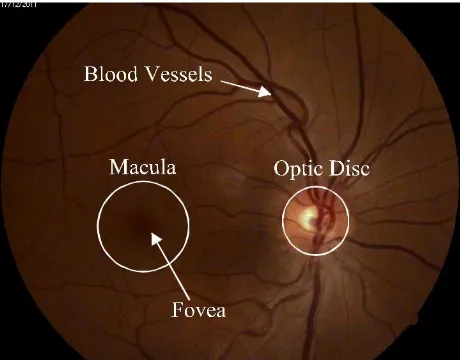
Figure 1. Retinal components
OD has approximately 0.5-mm thick and covers the inner side at the back of the eye. The center of the retina is the optical disc, a circular to oval white area measuring about 3 mm2 (about 1/30 of retina area). The mean diameter of the vessels is about 250 μm (1/40 of retina diameter).
The main retinal components from figure[2] 1- Superior temporal blood vessels
2- Macula 3- Fovea 4- Optic disc
III. METHOD
Figure 2. The four retinal images used to obtain their optic disc
In this method, we use a number of retinal images to create a template for optic disc. However, instead of creating an image as template, we construct three histograms as template, each corresponding to one color component. At the first step to decrease the effect of noise, we apply an average filter with the size of 6 × 6 pixels to retina images. Then, we use a window with the typical size of the optic disc (80 × 80 pixels) to extract the optic disc of each retinal image. In the next step, we separate color components (red, blue, and green) of each optic disc to obtain the histogram of each color compo-nent. Finally, the mean histogram of each color compo-nent for all retinal image samples is calculated as template. Histogram is a graph showing the number of pixels at each different intensity value found in an image. As illustrated before, we use the histogram of each three channels (red, green, and blue) as template for optic disc localization. Then, to decrease the effect of pathological regions and exudates that are high-bright regions like optic disc, we use the histogram of pixels which has the intensity value lower than 200. Therefore, we decrease the effect of high intensity regions that are common in optic disc,
patho-logical regions and exudates and the role of vessels for optic disc localization will increase.
Template matching
Up to now, we determined three histograms as template for localizing the center of optic disc. For localizing the center of optic disc, at first step to decrease the effect of noise an average filter with the size of 6 × 6 pixels is applied to retina image. Then, an 80 × 80 pixels window is moved through retinal image. In each moving window, we separate the channels (red, blue, and green) and obtain the histogram of each channel. Then, we calculate the correlation between the histogram of each channel in the moving window and the histograms of its corresponding channel in template. For this purpose, we can use correlation or cross-correlation function to obtain the similarity of the two histograms; however, the optic disc centers obtained using these methods are not accurate.
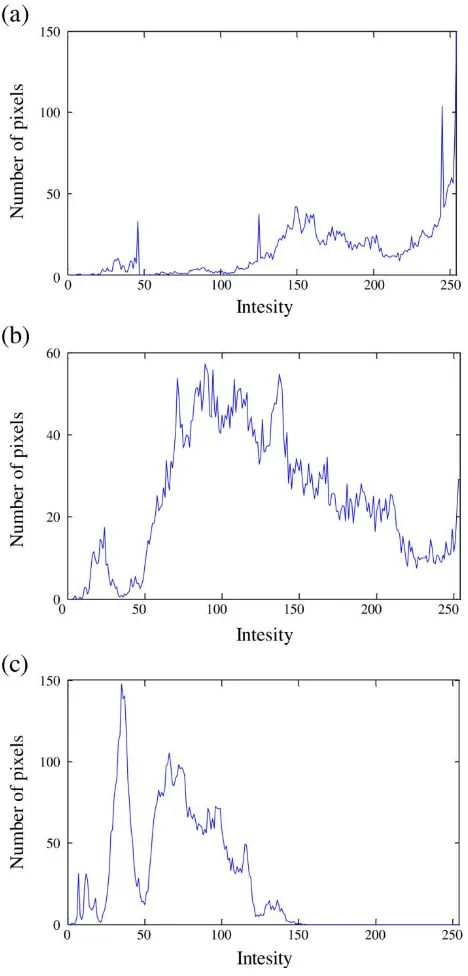
Figure 3. Histograms for three channels.(a) red, (b) green, (c) blue.
Here the contrast of the green channel is higher than red and blue channels]. In some retinal images, blue channel is noisy; therefore, to decrease the effect of blue channel on our localizing method, we determine the lowest weight for blue channel. The best weights that result high accuracy rate for optic disc localizing method are tr=0.5, tg=2, and tb=1. To localize the center of optic disc.
Figure 4. (a, c, e, g) Original images; (b, d, f, h) results of applying thresholding.
For finding the best threshold, we did a global scanning of different values and the best equation to determine the threshold (Th) was obtained as follows.
Th ¼ 0.5 maxð C Þ ð3Þ
where max(C) is the element of C with the maximum value. Therefore, the threshold value for each image is half of the maximum value of the correlation function. The center of gravity of the binary image obtained from thresh-olding is considered as the center of optic disc.
IV. RESULTS
In Figure 3, we can see three histograms obtained as template for localizing the center of optic disc.
The proposed method was applied on a dataset including 40 retina images from DRIVE dataset (565 × 584 pixels), 81 retinal images from STARE dataset (605 × 700 pixels) [29], and 273 retinal images from a local dataset (720 × 576 pixels). Retina images in local dataset were captured by a Canon CR5 in Razi clinica from normal and abnormal eyes. The success rate was 100, 91.36, and 98.9% for these three datasets, respectively. In Figure 5, some retina images in datasets and the results of applying threshold before determining the center of optic disc are shown.
In Figures 6, 7, and 8, the results of the proposed method for some retinal images in our datasets are shown. In presence of abnormality in the eye (patho-logical regions or exudates), using the histogram analysis
Figure 5. Optic disc center for retina images in DRIVE dataset.
Figure 6. Optic disc center for retina images in STARE dataset.
of optic disc is more effective. Pathological regions, exu-dates, and optic disc are bright regions in the retina images. Therefore, methods such as template matching or methods which are based on the segmentation results of blood vessels fail to localize the center of optic disc in presence of pathological regions and exudates in retina image.
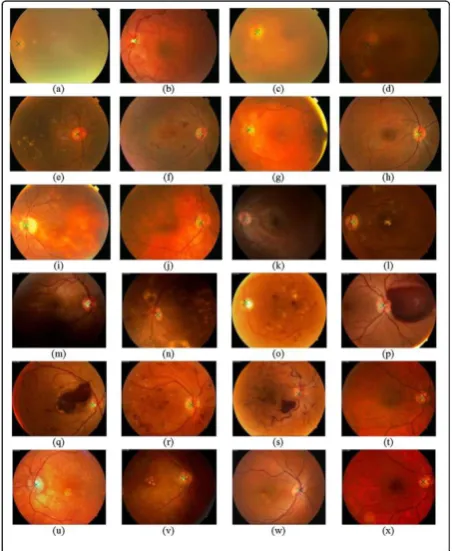
Figures 5, 6, and 7 show the result of the proposed method on normal retina image and retina images with pathological regions and exudates. Despite the existence of dark hemorrhages or bright exudates and pathological regions, the results of the proposed method are satisfactory and it shows the effectiveness of the proposed method for localizing the center of optic disc. In Figure 9, some retinal images with incorrectly detected optic disc center are shown.
disc. Therefore, our proposed method failed to localize the optic disc center. Therefore, in situation like Figure 9a that there are not any vessels in optic disc vicinity or in situation that we have pathological region with high number of vessels, our proposed method failed to localize optic disc center.
Figure 7. Optic disc center for retina images in local dataset.
Comparing the proposed method and its counterparts, Table 1 shows the effectiveness of the proposed method. The datasets used in the proposed method are larger than datasets used in other methods and thanks to avoiding pre-processing algorithms such as segmentation, the proposed method takes less computation time in
Figure 8. A number of retinal images with incorrectly detected optic disc center.
comparison to the counterpart methods. In Table 1, the running times of some methods are indicated. The system’s configuration used in each algorithm was different. Therefore, simple comparison of the running time of different methods does not appear to be correct. A parameter which determines the running time of different methods is computational complexity. In methods that use segmentation, a large number of operations per pixel are needed and consequently these methods require high order of computational cost. In our proposed method, no preprocessing such as segmentation is required; therefore, it takes less computational time. To clarify that system’s configuration does not have high effect we used a com-puter with system’s configuration of Intel Core 2 Duo, 1.7 GHz, and 512 MB RAM and the average running time for this configuration was 32.5 s.
V.
DATA SETS AND MATERIALS
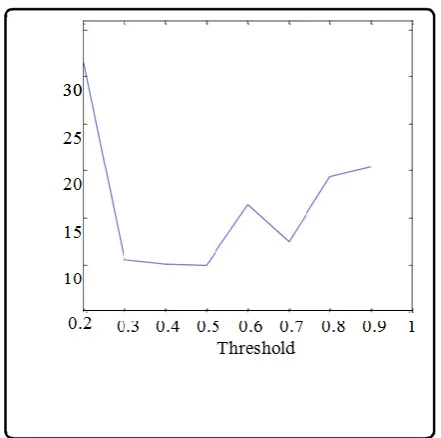
Figure 9. Sensitivity of the proposed method to thresholding based on average distance.
The average distance between the estimated and manually identified optic disc centers based on the different amount of thresholdings is plotted in figure 9
From Figure 10, we can understand the effect of thresh-olding on the average distance between the estimated and manually identified optic disc centers. Therefore, the best threshold value is half of the maximum value of the correlation function obtained before applying threshold.
VI.
CONCLUSION AND FUTURE WORK
In this article, we presented a new method for localizing the center of optic disc. The average distance between the estimated and the manually identified optic disc centers is 17 and 26 pixels in [9] and 23.2 and 119 pixels in [11] for DRIVE and STARE datasets, respectively. These values in the proposed method are 15.9, 11.4, and 8.9 pixels for DRIVE, STARE, and local datasets, respectively. Therefore, the estimated optic disc centers obtained using the proposed method are more accurate in comparison to other algorithms such as methods introduced in [9,11,12]. In this article, we used the histograms of some optic discs and in presence of
pathological regions and exudates in retinal images, and we could determine the center of optic disc correctly. Most of the counterpart methods perform well when there are no pathological regions or exudates in retinal images. In this article, the first four retinal images in DRIVE dataset were used to obtain their histograms as template, using more retinal images such as retinal images in STARE and local datasets may improve the effective-ness of our proposed method. Also to decrease the running time of our proposed method, we can combine our proposed method with other methods. For example, as we know template matching method proposed in fails in situation like pathological regions and exudates exit and also the accuracy of template matching method for localizing optic disc center of retina images without any pathological regions and exudates is low. Therefore, we can use template matching method for retina images to obtain candidate regions that probability of existing optic disc in them is more than other regions in retina images. Then, instead of applying our proposed method on the whole of retina images, we apply it to candidate regions to obtain optic disc center. Therefore, the running time of our proposed method will considerably decrease. In future work, we use optic disc center obtained as the first step for localizing the boundary of optic disc and also we can use the optic disc center for recognition algorithm in our future research for human recognition based on the retinal images.
VII.
REFERENCES
[1] VV Kumari, N Suriyanarayanan, Blood vessel
extraction using wiener filter and morphological operation. Int. J. Comput. Sci. Emerg. Technol. 1(4), 7–10 (2010)
[2] H Farzin, H Abrishami Moghaddam, M.-S. Moin, A
novel retinal identification system. EURASIP J. Adv. Signal Process 2008, Article ID 280635 (2008). doi.10.1155/2008/280635
[3] M Ortega, MG Penedo, J Rouco, N Barreira, MJ
Process 2009, Article ID 235746 (2009). doi.10.1155/2009/235746
[4] PC Siddalingaswamy, K Gopalakrishna Prabhu,
Automatic localization and boundary detection of optic disc using implicit active contours. Int. J. Comput. Appl. 1, 7 (2010)
[5] M Foracchia, E Grisan, A Ruggeri, Detection of
optic disc in retinal images by means of a geometrical model of vessel structure. IEEE Trans. Med. Imag. 23(10), 1189–1195 (2004)
[6] EJ Carmona, M Rincón, J García-Feijoo, JM
Martínez-de-la-Casa, Identification of the optic nerve head with genetic algorithms. Artif. Intell. Med. 43(3), 243–259 (2008)
[7] KW Tobin, E Chaum, VP Govindasamy, TP
Karnowski, Detection of anatomic structures in human retinal imagery. IEEE Trans. Med. Imag. 26(12), 1729–1739 (2007)
[8] AD Fleming, KA Goatman, S Philip, JA Olson, PF