COUNTY, KENYA
HANNAH WAIRIMU GITONGA
Al 03/14475/2009A Thesis Submitted
in Partial Fulfillment
of the Requirements
for the
Award of Degree of Master of Science (Agribusiness
Management
and
Trade) in the School of Agriculture
and Enterprise
Development
of
Kenyatta
University
I Hannah Wairimu Gitonga, declare that this thesis is my original work and has not been presented for the award of a degree in any other university or any other award.
Signature: . .
DatJD!rd!.?P.
1,5..
.
Hannah Wairi u Gitonga (AI 03114475/2009) Department of Agribusiness Management and Trade
SUPERVISORS
We confirm that the work reported in this thesis was carried out by the candidate under our supervision and has been submitted with our approval as university supervisors.
Signatur~:
.
Date ..L
..{
~t~~.I.!f.
.
Dr. Eric Bett (PhD),
Department of Agribusiness Management and Trade,
Signature:
L..
.
.
..
.
.
.
..
..
.
.
.
.
..
.
.
.
..
.
DateJ.~
..
\.~
..
\.~1
3?
\(
.
Dr. Patrick Mbataru (PhD),DEDICATION
ACKNOWLEDGEMENTS
2.7 Methods of measuring willingness to pay 16 2.8 Analytical methods to determine willingness topay 18
2.9 Critical review ofconsumer preference studies 22
CHAPTER
THREE
253.0 MATERIALS AND METHODS 25
3.1 Introduction 25
3.2 Location of study 25
3.3 Sampling technique 26
3.4 Research instrument and data collection 29
3.5 Measurement of variables and data analysis 31
3.5.1 Hedonic model specification 33
CHAPTER FOUR 38
4.0 RESULTS 38
4.1 4.2 4.3 4.3.1 : 4.3.2 4.4 4.4.1 4.4.2 4.5. 4.5.1 4.5.2 4.5.3 4.5.4 4.5.5
Introduction 38
Socioeconomic characteristics, consumption and residence of respondents38 Evaluation of consumer preference for cornmon bean varieties .42 Consumer preference in cornmon bean varieties based on dwelling place ...44
Respondents age and preference in cornmon bean varieties .45 Evaluation of consumer preference in attributes of cornmon beans 45 Consumer preference in bean attributes after pairwise comparison .45
Attribute ranking according to variety 46
Evaluation of consumer willingness to pay for ranked attributes 53
KAT X 56 Gituru 54
KAT B9 56
GLP 2 Rosecoco (Nyayo) 56
GLP 24 Canadian Wonder 56
CHAPTER FIVE 57
5.0 DISCUSSION 57
5.1 Introduction 57
5.2 Respondents' socio economic characteristics 57
5.3 Consumer preference in common bean varieties 59
5.4 Consumer preference in attributes of common bean varieties 62 5.5 Effect ofpreferred attributes on willingness to pay price 69
CHAPTER SIX 76
6.0 CONCLUSION AND RECOMMENDATIONS 76
6.1 Introduction 76
6.2 Conclusion 76
6.3 Recommendations 78
LIST OF TABLES
Table 3.1: Description of study area 26
Table 3.2: Probability proportional to size sampling for bean traders 28 Table 3.3: Description ofvariables that were evaluated 35 Table 4.1: Socioeconomic characteristics of respondents (n=212) 39 Table 4.2: weekly b.ean consumption based on region 42
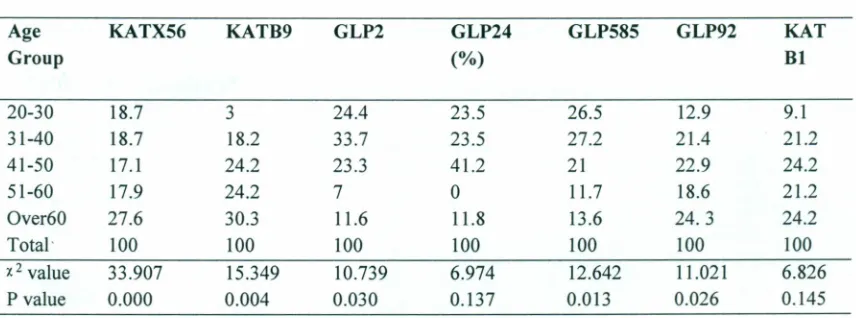
Table 4.3: Consumer preference scores for common bean varieties (1-7) 43 Table 4.4: Different age groups' Preference in bean varieties 45 Table 4.5: Results of pairwise comparison of common bean attributes 46 Table 4.6: GLP 2 keeping quality ranking by different age groups 48
Table 4.7: Ranking of KAT X 56 Gituru's taste by different age groups 50 Table 4.8: Ranking of GLP 92 Mwitemania color by different age groups 51
LIST OF FIGURES AND PLATE
Fig. 1.1: Decision making process 8
Fig 4.1: Respondents weekly bean consumption and monthly incomes 40
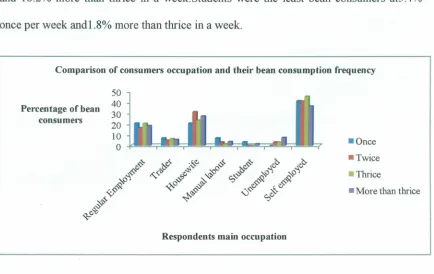
Fig 4.2: Respondents' weekly bean consumption and occupation 41
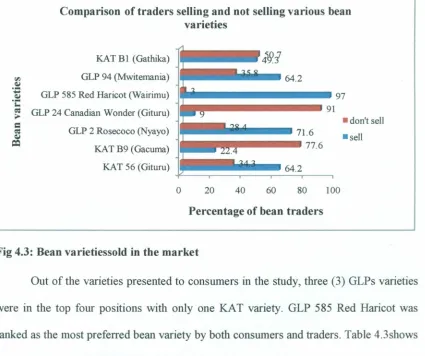
Fig 4.3: Bean varieties sold in the market 43
Fig 4.4: KAT B9 cooking quality ranking by different age groups 47 Fig 4.5: Market prices and willing to pay price for a kilo of beans 49
APPENDICES
Appendix 1:Map of larger Thika district showing study area 89
Appendix 2: List of released bean varieties since 1980 to 2010 90
Appendix 3: Data collection and analysis plan 92
Appendix 4: Summary of consumer preference literature 93
Appendix 5: Survey questionnaire 98
Appendix 6:Pairwise comparison of bean attributes 106
Appendix 7: Attribute ranking according tovariety 107
Appendix 8: Evaluation of common bean attributes for consumer preference 109
Appendix 9: Consumers source of nutrition information of common beans 109
Appendix 10: Breusche-Pagan heteroscedasticity test results 1JO
Appendix 11: Regression results for seven bean varieties 110
l. Regression results for KAT X 56 Gituru ll0
2. Regression results for KAT B9 Gacuma 111
3. Regression results for GLP 2 Rosecoco .111
4. Regression results for GLP 92 Mwitemania .112
5. Regression results for GLP 24 Canadian Wonder 112
6. Regression results for GLP 585 Wairimu .113
7. Regression results for KAT B 1 Katheka 113
Appendix 12:Variety ranking based on consumers dwelling place 114
Appendix 13:Bean consumption frequency by different age groups 114
Appendix 14: Consumers education level and consumption frequency 114
DEFINATION OF TERMS
Grain color: refers to the color beans impart into the food.
Grain size: refers to the expansion and visibility of the bean upon cooking.
Price: the market price of each variety during the time of study. Bean varieties have different prices no matter the season.
Cooking time: refers to the duration a variety takes to cook. This study evaluated whether the time taken to cook a variety was acceptable to the consumer.
Cooking quality: refers to the structure of the cooked bean, whether it mashes up or remains whole.
Keeping quality: refers to the ability of the variety to stay fresh without spoiling. The benchmark was two days, being the normal time well preserved boiled beans can be stored under natural conditions without spoilage.
Flatulence: refers to the discomfort of excessive gas experienced after consuming beans.
The discomfort experienced is different for each variety.
APA
-CGIAR
CIAT
DAO
FAO
GDP
GLP
GoK
KAT
KNBS
MOA
NARS
WTP
M-asl
ACRONYMS AND ABBREVIATIONS
American Pulse Association
Consultative Group on International Agricultural Research
Centro International de Agricultura Tropical District Agricultural Officer
Food and Agricultural Organization Gross Domestic Product
Grain Legume Programme Government of Kenya Katumani
Kenya National Bureau of Statistics Ministry of Agriculture
National Agricultural Research Systems Willingness To Pay
ABSTRACT
Common bean (Phaseolus vulgaris L.) is an important source of livelihood and food for approximately three million households in Kenya. Consumers appreciate common bean more due to its nutritional value and health benefits. Between 2005 and 2009, a total of 403,604 MT of bean with a value of US$ 199,743,000 was produced in Kenya. The Kenyan bean market has a deficit of 14,256 metric tons and is dominated by old improved bean varieties, an indication of consumer preference for those beans. This is despite new varieties being released into the market following intensive research and breeding work done by research institutions. Consumer preference assessment gives important information on acceptability of a commodity by consumers. The primary objective of this study, therefore, was to analyze consumer preference for common bean varieties by attribute sensory test and willingness to pay for preferred attributes. This study focused on bean consumers and traders in two districts, Thika East and Thika West of Kiambu County. The region was chosen as a test bed for this study due to high utilization of common beans in most of the diets among the residents. Additionally the two districts were selected because of their high population, diverse socioeconomic characteristics of residents, and their rural and urban living setups. Semi structured questionnaires were used to elicit information from 212 consumers and 67 traders who were randomly selected. Bean variety preference was assessed using a preference scale of 1-7 score. A pairwise analysis of eight bean attributes was done to assess preference of bean attributes. This was followed by assessment of attributes in seven bean varieties using likert scale of 1-5 rank. A hedonic price model was used to analyze effect of preferred attributes on price consumers were willing to pay. Data analysis was done using descriptive and inferential statistics in Excel and SPSS software programs. Results showed that beans were an important part of respondents diet with majority of respondents (86%) consuming beans more than once a week. Rural respondents consumed beans more frequently compared to urban respondents; difference in consumption was statistically significant (p-value =0.025). Beans were popular with women (83%) and were consumed by all age groups but there was more consumption in the 31-40 years age group (26.8%). GLP 585 was ranked l ", GLP 2 was ranked 2nd and
KAT X56 was ranked 3rd in preference by 64.7%, 43% 39.8% respondents respectively.
CHAPTER ONE
1.0 INTRODUCTION
1.1 Overview
The chapter gives the basis of the study. It gives the background of the study,
statement of the problem under investigation, objectives, hypotheses, significance, scope
of the study and conceptual framework.
1.2 Background to the problem
Modem food industry faces the challenge of developing food products in
accordance with consumer needs (Bech et al., 1997). This is as a result of global and
regional integration which has exposed consumers to diverse commodities subsequently
changing their preferences. Research in common bean by National Agricultural Research
Systems (NARS) has been oriented towards increasing yield and producing surplus for
sale and improving nutrient content- biofortication, as a strategy for family aut
o-sufficiency, alleviate malnutrition, hunger and poverty (Katungi et al., 2009), occasioned by among others; increasing population growth and increasing cost of agricultural
products especially animal related. Emphasize on improved production technology
research, has left out consumer preference an important component in acceptability and
marketing of products.
The common bean is an important crop for small-scale farmers grown by more
than three million households in Kenya (Katungi, et al., 2010). It has short growth cycle which permits production when rainfall is erratic. It also provides income to the
household and food to the consumer before harvesting of other long season crops such as
October at altitudes between 600-2000 meters above sea level. Bean varieties have
different attributes which determine their attractiveness to consumers. These attributes
are heterogeneous, making each variety distinct. Wortmann et al. (1998) classified
common bean varieties into nine major classes according to color and size as follows:
1. Pure large reds. 2. Medium. 3. Small reds. 4. Red mottled. 5. Purple.
6. Yellow /tans. 7. Cream. 8. Navy/white. 9. Black.
In Kenya, the annual bean production in the period between 2005 and 2009 was
403,604 metric tons worth about US$ 199,743,000 (FAO, 2011) with an annual per
capita consumption of 14 kg to 66 kg (Spilsbury et aI., 2004; Rubyogo et aI., 2007). This
is an indication that bean trading can contribute towards injecting 80-90 billion Kenya
Shillings into the Gross Domestic Product, thus boosting the realization of Vision 2030
(GoK, 2007). However, the amount of bean produced in Kenya is not sufficient to meet
domestic needs. According to Kibiego et al. (2003) and Mauyo et al. (2010), the
unrecorded annual bean imports from Uganda are estimated to be 9,300 MT while
recorded imports are 1,700 MT. Katungi et al. (2009) places imports at 14,256 MT. The
deficit is expected to increase given the increasing population and urbanization (Kibiego
et aI.,2003). The deficit is an indication of local market failure to stimulate production.
Consumer's choice of bean type is influenced by among others, the food dishes to
be made such as; mixture of beans and maize popularly refered to as githeri in Kenya,
Ngata in Malawi, Kande in Tanzania. Bean sauce is another dish which is served with
accompaniments such as rice and chapati, a common pancake in East Africa. Animal
protein is expensive and has been attributed to negative health implications such as
potassium levels in legumes decreases urinary calcium (Massey, 2003). Nutrition content
of beans isabout 60% carbohydrates, two-thirds of which is in the form of starch, 22% to
25% protein and very low fat content. According to Schwartz & Corrales (1989) beans
contribute one-sixth of total per capita protein intake in the East African highlands.
Compared to cereals, they are a valuable source of protein that supplements well, the low
quality proteins in cereal and are highly valued as staple food by consumers (Tapia, 1985;
EI-Tabey, 1992; Ruiz de Londono et al., 2000; Murray, 2010). Nutrition benefits and low
cost make common beans the alternative food choice to animal protein.
Common bean plays an important role in the soil fertility stabilization through
biological nitrogen fixation (Katungi et al., 2009). Rhizobium bacteria in bean nodules
supply the plant with fixed nitrogen, in form of ammonia, and get carbohydrates in
return. This factor is fundamental in mitigation of greenhouse gas emission. Excessive
use of fertilizers results in emission ofclimate change causing gas known as nitrous oxide
(N20) (Smith, 2008). Common bean therefore enhances sustainability of agricultural
production systems.
The important and diverse roles played by common bean, in the farming systems
and in consumer diets, makes it an ideal crop for achieving Millennium Development
Goal (MDG) one, five, six and seven; poverty and hunger eradication, improved maternal
health, low major disease incidences and sustainable environment.
Previous research on beans concentrated on agronomic aspects resulting in high
yielding bean varieties with little attention given to marketing aspects. As a result little is
known about consumer preference for the bean varieties. Market demand, which reflects
Mishili et al. (2009) consumers are the beginning of the value chain from which the flow
of information about food preference moves back to retailers, manufacturers, farmers and
scientific laboratories. Anti-nutritional aspects of beans such as flatulence, long cooking
time may reduce their consumption (AP A, 2010). Information on bean varieties/attribute
preference is therefore fundamental in enhancing utilization, development of bean market
and subsequently in stimulating production. It is also important considering the resources
and efforts which are directed towards development of alterriative varieties and
characteristics of agricultural commodities (Espinosa & Goodwin, 1991).
1.3 Problem statement
There is a wide range of bean varieties with different physical and sensory
properties. As a cheap and beneficial source of protein compared to other animal products
such as meat, there is need to know the effect of these different bean properties on choice
of beans varieties by consumers in order to enhance utilization. There has been extensive
research conducted on dry beans in relation to agronomic aspects which has resulted in
high yielding bean varieties that withstand biotic and abiotic stresses. Despite this, the old
improved low yielding varieties dominate market share and the country is bean deficit.
There is therefore a knowledge gap on what consumers prefer in the old beans that is
probably not in the recently released bean varieties whose agronomic properties have
been improved. Lack of consumer preference analysis, could be a factor that limits
utilization, subsequently low production of newly released varieties. The problem
therefore is insufficient information on the factors that determine choice of beans by
1.4 Overall objective
The overall objective of this study was to evaluate the consumers' preference in
common bean varieties and their willingness to pay for them.
1.4.1 Specific objectives
1. Evaluate the consumer preferred bean varieties in the market for attribute ranking.
2. Evaluate attributes that influence consumer preference for common bean varieties.
3. Evaluate consumer willingness to pay for preferred attributes in common bean
varieties.
1.5 Hypotheses
The study hypothesized that;
• There is no significant difference in consumer preference for different common
bean varieties.
• Consumer preference in attributes of different bean varieties is not significantly
different.
• Consumers' preference in bean attributes does not significantly influence their
willingness to pay for beans.
1.6 Significance of the study
Despite the many bean varieties that have been developed, the old improved bean
varieties continue to be popular with consumers. The study was important in establishing
the sensory attributes that made consumers prefer some bean varieties. Information from
.
this study will provide insights to policy makers, government institutions and otherinstitutions incorporate the recommendations in bean improvement and breeding
programs, it is expected that bean value chain will become more vibrant following supply
of beans with consumer preferred attributes. This in return will increase utilization and
trading of beans, subsequently contributing towards income generation along the bean
value chain, a healthier population through increased bean consumption and contribute to
the country's realization of food self sufficiency through an increase in participation of
bean producers in the bean value chain. Lastly the findings of this study will contribute to
the existing knowledge of consumer behaviour and especially in attribute preference in
relation to bean choice knowledge gap. The findings will also be a base for further
research in the same or other fields.
1
.
7
Scope of the studyThe study focused on two value chain actors, (trader and consumer) from Thika
East and Thika West districts. The study concentrated on seven bean varieties, namely,
KAT X56 Gituru, KAT B9 (Red Haricot), KAT Bl Kayellow, GLP 2 Rosecoco, GLP 24 Canandian Wonder, GLP 585 Red Haricot and GLP 92 Mwitemania. All the selected
varieties were consumed in the study area as was established during an exploratory study
conducted in the study area in March 2012. It was therefore easy for consumers to
evaluate the beans since they were familiar with them.
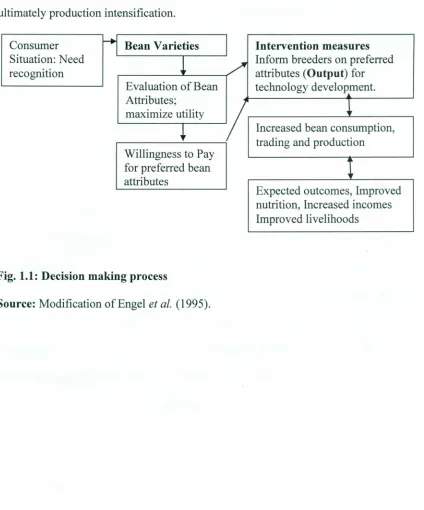
1.8 Conceptual framework
Food choice is comprised of decision making process and factors influencing
these decisions. The study was based on consumer theory, where decision process
involves evaluation of alternatives and subsequently making a choice, which is equated to
decision are the consumer needs and resources available. As Figure 1 shows, it was
hypothesized that consumers would evaluate characteristics of different bean varieties
and choose varieties with attributes that provided them with highest utility; the rank they
assigned an attribute depicted the level of utility it provided. Evaluation was based on
previous experience of the bean or information of available alternative varieties.
It was hypothesized that consumers made choices among the many varieties that
were available in the study area. They were therefore expected to assign levels to
varieties they preferred from one (1) in a descending order.
Attributes in the different varieties were expected to contribute to consumer
preference of a particular variety. The consumers were therefore expected to rank the
different attributes in beans. The way to measure consumer preference for attributes,
therefore, was by ranking attributes on a likert scale, 5-1: Exc.ellent to Very bad for each
variety a respondent consumed.
It was expected that consumers would pay a certain price for a variety depending on
the level of satisfaction provided by the attributes in the variety. By stating the amount
they were willing to pay for varieties, it was expected that consumers showed the value
they attached to attributes in those varieties. Hedonic price function was presented as:
Pj
=
aj + L~jZj + £j ...••...•....•.•..•...••••.•••.•••••••..•.. (1) Where: Pi=Bean price. Ui~j =Estimated coefficients.Z,
=
A vector of bean attributes. ci = Random error.Purchase would depend on individual differences, such as available resources and
motivatio~ consumer got after evaluating the attributes. Preferred attributes which was
This will lead to enhanced consumption, whose effect will be more trading in beans and
ultimately production intensification.
Consumer
H
Bean Varieties Intervention measuresSituation: Need
1
/
Inform breeders on preferredrecognition attributes (Output) for
Evaluation of Bean technology development.
Attributes;
'
"
,
/
~maximize utility
+
Increased bean consumptiontrading and production ,Willingness to Pay
for preferred bean
!
attributes
Expected outcomes, Improved
nutrition, Increased incomes
Improved livelihoods
Fig. 1.1: Decision making process
CHAPTER TWO
2.0 LITERATURE REVIEW
2.1 Introduction
The chapter consists of literature review that is relevant to this study. It covers
bean trading, improvement programs and bean attributes. It reviews methods of
measuring consumer preference and gives critical review of empirical studies on the
same. Overall, literature on bean preference concentrates more on varieties without
evaluating attributes of those varieties.
2.2 Socio economic characteristics
Socio economic characteristics such as age, income and gender playa crucial role
in acceptance of products in the market. They influence the amount of money spent on a
product and consumption patterns. A consumer may use enough amount of product
because he understands its nutritional value based on his level of education. On the other
hand a consumer may use less of a product because it is unaffordable (Mundua, 2010). In
Groote & Kimenju (2008) consumer preference for traits under study were influenced by
consumer socioeconomic and cultural background. Studies on socio economic
characteristics can inform traders and organizers of farmers' markets in coming up with
strategic locations for product outlets (Govindasamy, Italia, & Adelaja, 2002).
2.3 Bean marketing
Farmers grow beans not only for their own domestic consumption, but as a source
of income. Many farmers value beans as a fast-growing crop, which can be converted
easily and regularly to cash, especially during times of need. The availability of market
potential income and food security crop. It is therefore important to understand its
consumers. According to Munene (1993) beans are accepted by different communities in
Kenya going by the beans in markets across all counties in Kenya. This study showed a
composition of 30 bean varieties in 21 markets surveyed with variation in prices.
According to Kimani et al. (2005) and Korir et al. (2005) farmers in Northern Tanzania
and Eastern and Southwestern Uganda produced red-mottled beans for sale in Nairobi
and other urban centers in Kenya. This indicates a ready market for dry beans.
The average annual bean import in Kenya is 14,256 metric tons (Katungi et al.
2009) with 9,300 tons informally imported (Kibiego et al., 2003; Mauyo et al., 2010).
Approximately, 70 % of beans in Thika market are imported (Karanja D. personal
communication March 23 2012). The above studies show existence of preference for
particular bean varieties whose deficit is compensated through importation.
2.4 Bean Improvement Research in Kenya
A Grain Legume Project was established at KARl Thika in early seventies, to
cater for bean research and development. It released six bean varieties in 1980s namely
GLP-2 (Rose coco), GLP-24 (Canadian wonder), GLP-1004 (Mwezi moja), GLP-x.92
(Mwetemania), GLP-x.1127(a) (New Mwezi moja), GLP-585 (Red haricot), (Munene,
1993). Appendix 2 shows the GLPs. KARl Katumani released two varieties in 1987, Kat
Bean 1 and 2 (KEPHIS, 2011). By 2008, twenty one more improved varieties had been
released into the market by Universities and other research institutions. Research has
mainly been geared towards mitigating for biotic and abiotic constraints in order to
increase yield. This is evident in last column of variety release list in appendix two.
their preference regardless of agronomic constraints, (Santalla et aI., 1999; Buergelt et
aI.,2009; GoK a, 2010).
The Katumani (KAT) bean varieties are improved bean varieties developed by
Kenya Agricultural Research Institute (KARl), Katumani. The institute in partnership
with the International Centre for Tropical Agriculture (CIA T) has been promoting the
varieties in different parts of the country under Tropical Legume II project. The project
was initiated to support dissemination and promotion of the improved bean varieties in
Central, Rift Valley and Western Kenya (Karanja, et al.,2012). A similar promotion
program was introduced in Tanzania by CIA T in partnership with East and Central
African Bean Research Network (ECABREN). The program has resulted in an increase
of beans in Tanzania which are exported to Kenya (Katungi et al 2010).
2.5 Consumer preferences
Consumer preference is a tool that is used in marketing research to gauge
consumer satisfaction (utility maximization) and acceptance of a given commodity,
(willingness to pay for a particular commodity). It helps reveal an option that has the
greatest anticipated value among a number of options. Modeling and measuring
consumer preferences is therefore useful in designing of new or upgrading products and
services.
Consumers choose from the market goods that will satisfy their needs given the
amount of money available. According to Economides (2010) to get the best choice,
consumers undertake several steps; they analyze choices available to them given their
limited funds, for example, the different bean varieties that are sold in the market. Next
given to the good whose attribute combination offers maximum utility. When consumer
chooses one level of attribute against a similar one in a different variety in order to
maximize utility, a tradeoff occurs; marginal rate of substitution. An additional unit of
attribute X will increase level of satisfaction of a consumer by the marginal utility of the
attribute X. This study applies Stated Preference Technique by Pearmain et al. (1991) as
explained in Abley (2000), to estimate utility. The technique uses individual respondents'
statement about their preferences in a set of options to estimate utility. The final stage is
to get an optimal choice by combining analysis of the preferences with available choices.
For a long time technology development has been focused on quantity of
commodities, leaving out consumer preferences; an important component in the
marketing chain. Without good acceptability/preference characteristics, a new crop
variety will find no market, and thus be unprofitable to the producer (Luse, 1980). One
way of measuring consumer preferences is by employing Willingness to Pay (WTP)
technique. Willingness-to-Pay is defined as the maximum price that can be charged
without reducing the individual's welfare and utilization of the product. Empirical studies
have documented that some market segments are willing to pay a premium for food
products with differentiated attributes. In a study by Padilla et al., (2007) consumers were
willing to pay 585 pesos more for homemade marmalade with a certified quality label.
Mclennon, (2002) documented that consumers were willing to pay for non-meat biotech
food, compared to biotech meat products.
2.6 Bean attributes in relation to consumption
Consumers start their decision making with attribute comparison and then turn to
existing research literature on customer evaluation of alternatives prior to choice reveals
the crucial role of identifying the attributes affecting the customer's decision in order to
understand customer choice among alternatives. Food intake is determined by among
others, food availability and cost, preparation time, palatability, bulk, anti-nutritional
factors and digestibility (Kaul, 1987). These factors have not always received a due and
balanced consideration in research.
Beans are heterogeneous in varieties and attributes, which appeal to consumers in
different ways (Mbugua
et aI.,
1997; Katungiet aI.,
2010). Following sustainedpopularity of old bean varieties, evaluation of consumer preferences has become
necessary before development of new varieties, for the farmers to produce marketable
varieties (Munene, 1993; Katungi
et aI.,
2011; Gichangiet aI.,
2011). Bean attributeevaluation is important to establish positions these characteristics are given by consumers
during the purchase process, for effective bean grain improvement, development and
business establishment.
Beans are found in different sizes namely: small, medium and large sizes. One
way of differentiating beans in the market is by grain size. According to Gichangi
et aI.,
(2011) 69% farmers and 82% traders differentiate bean products by grain size in the
Central Rift Districts. According to Maryange
et al.
(2010) beans are classified small ifthere are 900 seeds per kg, medium; 600-899 seeds per kg and large if there are less than
600 seeds per kg. Katungi
et aI.,
(2010) classified beans in Kenya as follows: Small lessthan 25g, Medium 25-40g, Large more than 40g per 100 seeds. Individual bean grain
The decision to take the attribute of taste into account when defining acceptance
was based on numerous studies that indicated taste as the single largest determinant of
food choice, directing consumers to eating, regardless of constraints of production
(Spilsbury et ai., 2004). In Deodhar and Intodia (2002) study of traits in clarified butter
that influenced daily price, it was found that consumers were willing to pay a premium
for branded clarified butter over the non-branded. Consumers attached economic
significance to flavor. In a similar study for rice characteristic, done in Ghana by Anang
et al. (2011) aroma had economic significance. Beans have diverse taste ranging from
beany to 'sweet taste (APA, 2010). It is important to establish whether taste influences
consumers preference in common beans.
Beans need to be cooked for long to ensure Lectin; a protein found in lentils is
well cooked. If not well cooked, Lectin can cause allergic reactions in some consumers.
Cooking time has implications for the rural and urban poor, gender equity and
conservation of biodiversity. For decades, 90% of consumers in Brazil have been
consuming a combination of bean and rice meal daily. However consumption of beans
has decreased significantly due to lifestyle changes which leave consumers with little
time to prepare and cook raw beans (Canada, 2009). Fast cooking food commodities save
on time and fuel cost. Different bean varieties have different cooking time (Maryange et
al., 2010) which range from three hours for unsoaked beans in Kenya to 103,96,56 and
105 minutes for CAL 96, MCM 5001, white Haricot and Uganda K2 varieties in Uganda
respectively (Kim ani et ai., 2005). Reduction in cooking time cuts down fuel
consumption, in the process reducing environmental degradation and fuel cost (Diamant
Bean grain color is of great importance to some consumers such that producers
grow beans with particular color that is preferred in a particular area. In Maryange et al.
(2010) bean colors range from white all through the color spectrum to black; either plain
or speckled.
Beans contain oligosaccharide; 3-5 sugars bound together in a way that human
body cannot digest or absorb them. Bacteria in the intestines break and digest
oligosaccharides, producing gas in the process (flatulence). Flatulence can lead to
reduced consumption, a case in point is Brazil where there has been a steady decline in
pulse consumption due to health aspect related to flatulence effect of beans (Canada,
2009). Some beans have low flatulence effect such as the Manteca bean, grown in China
for centuries. This variety produces tannins in the seed coat that bind to calcium in the
intestines in ways that change the pH and chemistry of digested food enough to prevent
gas formation (American Bean Organization, 2008 ). Soya bean (medium sized purple
bean) grown in Northern Tanzania causes low flatulence, (Korir et aI., 2005).
Cooking quality refers to the cooked structure of the bean. The attribute takes into
account cooking time, density, hydration capacity, swelling capacity and whole grain
(Coelho et al., 2009). According to Coelho et al.(2009); Mwangwela in (Maryange etal.,
2010 ) there is notable varition of bean cooking quality in different genotypes, a clear
indication that the attribute is manifested diffently in the various varieties. Splitting and
mushing up of cooked beans is one of the undesirable cooking quality characteristics
2.7 Methods of measuring willingness to pay
To understand consumer behavior and relative importance of various attributes in
food purchase, various techniques have been applied (Kiesel & Villas-Boas, 2007).
Willingness to pay (WTP) techniques are devised to elicit people's monetary valuations
of costs and benefits for goods and services. They can be classified into two, revealed
preferences which can be derived from market data or experiments and stated preferences
derived from direct surveys or indirect surveys. Market data involves collection of
individual purchase data of a customer panel member or sales records from retail outlets.
The advantage of using this method is that real purchases are used instead of stated
purchase intentions. There is limitation in that it is not possible to estimate WTP for new
products or hypothetical products that are not yet in the market. In experiments, purchase
behavior is simulated by giving the subjects an amount of money and asking them to
spend on a specific selection of goods. It is not always possible to obtain the data
required in revealed preferences in order to estimate price-response function. For
example differentiated products have to be manufactured before they can be tested
experimentally. Practically, the expenditure and time needed to carry out experiments
make them less favored in product evaluations (Vo1ckner, 2006 ).
Stated preferences are methods of measuring WTP based on consumer statements.
They can be derived from direct surveys (contingent valuation) and indirect surveys
(choice modeling). Direct surveys can further be classified into - expert judgments and
customer survey. Indirect surveys comprise of conjoint and discrete choice analysis. In
indirect surveys customers are presented with product profiles with systematically varied
or not (Marbeau, 1987). In a study by Mennecke et aI., (2007) respodents were asked to
choose meat they liked from pictures of different beef cuts and combination of meat
origin, animal breeds, nutrition. One of the limitations of using indirect surveys is that the
customer must be willing to purchase the product as presented and at the given price
-status quo product, which is not realistic market behavior (Breidert, Hahsler, &Reutterer,
2006). Using a status quo product may not yield the correct WTP predictions due to
consumer heterogeneity; different participants might consider different products their
best alternatives.
Profiling is complex and difficult to present in some products. A profiling trial
done for this study yielded profiles which left out some of the attributes that had been
selected by consumers. Direct surveys require respondents to state how much they are
willing to pay for a specific product or bundle of attributes. The objective of direct survey
- contingent valuation methods is to provide the researcher with monetary valuations of
the target goods, whereas choice modeling methods target either monetary valuations or
preference order outcomes (Brown, 2003). Open-ended CV is a direct method asking the
respondents to state their maximum willingness to payor minimum willingness to accept
for a change in their utility compared to the status quo situation (Hanley, Maurato, &
Wright, 2001). In dichotomous-choice contingent valuation the respondents are instead
asked to choose whether they would accept or reject a fixed price for a certain product
(Koistinen, 2010). Some of the advantages of using direct surveys are that they are cost
effective and time efficient. They are flexible enough to include product combinations
and allow for individual level estimation. However the estimation might not give real
The approach has been applied in safety and environment related policy
evaluations (Breidert et aI., 2006).
It
has also been used to evaluate agriculturalcommodities such as organic food products (Boccaletti &Nardella, 2000; Gil, Graca, &
Sanchez, 2000).
It
was also used in rice evaluation and indigenous vegetables (Moser,Raffaelli, &Thilmany-Mcfadden, 2011). This study applied Stated Preference Technique
by Pearmain et al. (1991) as explained in Abley (2000) to estimate utility. The technique
uses individual respondents' statement about their preferences in a set of options to
estimate utility. Direct survey with open ended questions was used for data collection, to
elicit more information by giving respondents a chance to make independent choices,
unlike the dichotomous choice questions which limit respondent choice to status quo or
profiled products (Breidert et al., 2006).
2.8 Analytical methods to determine willingness to pay.
Two main approaches to measure consumer preferences are hedonic and discrete
choice models. Hedonic emanated from Lancaster, an American researcher, who came up
with Lancaster preference theory after expounding on the consumer theory of classical
economics on utility maximization (Lancaster 1966). From the theory he argued that
consumer's choice of a good was for satisfaction derived not from the good as a whole
but from the attributes of the good. Within the context of Lancaster preference theory, an
American economist Rosen (1974) introduced the first equilibrium model of market
supply and demand based on product characteristics. The concept underlying hedonic
model is that the price of a heterogeneous good is a function of the attributes of that good
As explained in Picard (2010) discrete models such as logit and probit among
others identify importance of characteristics in commodity purchase decision but do not
explain the commodity price. Multinomial logit model is a discrete model that has been
used in willingness to pay studies. Its estimation procedure is the maximum likelihood
(MLE). It helps identify the important product characteristics in a purchase decision. It
however does not explain product prices but instead examines the variables that
determine whether a consumer makes a purchase or not. Random Utility Model which is
also a discrete model takes the sale prices as representative of market price available to
all consumers and not necessarily representative of characteristics of a product
(Palmquist, 2003). Repeat Sales Price Indexes analyze data of commodities that have
been sold at least twice, they show percentage growth in sale prices over time. They
however do not provide information on value of individual commodity characteristics or
on price levels. The hedonic regression on the other hand reveals the expected value of a
product given the characteristics and the expected contribution of each of the
characteristics to that value. The specification for hedonic model is the linear regression
model and the estimation procedure is the ordinary least squares (OLS). The concept has
been applied in many studies ranging from housing and automobile markets to
agricultural products.
Von Oppen (1978) was the first to define plant breeding goals by applying
hedonic estimation. He developed a preference index to evaluate the acceptance of new
food grains.
In
the study he indicated that evident and cryptic characteristics of a productare related. This means that some cryptic characteristics can be inferred from evident
necessary to evaluate individual characteristic instead of inferring. The notion that red or
yellow apples are sweet while green apples are sour as expressed by (Portugal, 2004),
may not apply in the case of beans.
Abansi et al. (1990) used hedonic pricing model to evaluate consumer preference
for rice quality. The results showed that consumers in Philippines were willing to pay
more for quality characteristics in rice. The study categorized consumers by location;
urban and rural. The findings of the study showed that both groups were price responsive
to changes in quality characteristics. However urban consumers attached higher value to
quality characteristics than rural group. It is therefore important to evaluate preference in
both urban and rural setting to establish whether there is any variation.
In
a study of winemarket, Schamel, Gabbert, & Witzke (1998) introduced a new dimension of a hedonic
analysis; regionl reputation. U.S. consumers preferred Chardonnay (white wine) to
Cabernet Sauvignon (red wine). This adds to the observation made above that region
may influence consumer preference of a product.
Dalton (2003) used hedonic price model to evalute consumption attributes
perceived important by rice consumers in West Africa. The study was to derive economic
value of upland rice and subsequently advice breeders on consumption traits to be
incorporated in the rice seed, which were not considered in the breeding programmes.
Results showed grain elongation and swelling were important in relation to the amount of
rice prepared and the amount that can effectively feed a household. The swelling
characteristic was perceived to increase in volume thus generating more food with less
grain. The value for the characteristic was 4.5 while for tenderness was 4.3 on the Likert
factor for promoting a new variety for official release. However this trait was not
significant in determining willingness to pay. This means production traits do not
necessarily influence consumer choice or preference and thus do not necessarily have to
be included in attribute evaluation for consumer preference. As stated by Dalton (2003)
agricultural agencies should include a broader set of characteristics besides production
during product evaluations, in order to increase producer and consumer surplus in
agrarian economies.
Langyintuo et al. (2004) used hedonic pricing model to evaluate effect of cowpea
characteristics on prices in Cameroon and Ghana. Results showed that seasonality, grain
size, color and insect damage level explained a substantial price variation in both Ghana
and Cameroon.
In
a study in India and Nepal on Ricebean characteristics that influenceprice, relevant characteristics choosen after literature review were moisture content,
Protein, fat, crude fibre, carbohydrates, ash, seed weight, foreign matter, water uptake
capacity, swelling capacity, and color diversity. Mishili et al. (2009) conducted a study in
Tanzania where they applied hedonic price model to analyse consumer preference for
bean grain quality characteristics. The i~vestigated variables included size of bean grains,
grain damage by bruchids, percentage of discolored grain and percentage of mix. Results
showed that consumers placed significant importance on cooking time. All the above
mentioned studies show that hedonic price model is appropriate in evaluating consumer
preference of agricultural products.
In
Kenya, Chelangat (2005) conducted a research to explain pricing of three beanvarieties sold in Nakuru Municipal Market using a hedonic price model. The study
change in market price respectively. Flatulence, color and expansion were significant at
95% level of confidence. The study concentrated on consumers based in an urban set up
who depend on what is offered in the market and not what they were able to produce or
access from local producers as is the case with consumers in rural set up, where
production and consumption go hand in hand. Preference in rural set up may vary given
that products are easily acquired (Edmeades 2005).
2.9 Critical review of consumer preference studies.
Most of the research efforts have focused on demand of common beans in the
market and the results are therefore derived from the traders' perspective and not from
the consumers' point of view. Some of these studies were done by Munene (1993),
Mbugua
et al.
(2005), Katungiet al.
(2010) and Gichangiet al
(2011). They alldocumented GLPs as the most popular varieties. In Munene (1993) the study was
inclined more to trading than consumers' perspective. Results showed there was price
variation between varieties but the reason for variation was not explained. A consumer
preference study based on evaluation of attributes would probably have given the reason
for price variation. The study by Mbugua
et
al. (2005) was a farmer participatory, wheregrain quality characteristics both for consumption and production were evaluated. The
results were not clear for example GLP-2 variety was among the best ranked varieties
with an average score of 4.7. It was not explained whether the score was due to
production or consumption attributes of the variety. The study by Katungi
et al.
(2010)indicated the preferred attributes were short cooking. time, color, seed size. However,
information from this study is derived from producers and traders perspective, leaving
Gichangi et at (2011) in Central Rift Districts of Kenya, it was established that GLP
dominated the market. The results were derived from data collected from wholesale and
retail traders who indicated they preferred a differentiated crop either by color or size.
One of the recommendations was that consumer preferences should be evaluated before
embarking on introduction and promotion of market oriented beans.
In the study by Korir et at. (2005) on bean varietal preference in East African
markets, results showed that Maharage soya was the most preferred variety in Tanzania
while Nyayo was ranked number one in Kenya. This study did not compare attributes for
preference in each variety but gave overall varietal rank in different regions. It would
have been of great value to the breeders if the attributes in the preferred varieties were
known.
In a consumer preference study conducted by Laswai, Shayo, & Kundi (2008) on
sorghum and millet, local tradition varieties were more preferred than improved varieties.
The improved varieties had most of the desired attributes in relation to production such as
high yields. The study showed that there was no advocacy for production and utilization
of local varieties but they were dominating at the time of the study. One of the stated
reasons for their popularity was that they were more palatable than improved varieties.
The study did not elaborate what characterized palatability, information that could have
been important for future grain improvement.
Groote & Kimenju (2008) conducted a consumer preference study for color and
nutritional quality in maize in Nairobi, using dichotomus contingent valuation. Results
showed that there was a strong preference for white maize among urban consumers who
of marketing outlet, income and cultural background played a role in preference of the
two maize types. The study however did not address intrinsic attributes of the two types
of maize that influenced preference which would have greatly contributed in efforts to
CHAPTER THREE
3.0 MATERIALS AND METHODS
3.1 Introduction
The section presents information on the tools used for the study and justification
thereof. It contains a brief of the study area and the technique used to arrive at the
sample. It also gives details on how data was collected and methods used for analysis.
3.2 Location of study
The study was done in Kiambu County. Thika West district was selected because
it is an urban setting while Thika East district and Kakuzi represented rural setting. Two
Thika Districts were selected because of diverse socio-economic orientation. The main
Thika town is an industrial town and population is therefore composed of consumers
from different backgrounds who are expected to have diverse preferences. Majority of
Thika residents purchase beans for consumption making it ideal for a consumer
preference study. It is also centrally located in terms of infrastructure among major bean
growing counties of Meru, Embu, Kirinyaga and the bean deficit areas in the tea zones of
Muranga and Kiambu counties. The main economic activity in the rural area is fanning.
The main market, Jamhuri, is a key outlet for both local and imported beans which means
there are many bean varieties. The main market actors are wholesalers and retailers who
supply beans to the study area and other county markets.
In the year 2010 an average of 8,300 hectares out of the total 44,615 hectares
arable land in Thika was allocated to bean production. This produced, approximately
70,650 bags of 90kg with an estimated value of Kshs. 364.2 million (GoK 201Qa).
Jamhuri market which has 153 bean traders and Madaraka market with 63 bean traders.
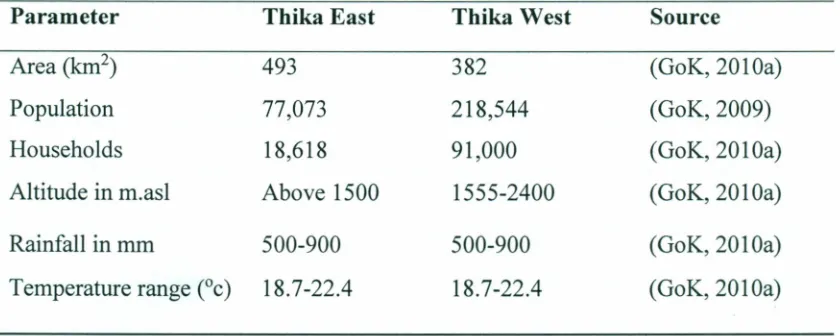
Annual per capita consumption was high at 60 kilograms. Table 3.1 presents a
summarized description of the study area.
Table 3.1: Description of study area
Parameter Thika East Thika West Source
Area (krrr') 493 382 (OoK,2010a)
Population 77,073 218,544 (OoK,2009)
Households 18,618 91,000 (OoK,2010a)
Altitude in m.asl Above 1500 1555-2400 (OoK,201Oa)
Flainfall inmm 500-900 500-900 (OoK,2010a)
Temperature range (Oc) 18.7-22.4 18.7-22.4 (OoK,2010a)
3.3 Sampling technique
Since the proportion of bean consumers in the study area was unknown,
estimation was done based on the bean consumption in the country and the per capita
bean consumption in the study area. Estimation was done as follows; Bean consumption
in Kenya in 2009 was 406,970 metric tons. Assuming annual per capita bean
consumption was 60 kg (Broughton et al., 2003; OoK, 2010b) and given that country
population was 40 million, total number of bean consumers was approximately 6,782,833
people. This was 16.95% (0.169) of the whole population.
The required sample was calculated using formula developed by Cochran (1963) and
explained in Israel (1992).
ZZPq
n
=
-z-
(2)e
p
=
estimated proportion of bean consumers in the population.q=
1 -
p. e=
desired level of precision 5% (standard value of 0.05).Calculation of consumer sample size was therefore:
n
=
3.8416 x 0.169(1-0.169)/0.0025=
216.Consumers were selected from all the six divisions in the two districts where a total of
216 people were interviewed. Research area was grouped into ten areas comprising of
both households and workplaces. Three areas were in the municipality; Makongeni 25,
Majengo 29, Thika district and Municipal offices 15. Two areas in Juja: Muchatha (20)
and Gacororo (20). Two areas in Gatuanyaga: Gatuanyaga and Munyu (22) Ngoliba:
Ngoliba and Mukawa (20). Kakuzi: Ithanga (22), Kakuzi (23) Mitumbiri: Thangira (20).
The study included both urban and rural areas, to eliminate possible bias of results that
could be attributed to easy access of beans in the rural areas where production takes
place. Thika town and surrounding estates such as Makongeni, Majengo, Juja and
government offices within Thika municipality were classified as urban while villages in
Gatuanyaga, Ngoliba, Kakuzi, and Mitumbiri were classified as rural. Four
questionnaires were incomplete and could not be used for analysis. The analyzed data
was therefore from 212 questionnaires.
Few markets were included in the study to gauge the preferred bean varieties and
magnitude of transactions. Identification of the markets with more than 14 bean traders
was done with the help of Divisional Agricultural Extension Officers and municipal
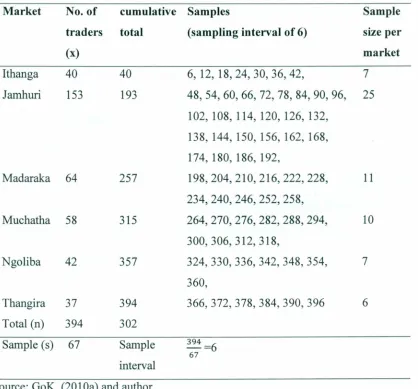
council staff and cereal traders' group officials in the relevant areas. A total of 67 out of
394 bean traders were interviewed for this study. 394 traders were approximately 4.6% of
follows; Jamhuri 25, Madaraka 11, Muchatha 10, Ithanga 7 Ngoliba 7 and Thangira 6.
Selection of traders was proportional to the total number of bean traders in chosen
markets as table 3.2 shows. Traders sample size was calculated using the Chochran
(1963) formula.
Table 3.2: Probability proportional to sizesampling for bean traders
Market No. of cumulative Samples Sample
traders total (sampling interval of 6) size per
(x) market
Ithanga 40 40 6,12,18,24,30,36,42, 7
Jamhuri 153 193 48,54,60,66,72,78,84,90,96, 25
102, 108, 114, 120, 126, 132,
138,144,150,156,162,168,
174, 180, 186, 192,
Madaraka 64 257 198,204,210,216,222,228, 11
234,240,246,252,258,
Muchatha 58 315 264,270,276,282,288,294, 10
300,306,312,318,
Ngoliba 42 357 324,330,336,342,348,354, 7
360,
Thangira 37 394 366,372,378,384,390,396 6
Total (n) 394 302
Sample (s) 67 Sample 394 =6
67 interval
Source: GoK (201 Oa) and author.
As depicted in table 3.2, to get required samples per market, 394 which was the
interval of six. This was successively added and market sample was given when the
cumulative total for each market was reached.
3.4 Research instrument and data collection
An exploratory study was conducted in Thika town where people were asked
which bean varities they liked. A similar study was conducted in Gatuanyaga and
Ngoliba areas where farmer groups were asked which bean varieties they liked. It was
established the popular bean varieties were Kat X 56 Gituru, KAT B9 (Red Haricot),
KAT Bl Kayellow, Gathika GLP 2 Rosecoco, GLP 24-Canandian Wonder, and GLP 585
Red Haricot. GLP 92 Mwitemania was not very popular. It was also established that
consumers considered such attributes as color, grain size, taste, cooking time, cooking
quality, keeping quality, flatulence, and price when purchasing beans. The seven bean
varieties were named with the help of KARl, Thika and Katumani researchers. It was
further established that the varieties fell into two clasifications based on the year of
release into the market. The classifications were Old Improved Bean varieties
(1982-1984) and New Improved Bean varieties (1989 to date). Appendix 2 shows details of
different varieties and the year the varieties were released. The GLPs used in this study
fell in the Old Improved Bean varieties while KA Ts fell in the New Improved Bean
varieties. Each variety was packaged in transparent polythene bags which were presented
to consumers by the enumerators for attribute evaluation in the main study. The seven
No Variety Local Picture Name
Morphological Characteristics
1 GLP2
Calima
Rosecoco,N
yayo
Medium red mottled
2 GLP 585 Wairimu
Red Haricot
Small red
3 GLP92 Mwitemania Medium cream
Pinto Sugar, mottled Pinto
Carioca
4 GLP24 Gituru Slim dark red kidney
Canadian shaped
Wonder
5 KAT Gituru
X56Canadia
n Wonder
Rounded large dark purple kidney shaped
6 KAT B9 Gacuma
Red Haricot
Medium Red
7 KAT Bl Katheka,Ka
yellow
Medium
yellow/green round
shaped
Plate 1: Seven bean varieties used in the study
A semi structured questionnaire was personally administered to consumers in
order to collect primary data. Administration of the questionnaire was done with the help
of research officers from KARl, Thika and Agricultural Extension Officers in the
different divisions of study area. Secondary data was collected from District Agricultural
Offices in Thika East and West Districts, KARl offices and from existing literature.
Information on socio-economic characteristics of respondents, their bean variety and
attribute preferences was collected for analysis. The required data was both descriptive
and diagnostic, in nature, thus fitting a survey design; the study helped establish popular
attributes of beans and frequency with which they were mentioned as preferred attributes
by consumers. It further helped evaluate influence of attributes on consumer preference
for bean varieties. The study further gauged the amount of money respondents were
willing to pay for varieties with preferred attributes.
3.5 Measurement of variables and data analysis
According to Mutai (2000) measurement is a procedure that assigns numerals to
events, characteristics or responses. Measurement of data facilitates it's analysis in order
to obtain statistical results capable of interpretation. Excel and the Statistical Package for
Social Sciences (SPSS) Version 16.0 were used to generate descriptive statistics
(frequencies, means, standard deviations, percentages, t-test values and skewness).
Appendix 3 presents information on source of data, method used for data analysis
and the expected results for this study. Socio-economic factors of the respondents playa
include them in the study to help establish whether there are any differences among the
consumer groups.
Bean consumers were asked to point out the varieties they consumed, they were
then asked to rate those varieties in order of preference, using a 1-7 (qualitative) scale;
one being the most preferred and seven the least preferred variety. This was to ensure the
rates given were as a result of consumer's experience with the beans. A chi square test
was used to test the hypothesis that there was no significant difference in consumer
preference of different common bean varieties. Respondents then evaluated eight
attributes in the seven bean varieties by assigning a rank to each attribute at 1-5 likert
scale; one being "very bad" and five "excellent" (qualitative). Description of variables is
presented in Table 3.3. After evaluating the attributes, consumers were asked open ended
questions on how much it cost them to purchase each of the varieties they consumed
(quantitative). They were further asked how much they were willing to pay per kilo of
each variety based on the evaluation they had done (quantitative). A chi square test was
used to test the hypothesis that consumer preference in attributes of different bean
varieties was not significantly different.
Descriptive statistics were computed on the sample data. The statistics were,
~ ~
sample size (n) and the proportions of participants in each response category (p I, P2...
~
Pk) where k represents the number of response categories. The test statistic for the
~
""
(0 -
E
)2
X=L
E (3)
Where O=observed frequency and E=expected frequency in each of the response
categories. The test compared the observed frequencies in a response category with the
frequencies to be expected if the null hypothesis were true. If the null hypothesis was
true, the observed and expected frequencies would be close in value and the x? statistic
would be close to zero. If the null hypothesis was false, the y}would be large.
Data on willingness to pay and attribute evaluation was used to fit a hedonic price
model. The model was used to estimate the relationship between willingness to pay and
the value consumers assigned to attributes in each variety. The model was tested for
goodness of fit using R-squared, analysis of residuals. Overall statistical significance was
checked with an F-test followed by t-test of individual parameters. The regressionoutputs
are summarized in Appendix 11 (1-7).The decision rule is that, "if the t-value of the regression
coefficient associated with an independentvariable is greater than,the absolute criticalt-value then
the independent variable is significantat the given level of confidence".
3.5.1 Hedonic model specification
A multiple regression was done using a hedonic price model, introduced by Rosen
(1974), to check the significance of bean attributes in predicting the price consumers
were willing to pay for bean varieties. In the model the mean price of an ith variety would
be what consumers were willing to pay. It would be a function of the attributes in the
variety. The general form of hedonic pricing theory as specified by Rosen (1974) is:
Pi
=
Ui+
L~iZi+
£i (4)Z, = A vector of bean attributes. Ei= Random error.
The partial derivative of Pi with respect to Zr,
a
Pi /a
Z, is referred to as the marginalimplicit price. It represents the amount consumers are willing to pay for a change in unit
of attributes.
This is taken as the value consumers place on a particular variety. This value comes about
by weighting the different attributes of the variety in relation to the utility they provide.
In the bean preference analysis, price consumers were willing to pay was regressed on
eight bean attributes namely; Color, Grain size, Price, Taste, Cooking time, Flatulence,
Cooking quality and Keeping quality. Likert scale 1 - 5 was used to rank preference for
attributes where five (excellent) was the highest rank and one (very bad) least rank
allocated to an attribute. Attributes and ranks used were as described in Table 3.3. The
linear model for each variety used in the study would take the form:
Pi
=
~o + L~iZi + £i (5)Where Pi= price(WTP) for bean variety i
~o = Constant L~i = implicit value of characteristic Z in variety i
Zi = quantity of the characteristic in variety i £i = Stochastic error term
Specification of the model into estimable form for this study was as follows for all
varieties:
Pi =fJo+fJlcoli+fJ2grzi+fJ3prci+fJ4tasti+fJ5ckdn+fJ6ckqlti+fJ7kpqlti+fJ~tui+ei
(6)Where;Pi =Price (Kshs) consumers were willing to pay for a kilo of common bean
variety i.
fJo
= Constant; this was thePi
intercept (value ofPi
when Zi = 0). It gaveestimated coefficients of bean attributes. eol, grz, pre, tast, ektm, ekqlt, kpqIt, fltu = bean
attributes as defined in Table 3.3
e
=
Stochastic error term; the difference between observed value and predicted value ofdependent variable. Regression analysis calculates coefficients in a way that minimizes
sum of squared errors between actual values and predicted values of beans.
:Ee/=:E
(S]-S2)2 (7)S]= the stated willingness to pay price. S2 = estimated or predicted value of beans.
Coefficients were given by :~2
=
a~j / agrzj
(8)pi
This means the percentage change in Pi brought about by a change in
grz,
holding allother regressors constant. If ~2 =4, then a 0.1 unit increase in grz, leads to a 0.4 percent
increase inPi.
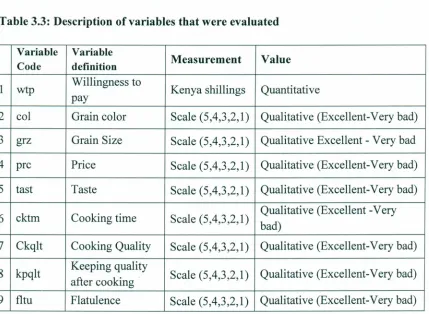
Table 3.3: Description of variables that were evaluated
Variable Variable
Measurement Value Code definition
1 wtp Willingness to Kenya shillings Quantitative pay
2 col Grain color Scale (5,4,3,2,1) Qualitative (Excellent-Very bad)
3 grz Grain Size Scale (5,4,3,2,1) Qualitative Excellent - Very bad
4 prc Price Scale (5,4,3,2,1) Qualitative (Excellent-Very bad)
5 tast Taste Scale (5,4,3,2,1) Qualitative (Excellent-Very bad)
6 cktm Cooking time Scale (5,4,3,2,1) Qualitative (Excellent -Very bad)
7 Ckqlt Cooking Quality Scale (5,4,3,2,1) Qualitative (Excellent-Very bad)
8 kpqlt Keeping quality Scale (5,4,3,2,1) Qualitative (Excellent-Very bad) after cooking
NB: (5) Excellent (4) Good (3) Fair (2) Bad (1) Very bad
This study adopted linear functional form in regression analysis. To ensure
regression assumptions were satisfied, the data was tested for normality,
heteroscedasticity and collinearity.
One of the assumptions of linear regression analysis is that the residuals are
normally distributed. Estimation of coefficients requires that the errors are identically and
independently distributed this ensures the p-values for the t-tests are valid. As a result, all
variables were checked for distribution normality using histograms of the fitted model.
The histograms showed the results were confined within the normal distribution curve
and took the bell shape.
The regression data was tested for multicollinearity between the independent
variables, by running a tolerance and Variance Inflation Factor (VIF) assessment.
Tolerance =
1 -
R2j, (9)VIF= tOle!ance (10)
Where:
R2j is the coefficient of determination of a regression of explanatory j on all the other
explanatory variables. In other words tolerance is an indication of the percent of variance
in the predictor that cannot be accounted for by the other predictors, hence very small
values indicate that a predictor is redundant, and values that are less than .10 may merit
further investigation. A tolerance value less than 0.10 and VIF value of 10 and above
indicates a multicollinearity problem. According to Nzau (2003) cited in Kieti (2005), a
correlation coefficient more than or equal to 0.70 is an indication of a strong explanatory