Scholarship@Western
Scholarship@Western
Electronic Thesis and Dissertation Repository
7-8-2013 12:00 AM
Modeling and Optimization of Next-Generation Wireless Access
Modeling and Optimization of Next-Generation Wireless Access
Networks
Networks
Maysam Mirahmadi
The University of Western Ontario
Supervisor
Dr. Abdalllah Shami
The University of Western Ontario
Graduate Program in Electrical and Computer Engineering
A thesis submitted in partial fulfillment of the requirements for the degree in Doctor of Philosophy
© Maysam Mirahmadi 2013
Follow this and additional works at: https://ir.lib.uwo.ca/etd
Part of the Systems and Communications Commons
Recommended Citation Recommended Citation
Mirahmadi, Maysam, "Modeling and Optimization of Next-Generation Wireless Access Networks" (2013). Electronic Thesis and Dissertation Repository. 1349.
https://ir.lib.uwo.ca/etd/1349
This Dissertation/Thesis is brought to you for free and open access by Scholarship@Western. It has been accepted for inclusion in Electronic Thesis and Dissertation Repository by an authorized administrator of
Next-Generation Wireless Access
Networks
(Thesis format: Integrated-Article)
by
Maysam Mirahmadi
Graduate Program in
Electrical and Computer Engineering Dept. of Electrical and Computer Engineering
A thesis submitted in partial fulfillment of the requirements for the degree of
Doctor of Philosophy
School of Graduate and Postdoctoral Studies The University of Western Ontario
London, Ontario, Canada
c
T
HE ultimate goal of the next generation access networks is to provide all net-work users, whether they are fixed or mobile, indoor or outdoor, with high data rate connectivity, while ensuring a high quality of service. In order to realizethis ambitious goal, delay, jitter, error rate and packet loss should be minimized: a
goal that can only be achieved through integrating different technologies, including
passive optical networks, 4th generation wireless networks, and femtocells, among
others.
This thesis focuses on medium access control and physical layers of future
net-works. In this regard, the first part of this thesis discusses techniques to improve
the end-to-end quality of service in hybrid optical-wireless networks. In these hybrid
networks, users are connected to a wireless base station that relays their data to the core network through an optical connection. Hence, by integrating wireless and
op-tical parts of these networks, a smart scheduler can predict the incoming traffic to
the optical network. The prediction data generated herein is then used to propose a
traffic-aware dynamic bandwidth assignment algorithm for reducing the end-to-end
delay.
The second part of this thesis addresses the challenging problem of interference
management in a two-tier macrocell/femtocell network. A high quality, high speed
connection for indoor users is ensured only if the network has a high signal to noise
ratio. A requirement that can be fulfilled with using femtocells in cellular networks. However, since femtocells generate harmful interference to macrocell users in
prox-imity of them, careful analysis and realistic models should be developed to manage
the introduced interference. Thus, a realistic model for femtocell interference outside
suburban houses is proposed and several performance measures, e.g., signal to
inter-ference and noise ratio and outage probability are derived mathematically for further
analysis.
The quality of service of cellular networks can be degraded by several factors.
For example, in industrial environments, simultaneous fading and strong impulsive
most widely used technology in next-generation networks, and is very susceptible to
impulsive noise, especially in fading channels. Mathematical analysis proves that the
proposed method can effectively mitigate the degradation caused by impulsive noise
and significantly improve signal to interference and noise ratio and bit error rate, even
in frequency-selective fading channels.
Keywords: Passive Optical Network, Hybrid Wireless-Optical, Dynamic
Band-width Assignment, Orthogonal Frequency Multiplexing, Interference Management,
Femtocell, Building Architecture Model, Impulsive Noise Mitigation, Time-Domain
Interleaver.
First and foremost, I would like to express my sincere gratitude to my supervisors,
Dr. Abdallah Shami and Dr. Arafat Al-Dweik, whom without their wise advice, consistent support and insightful guidance none of the works reported in this thesis
would have been possible.
I would also like to thank my examiners: Dr. Serguei Primak, Dr. Vijay Parsa,
Dr. Michael Bauer and Dr. Pin-Han Ho for taking the time to review and examine
my thesis, and also for their valuable comments.
Special thanks goes to my dear friends at the networking and communications
lab: Dr. Dan Dechene, Dr. Dan Wallace, Oscar Filio, Elena Uchiteleva, Karim
Hammad, Mohamad Kalil, Mohammad Abusharkh, Manar Jamal, Aidin Rayhani
Masouleh, Dr. Andrew Roberts, Dr. Abdessameud Abdelkader, Dr. Abdou Ahmed, Ayman Alghamdi, Mahadevan Balakrishnan, Elham Dolatabadi, Siamack Ghadimi,
Sahar Javaher Haghighi, Jamil Hussain, Jason Liu, Dr. Marco Luccini, Khalim
Meerja, Jay Nadeau, Abdulfattah Noorwali and Tomasz Rybak, among others.
I am grateful to the staff at the Department of Electrical and Computer
Engi-neering, specially Sandra Vilovski and Chris Marriott who helped me along the way
in numerous occasions.
My sincere thanks also belongs to my dear friends: Mohammad, Osam, Vahid,
Omid, Seyed Mohammad, Ali, Hossein, Vali, Mahdi, Amirhossein, Ali, Iman, Maysam,
Ghodsieh, Maliheh, Nasrin, Samar, Mahdieh and all the members of our gatherings. You have been an essential part of my life in the past few years.
I am thankful to my kind parents and sisters who mean a lot to me. My
parents provided me unconditional care and support since my childhood, and I am
deeply indebted to them and love them from the bottom of my heart.
Last but by no means least, I would like to thank my dearest wife, Mahta, for
her continuous love, encouragement, and patience in all these years. Mahta, you were,
are and will be my sole source of happiness and joy and I am grateful for that.
Abstract . . . ii
Acknowledgements . . . iv
Dedication . . . v
Table of Contents . . . vi
List of Tables . . . x
List of Figures . . . xi
Acronyms . . . xiii
1 Introduction . . . 1
1.1 Thesis Outline . . . 4
1.2 Contributions of the Thesis . . . 5
1.2.1 Improving quality of service (QoS) of hybrid optical-wireless networks . . . 5
1.2.2 Modeling the interference caused by femtocells in pre-planned wireless access networks . . . 5
1.2.3 Improving the bit error rate performance of OFDM systems in frequency-selective fading channels in presence of the impulsive noise . . . 5
I
Improving Quality of Service in Hybrid Optical Wireless
Network
8
2 Improving the Quality of Service of Hybrid Optical Wireless Net-works via a Novel Traffic-Aware Dynamic Bandwidth Assignment Algorithm . . . 92.1 Introduction . . . 9
2.2 System Model . . . 11
2.2.1 Quality of service in hybrid wireless-optical networks . . . 12
2.3 Literature Review . . . 15
2.5 Implementing Prediction Mechanism in DBA Algorithms . . . 19
2.5.1 Predicting incoming traffic . . . 20
2.5.2 Employing predictions in DBA algorithms . . . 24
2.6 Traffic-Prediction-Assisted Algorithms . . . 26
2.6.1 Inter-ONU scheduling . . . 26
2.6.2 Intra-ONU scheduling . . . 28
2.7 Maximum Throughput Analysis . . . 30
2.8 Simulation Platform . . . 31
2.8.1 Traffic generation and types . . . 34
2.9 Simulation Results . . . 36
2.9.1 Load analysis . . . 37
2.9.2 EPON cycle length analysis . . . 41
2.9.3 WiMAX frame length analysis . . . 45
2.9.4 A realistic scenario . . . 48
2.10 Chapter Summary . . . 50
II
Managing Femtocell Interference in Preplanned
Cellu-lar Network
58
3 Predicting Femtocell Interference for Next-Generation Networks via a Novel Building Architecture Model . . . 593.1 Preamble . . . 59
3.2 Signal Propagation into Buildings . . . 61
3.3 Modeling Methodology . . . 65
3.4 Constructing Femtocell Signal Propagation Model Based on Building Architectural Model (BAM) . . . 67
3.4.1 Estimating the attenuation with Gaussian-mixture distribution 70 3.4.2 Recived power distribution . . . 70
3.5 An Application: Optimal FBS Placement . . . 72
3.6 Chapter Summary . . . 74
4 Novel Algorithm for Real-time Procedural Generation of Building Floor Plans . . . 78
4.1 Preamble . . . 78
4.2 Literature review . . . 79
4.3 Proposed Algorithm for Constructing Floor Plans . . . 80
4.3.1 Determining the outer shape of the house . . . 82
4.3.2 Rooms placement . . . 82
4.3.3 Corridor placement . . . 86
4.3.4 Placing windows and doors . . . 89
4.4 Results . . . 89
4.5 Chapter Summary . . . 92
5 Indoor-Outdoor Channel Characterization and its Application to In-terference Analyses of Femtocells . . . 95
5.1 Preamble . . . 95
5.2 Proposed Composite Shadowing/Multipath Fading in Mixed Indoor-Outdoor Environments . . . 98
5.2.1 A simplified stochastic attenuation model . . . 102
5.3 Received Signal Model . . . 105
5.3.1 OFDM signal model . . . 105
5.3.2 Macrocell/Femtocell signal model . . . 106
5.4 Performance Analysis of a Macro User in the Presence of Femtocells . 108 5.4.1 Femtocell signal approximation using Nakagami-m distribution 108 5.4.2 PDF of the received signal envelope . . . 109
5.4.3 Signal to interference ratio (SIR) . . . 111
5.4.4 Outage probability . . . 116
5.5 Numerical Results . . . 117
5.6 Chapter Summary . . . 121
III
Mitigating Impulsive Noise in Frequency-Selective
Chan-nels
126
6 BER Reduction of OFDM Based Broadband Communication Sys-tems over Multipath Channels with Impulsive Noise . . . 1276.1 Preamble . . . 127
6.2 OFDM System and Channel Models . . . 130
6.2.1 OFDM system model . . . 130
6.2.2 Impulsive noise model . . . 131
6.3 Proposed System Model . . . 132
6.4 TDI Symbol Blanking . . . 134
6.5 System Performance in AWGN Channels . . . 137
6.6 System Performance in Fading Channels using ZF Equalizer . . . 138
6.6.1 No samples blanked, = 0 . . . 139
6.6.2 Samples blanked, >0 . . . 143
6.7 System Performance in Fading Channels using MMSE Equalizer . . . 145
6.7.1 No samples blanked, = 0 . . . 145
6.7.2 Samples blanked, >0 . . . 150
6.8 Numerical Results . . . 152
6.8.1 AWGN channels . . . 154
6.8.2 Fading channels . . . 155
6.9 Chapter Summary . . . 162
7.1 Improving Quality of Service in Hybrid Optical Wireless Network . . 169 7.2 Managing Femtocell Interference in Pre-planned Cellular Network . . 170 7.3 Mitigating Impulsive Noise in Frequency-Selective Fading Channels . 172
Appendices
A Blanking Distortion in OFDM Systems . . . 175
B Samples of Automatically Generated Floor Plans . . . 178
C Curriculum Vitae . . . 180
2.1 Some example applications and their corresponding EPON QoS class
and WiMAX service type . . . 14
2.2 Notations used in Algorithm 1. . . 28
2.3 Notations used in Algorithm 2. . . 29
2.4 Simulation parameters. . . 33
2.5 Traffic loads in realistic scenario. . . 34
3.1 Attenuation of walls in different frequencies . . . 64
3.2 GMM paramters . . . 71
4.1 Joint probability of the number of bedrooms (rows) and the number of rooms (columns). . . 83
4.2 List of the parameters used in generating floor plans. . . 90
2.1 Integrated EPON and WiMAX architectures . . . 12
2.2 Timing diagram of sending a marked packet (a) Normal scheduling (b) Integrated scheduling. . . 17
2.3 EPON cycle in comparison with WiMAX frames. . . 19
2.4 Relationship between F(t) and WiMAX frame. . . 20
2.5 A representation ofF(t): (a) General case, (b) Simplified . . . 22
2.6 Illustration of F(t) and request corrections method. . . 24
2.7 Simulation Scenario. . . 32
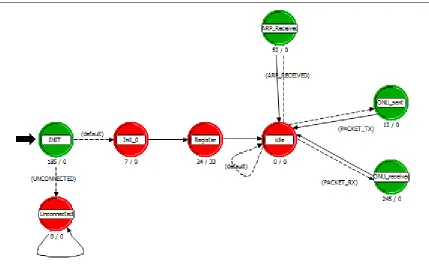
2.8 OLT MAC layer process model in OPNet. . . 34
2.9 ONU MAC layer process model in OPNet. . . 35
2.10 Normalized throughput versus normalized load. . . 37
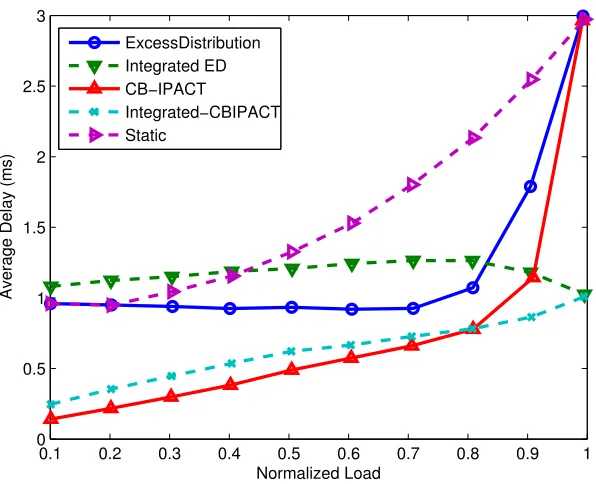
2.11 Average delay of EF flow in different loads. . . 38
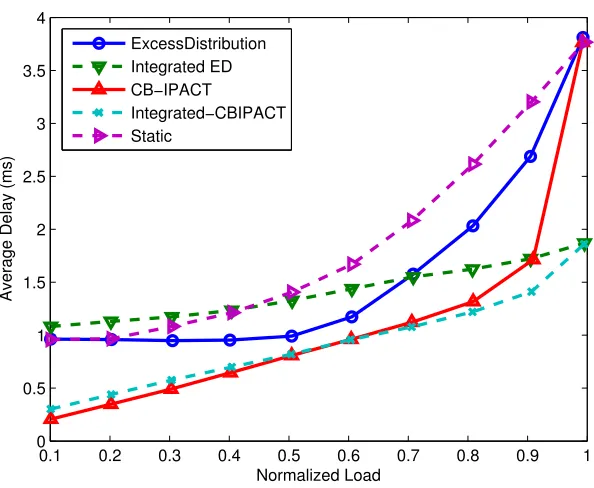
2.12 Average delay of AF flow in different loads. . . 39
2.13 PDF of EF delay using CB-IPACT and integrated-CBIPACT. . . 40
2.14 PDF of EF delay using ED and integrated ED. . . 41
2.15 Normalized throughput versus cycle length. . . 42
2.16 Normalized analytic throughput versus cycle length. . . 43
2.17 Average delay of EF stream versus EPON cycle length. . . 44
2.18 Comparison of the PDF of EF delay for different EPON cycle lengths. 45 2.19 Timing diagram for partial knowledge of incoming traffic. . . 46
2.20 Average AF delay versus EPON cycle length. . . 47
2.21 Maximum throughput versus frame length. . . 48
2.22 Average EF delay versus frame length. . . 49
2.23 Average AF delay versus frame length. . . 50
2.24 The delay of EF and AF traffic classes in the realistic scenario. . . 51
2.25 ONU/ONU-BS throughput in the realistic scenario. . . 52
3.1 Cost MultiWall Model (MWM) concept and a sample. . . 63
3.2 Measurement setup. . . 66
3.3 Angular pattern representation of a FBS’s signal leaking outside the building. . . 69
3.4 Probability distribution function of building attenuation. . . 71
3.5 Expected signal attenuation map of a sample house. . . 73
3.6 The histogram of Im. . . 73
4.1 An aerial photo showing the similarity of homes in a neighbourhood. 83
4.2 Hierarchy graph of a sample house. . . 85
4.3 A tree graph used by Treemap algorithm and its corresponding rect-angle division . . . 86
4.4 Finding the corridor path. . . 86
4.5 Room placement steps for the hierarchy tree shown in Fig. 4.2. . . 87
4.6 Optimizing the corridor with different actions. . . 88
4.7 A sample floor plan automatically generated by the algorithm. . . 90
4.8 Comparison of a sample generated floor plan with an architecture de-signed floor plan . . . 91
5.1 Possible interferences in a two-tier femtocell/macrocell network [3]. . 96
5.2 Simulated PDF of the building shadowing Lx in the complete model. 99 5.3 A sample FBS propagation contour. . . 101
5.4 The simplified PDF of the building shadowing Lx . . . 103
5.5 Probability mass function of the number of penetrated internal walls k2.104 5.6 Analytical and simulated PDF of the received signal envelope given in (5.26) for different received mean power of macrocell and femtocell. . 111
5.7 The PDF of femtocell signal envelope for different values of K. . . 118
5.8 Comparing the PDF of SIR versus SINR for a single interferer (ω= 0.2) as well as two interferers (ω1 =ω2 = 0.1), and Ω = 1. . . 119
5.9 An outage probability map around three FBSs in a given scenario, calculated by the proposed model. . . 120
5.10 Analytical and simulated outage probability for single and multiple FBSs. . . 121
5.11 Simulated BER versus SNR in the presence of single FBS using the developed model, outer room model and LOS. . . 122
6.1 The proposed TDI system in fading channels. . . 134
6.2 BER versus the thresholdT1 used for sample blanking at different SNRs.153 6.3 BER versus the thresholdT1 for different values ofT2 and SNR. . . . 154
6.4 BER performance of variants of the TDI system versus standard OFDM.155 6.5 Noise enhancement of the TDI and OFDM systems with ZF and MMSE equalizers forSN R= 15 dB. . . 156
6.6 Effective SINR of TDI and OFDM for different values of . . . 157
6.7 BER of the TDI and conventional OFDM using ZF and MMSE equalizers.158 6.8 BER versus the threshold T1 for different values of T2 and SNR in fading channels. . . 159
6.9 BER using ZF equalizer in the presence of IN. . . 160
6.10 BER using MMSE equalizer in the presence of IN. . . 161
6.11 BER of the TDI for different gating probability p. . . 162
AF Assured Forwarding
AWGN Additive White Gaussian Noise
BER Bit Error Rate
BE Best Effort
BS Base Station
CDF Cumulative Distribution Function
CSI Channel State Information
DBA Dynamic Bandwidth Assignment
DL Download
EF Expedited Forwarding
EPON Ethernet Passive Optical Network
FBS Femtocell Base Station
FDTD Finite-Difference Time-Domain
FFT Fast Fourier Transform
FTTH Fiber To The Home
GPON/GEPON Gigabit Ethernet Passive Optical Network
HNB Home NodeB
IEEE Institute of Electrical and Electronics Engineers
IFFT Inverse Fast Fourier Transform
IN Impulsive Noise
IPTV Intlernet Protocol TeleVision
LAN Local Area Network
LTE Long Term Evolution
MAC Media/Medium Access Control
MCS Modulation and Coding Scheme
MIMO Multiple-Input, Multiple Output
MMSE Minimum Mean Square Error
MPCP MultiPoint Control Protocol
NSI Noise State Information
OFDM Orthogonal Frequency Division Multiplexing
OFDMA Orthogonal Frequency Division Multiple Access
OLT Optical Line Terminal
ONU Optical Network Unit
ONU-BS Optical Network Unit - Base Station
PAPR Peak to Average Power Ratio
PDF Probability Density Function
PHY Physical Layer
PMP Point-to-MultiPoint
PON Passive Optical Network
QAM Quadrature Amplitude Modulation
QoS Quality of Service
QPSK Quadrature Phase Shift Keying
RV Random Variable
SINR Signal to Interference and Noise Ratio
SIR Signal to Interference Ratio
SNR Signal to Noise Ratio
SONET Synchronous Optical NETwork
TDI Time Domain Interleaving
UE User Equipment
UL Upload
VoD Video on Demand
VoIP Voice over Internet Protocol (IP)
WDM-PON Wavelength Division Multiplexed Passive Optical
Network
WHT Walsh-Hadamard Transform
WiMAX Worldwide Interoperability for Microwave Access
ZF Zero Forcing
Chapter 1
Introduction
The modern society vastly depends on information and communication technologies.
All kinds of information is digitized, and modern communication technologies remove
the time and space restrictions on human activities. Having a personal communication
device is a must, not a luxury anymore. Mobile communication is an essential part of
our lives. It is widespread and common, yet transparent as air. The image of a person
typing on a text-based, bulky computer is ancient. Today, people are using their
computing machines at the palm of their hands. These newly emerged technologies
provide a multimedia user experience that a while ago seemed impossible. With a
few touches, users tap into colossal amount of information that is brought to their
devices with the speed of light.
The key part in all these technologies is a broadband access network capable
of ensuring Quality of Service (QoS) for different types of traffic. Foreseeing this,
International Telecommunication Union-Radio communication/International Mobile
Telecommunication (ITU-R/IMT) devises a target for 4th generation systems which
is called IMT-advanced. An IMT-advanced network will be capable of over-the-air
transfer in rates that exceeds 1 Gbps, thus supports various high-quality and high
data rate applications and services. It will transfer different types of traffic, such as
data, voice, and video on an all-IP infrastructure, and it is also designed to serve
mobile users, as well as fixed users.
Two potential technologies are competing towards IMT-Advanced goals.
World-wide Interoperability for Microwave Access (WiMAX) was the first to enter the
com-petition. It was originally designed to provide broadband access for fixed users. The
mobility option is added later via the IEEE 802.16m standard. The second competitor
To be able to fulfil the promises of IMT-Advanced, both WiMAX and LTE have
to include a wide range of technologies. Some of these technologies are: smart
an-tenna, multiple-input and multiple-output (MIMO), relay network and carrier
aggre-gation. They should also consider working in different settings and use the spectrum
flexibly. Being able to use multiple bandwidth settings and different multiplexing
technologies, such as TDM or FDM, are just examples of the required flexibility.
Having access to all these technologies, a 4G operator can easily configure the
set-tings to achieve the required performance.
Another mandate for 4G technologies to achieve a high performance is their
capability to seamlessly integrate with other access and distribution layer
technolo-gies. As an instance, most operators use optical networks to connect the wireless base
stations to the core network. The ability to efficiently exploit the features of optical
networks to improve the end-to-end QoS would result in a distinguished advantage
for the technology. The work presented in Chapter 2 addresses the issue of improving
end-to-end QoS for future wireless access networks, the backbone of which is typically
composed of a Passive Optical Network (PON). PONs are proved to be a smart choice
for backbone data networks, since they are capable of transferring massive amounts
of data, satisfactory for the everyday growing demand of recent applications, and yet
they have less maintenance cost in comparison to other wired networks.
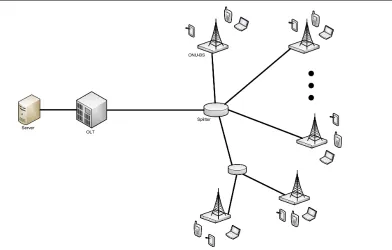
The integration of optical and wireless networks offers an inexpensive broadband
solution. In a hybrid network, such as the one shown in Figure 2.1, the optical part
is used to connect several wireless base stations as well as broadband customers to
the central office. The abundant bandwidth of optical network is divided among
the wireless base stations to serve their wireless users. In addition, hybrid
optical-wireless networks offer several value-added features, such as redundancy, mobile access
and cooperative communication which make it more appealing. The hybrid
optical-wireless networks seem to be the technology of future, but some challenging issues
still need to be addressed. In Chapter 2, we focus on ensuring the QoS over a hybrid
network, which is vital to offer a satisfactory service.
One of the next generation network objectives is to provide high quality service
indoor traffic puts a high pressure on next-generation technologies to develop
rev-olutionary ideas to serve indoor users, which is very challenging due to the signal
attenuation caused by traversing the walls and buildings’ structure and their
com-plex effect on the signal. Traditional solution of increasing the transmission power
by a margin to counteract these effects is not an option anymore. This is mainly
be-cause doing that, increases the interference power in the current interference-limited
networks, and also the available power for mobile devices is limited.
The remedy of choice by most next-generation networks is to rely on low-power
indoor transmitters, called femtocell base station (FBS), to serve indoor users. These
FBSs are connected to the distribution layer of the operator via a broadband
Inter-net connection and share the medium with normal InterInter-net traffic. The introduction
of the femtocell paradigm to the network generates several challenges such as
inter-ference management, security, handover strategies, etc. Interinter-ference management is
one of most important challenges, since it affects not only the indoor users that are
served by FBSs, but also legacy macrocell users that are in proximity of those FBSs.
Thus, improving the total performance of the network requires intelligent interference
management schemes and realistic models for the femtocell interference.
Traditional wireless networks are either concerned with penetration of signal
into buildings, such as legacy cellular networks, or covering the whole building area,
like wireless LANs. Hence, a realistic model for describing the propagation of a
signal from an indoor transmitter to outside, which is the main interest in case of
femtocells, is left undeveloped. The typical research approach to study the femtocell
interference is to choose a sample scenario with one or more buildings and predefined
floor plan [2,3]. The results of this approach clearly depend on the selected floor plan
and may considerably vary with it. This motivates us to develop a model, as realistic
as possible, for this exact application.
The developed model is then used as the basis for a composite shadowing/fading
model that jointly considers the effects of signal propagation through building
struc-tures and multipath fading. Moreover, several performance criteria of a two-tier
out-age probability are analyzed using the proposed model. The results reveal that in
some scenarios, commonly used models for femtocell studies fail to grasp the complex
effects of signal propagation in buildings and their predictions are far from reality.
One of the design goals of the next-generation networks is to provide high
quality service anytime and anywhere. For the next work, we turn our attention to
industrial environments where impulsive noise and multipath fading are main
cul-prits in reduced QoS. Almost all of the proposed next-generation networks, employ
a variant of Orthogonal Frequency Division Multiplexing (OFDM), which is proved
to be susceptible to impulsive noise (IN). In presence of IN, the OFDM performance
is limited by a high error floor. Therefore, in Chapter 6, we first model the effect
of simultaneous fading and IN on OFDM systems, and later propose a technique
to improve the performance of such systems with minimum added complexity. The
proposed technique can be applied to any OFDM-based system that suffer from IN.
For example, recent Power Line Communication (PLC) standard added an
OFDM-based mode. Powerline communication is a prime example for channels with IN, and
hence, the proposed technique can be used to mitigate the adverse effect of IN on
such channels.
1.1
Thesis Outline
The works proposed in this thesis consists of five chapters, each is focused on a
differ-ent part of the next generation network. The first part, which is described in Chapter
2, focuses on improving the quality of service in backbone part of the network. The
next three chapters consider the performance of a two-tier femtocell/macrocell
net-work. Chapter 3 presents a model for the femtocell interference based on a novel
Building Architecture Model (BAM) described in Chapter 4. In Chapter 5, Some
performance metrics, such as received Signal to Interference and Noise ratio (SINR)
and outage probability is derived based on the proposed model in Chapter 4. The
work presented in Chapter 6 considers the effect of Impulsive Noise (IN) on the
1.2
Contributions of the Thesis
The contributions of the thesis is summarized in the following list.
1.2.1
Improving quality of service (QoS) of hybrid
optical-wireless networks
First: A technique to extract information on incoming traffic from the wireless
sched-uler is formulated.
Second: A Dynamic Bandwidth Assignment (DBA) algorithm for the upload channel
of Ethernet PON (EPON) is developed.
1.2.2
Modeling the interference caused by femtocells in
pre-planned wireless access networks
First: An algorithm to generate random floor plans is developed.
Second: A technique to stochastically model the randomness in building architectures
is proposed.
Third: An indoor-outdoor channel model to evaluate the interference caused by
fem-tocell transmitters is developed.
Fourth: Based on the proposed model, several performance metrics, including received
SINR and outage probability is evaluated.
1.2.3
Improving the bit error rate performance of OFDM
systems in frequency-selective fading channels in
presence of the impulsive noise
First: The effects of IN in AWGN and frequency-selective channels are modeled.
Second: A system to improve the performance of OFDM-based systems in presence of
Third: The performance of the proposed system in terms of received SINR and Bit
References
[1] V. Chandrasekhar and J. Andrews, “Uplink capacity and interference avoidance
for two-tier femtocell networks,” IEEE Trans. Wireless Commun., vol. 8, no. 7,
pp. 3498–3509, Jul. 2009.
[2] Technical Specification Group Radio Access Networks (TSG-RAN), “3G Home
NodeB study item technical report (release 8),” 3GPP, Tech. Rep. TR 25.820,
2008.
[3] H. Claussen, L. Ho, and L. Samuel, “An overview of the femtocell concept,” Bell
Part I
Improving Quality of Service in
Chapter 2
Improving the Quality of Service of
Hybrid Optical Wireless Networks via a
Novel Traffic-Aware Dynamic Bandwidth
Assignment Algorithm
2.1
Introduction
In recent years, numerous bandwidth consuming applications have emerged.
These applications like Internet Protocol TeleVision (IPTV), online gaming and
Video-on-Demand (VoD), require considerable bandwidth and are attracting widespread
attention among consumers. Moreover, service providers increasingly show interest
and intention to offer integrated services, comprising of voice, video, data and even
wireless services, to their customers based on an all-IP shared network infrastructure.
As a result, a broadband access network capable of ensuring Quality of Service (QoS)
for different service types is required.
Optical fiber networks are capable of transferring massive amounts of data,
sat-isfactory for the everyday growing demand of recent applications. Modern passive
op-tical networks, such as 10-Gigabit Ethernet Passive Opop-tical Network (10G-EPON) or
Wavelength Division Multiplexed Passive Optical Network (WDM-PON) can
trans-fer several gigabits of data per second and yet they have less maintenance cost in
comparison to old optical networks, like Synchronous Optical NETwork (SONET).
Nevertheless, it is still quite expensive to lay fiber to every user’s premise and build
a purely optical network. In addition to the cost problem, it is impractical to build
a true optical network, such as Fiber To The Home (FTTH), in a congested and
built-up urban area, where considerable number of broadband users are.
On the other hand, wireless networks are relatively inexpensive and have the
unique feature of delivering data to mobile users. The drawbacks are that they offer
much less bandwidth and they are error-prone. Another disadvantage of wireless
networks is that the wireless spectrum is shared among many users, further limiting
the bandwidth offered to each user.
The integration of optical and wireless networks offers an inexpensive broadband
solution. In a hybrid network, such as the one shown in Fig. 2.1, the optical part
is used to connect several wireless base stations as well as broadband customers to
the central office. The abundant bandwidth of optical network is divided among the
wireless base stations to serve their wireless users. In addition, hybrid optical-wireless
networks offer several value-added features, such as redundancy, mobile access and
cooperative communication which make it more appealing.
The hybrid optical-wireless networks seem to be the technology of future but
some challenging issues still need to be addressed. Here, we focus on ensuring the QoS
over a hybrid network, which is vital to offer a satisfactory service. The choice of how
the scheduler assigns bandwidth to different flows has a tremendous impact on the
QoS parameters. The scheduler typically relies on a Dynamic Bandwidth Assignment
(DBA) algorithm to divide the available bandwidth between different flows.
In this work, we propose a method to enhance DBA algorithms in the optical
part of hybrid optical-wireless networks. A prediction method, which uses the
in-formation in the wireless domain, helps decrease the delay bound of delay-sensitive
flows, and hence results in improved QoS. The extensive simulation-based studies not
only shed light on the factors, affecting the proposed algorithm, but also compare
fixed and adaptive cycle length optical DBA algorithms side by side.
The content of this chapter addresses the integration of Worldwide
Interop-erability for Microwave Access (WiMAX) and Ethernet Passive Optical Network
How-The chapter is organized as follows. Section 2.2 introduces the system model.
Section 2.3 compares advantages and disadvantages of integration in hybrid
optical-wireless networks. The proposed algorithm is presented in Section 2.5 and the
max-imum throughput of optical-wireless network is analytically studied in Section 2.7.
The traffic prediction assisted algorithms, used in simulation experiments, are
ex-plained in Section 2.6, while Section 2.8 defines the simulation platform. Section 2.9
analyzes the simulation results and finally Section 2.10 concludes the chapter.
2.2
System Model
The topology of hybrid optical-wireless network is commonly considered to be tree
[3–10].
The root of the tree is the Optical Line Terminal (OLT) which is located at
the central office (CO) and is directly connected to the core network. Each Optical
Network Unit (ONU), also called gateway [9], is connected to the OLT through one
or several splitters, as shown in Fig. 2.1. WiMAX Base Stations (BS) are connected
to an ONU via a standard interface, like Ethernet, or even implemented in the same
box. We refer to the latter case as ONU-BS. In practice, the WiMAX BSs share
the optical bandwidth with other users, such as residential or corporate local area
networks.
The WiMAX BSs provide wireless connectivity to their subscriber stations (SS)
through either a single hop legacy wireless network or a relay-based wireless network
with mesh topology. In the latter case a routing algorithm, like the one presented
in [9], is necessary to effectively deliver the packets.
Due to the intrinsic property of passive optical networks, downstream data,
transmitted from OLT to ONU, is broadcasted to all ONUs. By contrast, upstream
data, transmitted from the ONUs can only be received at the OLT. Thus, the
down-stream and updown-stream links are considered as Point-to-MultiPoint (PMP) and
point-to-point (PPP), respectively.
Figure 2.1: Integrated EPON and WiMAX architectures [3]. c2007 IEEE
and optical parts can be integrated, resulting in an intelligent network. The key point
in the integrated architecture is that the BS and the ONU can share their internal
data, such as detailed information about bandwidth requests, bandwidth allocation
and packet scheduling, which can be used to improve the overall performance. An
intelligent scheduler at the integrated ONU-BS should leverage this extensive
infor-mation to achieve improved performance and QoS guarantee.
2.2.1
Quality of service in hybrid wireless-optical networks
Quality of service is one of the major research areas in network-relates topics. It isalso one of the most challenging ones, as a set of new challenges and requirements
come along with each new application and for every emerging technology. To provide
good quality of service, the application requirements should be satisfied with as less
resources as possible. The Best Effort (BE) method of delivery inherited from the
original Internet design is not suitable for all of the applications, and to ensure the
quality of service, special designs are required.
The quality of service requirements of each application is typically described by
the following parameters [11].
• Delay: The time interval between the departure of last data bit from the source
and its arrival at the destination. If original source and final destination are
considered, it is called end-to-end delay. To focus on different network layers
or sections of the network, various types of delays are typically measured.
• Jitter: The delay variation that is caused by traveling through nodes in the
network.
• Loss: The percentage of the transmitted packets that are not received in
pre-defined period of time.
Modern networks have a specific design, namely QoS framework, to satisfy the
user/application requirements referred to as Service Level Agreement (SLA) or service
commitment. In QoS framework a combination of scheduling, buffer management and
policing algorithms are implemented to satisfy the service commitment.
Guaranteeing quality of service in a hybrid wireless-optical network is a formidable
task. The two domains, i.e., wireless and optical, have their own characteristics and
face separate challenges. Some of these differences are listed as follows:
• The wireless link is much more susceptible to noise than optical link.
• The data rate of wireless network is much less than optical network.
• Unlike the optical network for which the state and attenuation of each ONUs
is almost constant, wireless environment is dynamic and its characteristics are
changing quite fast.
• WiMAX implements IntServ QoS framework, whereas EPON implements
Diff-Serv.
• Traffic classes are defined differently in these networks.
In this study, we selected EPON as the optical network and WiMAX as its
wireless counterpart due to their unique features. These two technologies have several
similarities that work in our advantage; e.g., they both support QoS, and have a
request/grant mechanism for assigning bandwidth to different users integrated within.
Nevertheless, there are also several major differences that need to be addressed.
In EPON, the implementation details such as the number of service classes
Table 2.1: Some example applications and their corresponding EPON QoS class and WiMAX service type
Application EPON QoS class WiMAX service type
Web browsing, email BE BE
File transfer BE nrtPS
Streaming audio/video AF rtPS
VoIP EF ertPS / UGS
recognize the types of service defined in IETF standard. The most well-known and
typically implemented traffic classes, in order of their priorities, are Expedited
For-warding (EF), Assured ForFor-warding (AF) and Best Effort (BE).
WiMAX bandwidth management adapts a different approach. Five different
classes of service are defined [12].
• Unsolicited Granted Service (UGS)
• extended real-time Polling Service (ertPS)
• real-time Polling Service (rtPS)
• non real-time Polling Service (nrtPS)
• Best Effort (BE)
In WiMAX, each flow has to initialize the session and specify its type of service.
Depending on the requested type of service, it may need to request for bandwidth in
each frame. UGS services specify their bandwidth requirement in the initialization
phase. They are the highest priority class of service. On the other hand, polling
services request for bandwidth in each frame. Scheduling algorithm processes these
requests and grants the available bandwidth to them. The least important type
of traffic is BE, which competes for the required bandwidth. WiMAX Scheduler
processes all of these requests and grants the available bandwidth. The scheduling
results compose the upload map field which is then broadcasted to SSs. A number
of applications along with their corresponding WiMAX type of service are listed in
Researchers have proposed a number of methods to integrate wireless networks, such
as WiMAX or LTE, with passive optical networks. The idea of using the information
already available at the wireless BS to assist the optical part is first introduced in [3].
But no specific methods or performance evaluation has been done. To the best of
our knowledge, none of the researchers devised a comprehensive method to use the
information to improve the performance of the optical domain, and hence improve
the overall performance.
Some addressed hybrid optical-wireless network by proposing a single MAC
frame and QoS structure on both domains [13, 14] while others translated one
tech-nology’s QoS parameters into another’s [5–7,10,15,16]. Due to the differences between
optical and wireless systems, such as their scalability requirements, it is too difficult
to propose a single QoS structure for both technologies without sacrificing scalability.
Sarkar et al. presented an architecture called Wireless-Optical Broadband
Ac-cess Network (WOBAN) [17–24]; This work proposed several approaches on the
place-ment of ONU-BS nodes. The work presented in [14] addressed the integration of
WiMAX and Optical Burst Switching (OBS) and evaluated the performance for BE
and UGS traffic flows. Another architecture, namely MARIN, that incorporates
mul-tiple OLTs in the network was proposed in [25].
Ou et al. in [5] devised a method to dynamically map the WiMAX classes to
the Gigabit PON (GPON) classes. The design was implemented using commercially
available devices to deliver video on demand service to test users. The work was
later enhanced in [7] and an excess distribution DBA scheme was adopted. Yanet al.
proposed a DBA algorithm that takes channel conditions into account [8]. Another
channel aware algorithm was presented in [6]. The proposed scheduling algorithm
considers the wireless condition of the cell and head of line delay of rtPS queue as
well as the queue length. The authors of [10] proposed a two-step mapping that
combines BE and nrtPS into a priority queue and rtPS and ertPS into another one
and then maps them to EPON classes of traffic. Obele et al. in [13, 15] proposed an
The performance of their proposed architecture was analyzed under self-similar and
long-reach-dependent traffic loads. Wanget al. in [16] and Luo in [26, 27] also used a
similar unified QoS scheme throughout the network. The work described in [4] used
the next EPON polling time to control the admission of delay-sensitive traffic.
2.4
Improving QoS via Anticipated Traffic
Information
Amongst the various challenges of ensuring QoS in EPON, the dynamic bandwidth
assignment of the upload channel attracts more research attention, due to its inherent
limitations. Unlike the download channel where the bandwidth assigner has full
knowledge of the bandwidth needs, the upload bandwidth assigner, which is located
at the OLT is not aware of real time bandwidth requirements of each ONU. Therefore,
a mechanism is required to report real time bandwidth requirements of each individual
ONU to the OLT.
To exchange the bandwidth requirement information, a request/grant
mecha-nism, called Multi-Point Control Protocol (MPCP), is used. In MPCP, ONUs send
information regarding their bandwidth requirements to the OLT. For example, in a
widely used method, ONUs send their queue length to the OLT at the end of the
grant slot. OLT processes the results and sends the bandwidth assignments back
to ONUs by grant packets. The problem is that MPCP introduces latency which
degrades the performance of the bandwidth assigner. i.e., the bandwidth assigner in
OLT can only know the ONU bandwidth requirements with some delay. The MPCP
request is sent once in each EPON cycle. As a consequence, the packets that are
received after sending the request remain in ONU buffer for an extra EPON cycle.
Using information about the incoming traffic can alleviate the degradation of
the extra delay. Integrated WiMAX/EPON ONU-BS provides us with a tool to
give this information to OLT. Prior to sending upstream data, the user requests the
required wireless bandwidth from the WiMAX BS. The BS scheduler assigns the
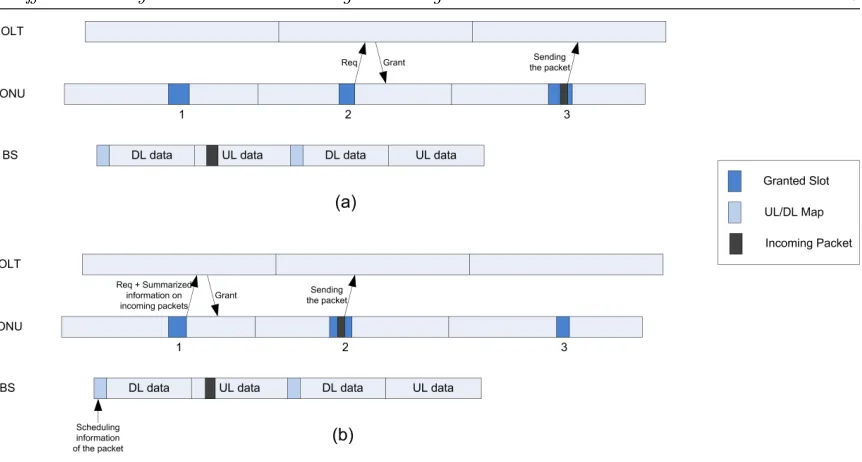
Figure 2.2: Timing diagram of sending a marked packet (a) Normal scheduling (b) Integrated scheduling.
field of WiMAX frame. Therefore, the BS has full knowledge of the incoming data
for at least the next coming frame. If this information becomes accessible to the OLT
scheduler, it can be used to predict the incoming traffic which would result in a more
effective bandwidth scheduling. However, in order to achieve optimal performance,
an intelligent design that considers the EPON cycle and WiMAX frame length as
well as the traffic load and classes is required.
Predicting the incoming traffic makes it possible to request the required
band-width for transmitting a packet that has not yet arrived. At the next EPON cycle,
due to pre-assignment of the required bandwidth, the packets that have just arrived at
the ONU, are transmitted to the OLT right away without experiencing any additional
delay for exchanging MPCP request/grant messages.
Since the WiMAX BS assigns bandwidth to the Mobile Subscribers (MS) at
the beginning of each frame, it is aware of the quantity of data to be received during
the following frame. Fig. 2.2 compares the process of sending a marked packet in
normal and integrated scheduling. As it can be seen in the Fig. 2.2, predicting the
arrival of a packet reduces its queuing delay. This helps ensure QoS for delay sensitive
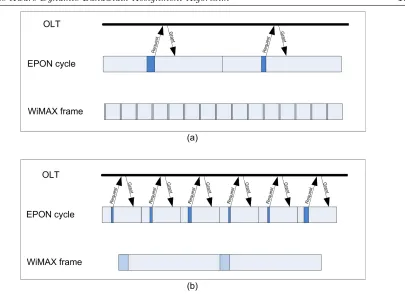
In order to use knowledge of incoming traffic to optimize the bandwidth
as-signment in hybrid optical-wireless networks, the length of the WiMAX frame and
EPON cycles should be carefully adjusted. The essential condition for predicting
incoming traffic is that the WiMAX frame length should be longer than the EPON
cycle length. For better illustration, consider Fig. 2.3(a) in which the WiMAX frame
is considerably shorter than EPON cycle. Since the BS knows only the traffic of the
current frame, it is not possible to accurately predict the amount of traffic that
ac-cumulates until the next EPON cycle. Therefore, only a fraction of incoming traffic
can be predicted. Hence, the performance improvement that could have been gained
from full knowledge diminishes. By contrast, Fig. 2.3(b) illustrates the case in which
WiMAX frame is longer than EPON cycle. Hence, the ONU-BS knows the quantity
of data to be sent to the OLT at the next EPON cycle.
The key part of the proposed algorithm is estimating the amount of traffic
that an ONU-BS will have to relay to the OLT in the next grant. Without lack of
generality, we assume that all received data at the ONU-BS should be relayed to the
OLT. i.e., there is no local traffic at ONU-BS. Given that the amount of incoming
traffic is known, ONU-BS requests OLT for the amount of bandwidth, denoted byBr
below.
Br =Q+Bp(Tnx), (2.1)
whereQdenotes the current length of the queue andBp(Tnx) is the predicted
incom-ing traffic that will be received up to beginnincom-ing of the next grant, which is represented
byTnx.
It is essential to know the time of next transmission to estimate the bandwidth
requirement. If EPON uses fixed length cycles, the next time of transmission is simply
calculated as
Tnx=Tg +C, (2.2)
where Tg is the grant window beginning time and C is the cycle length. It is worth
mentioning that this method does not account for the variations that occur because
Figure 2.3: EPON cycle in comparison with WiMAX frames.
calculateTnxbased on the internal data of OLT scheduler. This approach is applicable
to both fixed-length cycle and adaptive-length cycle algorithms.
2.5
Implementing Prediction Mechanism in DBA
Algorithms
The proposed algorithm consists of two parts. The core of the algorithm is the
inter-ONU scheduling which is performed at the OLT scheduler. This part of the algorithm
does not normally consider different classes of traffic and assigns the bandwidth to
each ONU based on the available bandwidth, and ONU requests. The prediction
based technique enhances this part and allows it to use traffic prediction as well as
ONU requests to fine tune the assigned bandwidth. An example of augmenting an
inter-ONU scheduling algorithm with prediction is described in Section 2.5.2.
Figure 2.4: Relationship between F(t) and WiMAX frame.
at each ONU to assign the granted bandwidth to each traffic class. An example
of such an algorithm and our proposed modification based on traffic prediction is
explained in Section 2.6.2.
The algorithm is independent of the WiMAX BS scheduler. Therefore, it does
not impose any requirement on the WiMAX scheduler. The only modification needed
at WiMAX BS is that its upload bandwidth assignments, i.e., UL map, should
be made accessible to the ONU scheduler. Although choosing the WiMAX
sched-uler may affect the overall performance, the study of WiMAX scheduling algorithms
and their impact is beyond the scope of this work. A comprehensive survey of WiMAX
scheduling algorithms can be found in [28].
2.5.1
Predicting incoming traffic
Information about incoming traffic in the next WiMAX frame is abstracted in the
function F(t), which is defined as the aggregated traffic at time t. F(t) predicts the
ONU queue length at time t. It is an increasing function of time that yields the
amount of traffic that has been received up to timet. The relation between WiMAX
frame andF(t) is illustrated in Fig. 2.4.
Every time a UL map is generated at the BS, F(t) is defined for the next
WiMAX frame. Note that it models the worst case scenario, i.e., maximum
aggre-gated traffic, and depending on the type of the scheduler used in BS, the real incoming
traffic can be slightly less.
exchanges and keep the OLT scheduler as simple as possible, the information
regard-ing the incomregard-ing traffic class is not transmitted to the OLT. The simulations show
that for the selected DBA algorithm, it is not required to transmit the class-based
information. However, since this approach can be applied to any DBA algorithm,
sending the class-based information can be easily implemented, if required. Without
considering the classes of traffic, F(t) can be modeled by a linear piecewise function
of time.
F(t) =
a0t+b0, t0 < t≤t1
a1t+b1, t1 < t≤t2
a2t+b2, t2 < t≤t3 ..
.
ant+bn, tn < t≤tn+1
, (2.3)
whereai and bi, i= 1, ..., nare coefficients. To simplify the calculations and prohibit
time wrapping, time is typically measured from a common origin such as beginning
of the cycle. Note that F(t) is only defined in the prediction range (t0, tn+1] which
is discussed more in the next paragraphs. In the case of considering multiple classes
of traffic, each class can be described by an equation similar to (2.3).
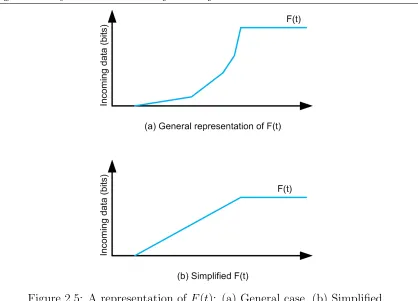
The slope of F(t) depends on the modulation and coding scheme selected by
MSs in the corresponding frame. In scenarios where all of the MSs use the same
modulation and coding technique and TDD duplexing is used,F(t) could be simplified
to
F(t) =
b0, t≤t1
a1t+b1, t1 < t≤t2
b2, t2 < t≤t3
. (2.4)
This case is not unreal and it happens if the network operates at the maximum
capacity, where all users transmit at the modulation and coding rate that yeilds
Figure 2.5: A representation of F(t): (a) General case, (b) Simplified
where maximum throughput analysis is of interest, which is the common analysis
approach for DBA algorithms, since more meaningful insight can be acheived by
studying the DBA algorithms under those conditions. An example of F(t) is shown
in Fig. 2.5.
The scheduler uses F(t) to estimate the incoming traffic and grant the
appro-priate amount of bandwidth. Since it is assumed that TDD is used as the duplexing
method, there are active and idle periods in the upload channel. Data packets are
arriving during the active periods, where SSs are allowed to send. In WiMAX, the
active period for upstream is the part of the UL subframe that is granted to the SSs.
F(t) =
b0, t0 < t≤t1s
a1t+b1, t1s < t≤t1e
a1t1e+b1, t1e < t≤t2s ..
.
antne +bn, tne < t≤tn+1s
, (2.5)
where tis and tie are the beginning and end of ith activity period, respectively. From
WiMAX TDD point of view, these are equivalent to beginning and end of the UL slot.
Normally, the WiMAX scheduler puts together the grant slot of all users that transmit
with the same modulation and coding. It also packs the grant at the beginning of
the slot [29]. Therefore, it is not expected to have more than one activity period in
the prediction range, which simplifies the transmission of abstract data.
Considering the WiMAX rate, time division duplexing and request scheme,F(t)
is
F(t) =
Q, tr < t≤t1s
RWt+Q−RW ×min(ts1, tr), t1s < t≤t1e
RWt1e +Q−RW ×min(t1s, tr), t1e < t < t2s
, (2.6)
whereRW is the WiMAX transmission rate, Qis the request or equivalently, ONU’s
queue length at the time of transmitting the request, and tr is the time of request
transmission. F(t) is illustrated in blue in Fig. 2.6. At the time of sending the
request, F(t) is initialized to Q. Then it increases with the WiMAX transmission
rate when the UL period begins. The increase continues until the end of UL period
and then remains constant.
The prediction information is updated regularly in a way that tr < t2s, i.e., the
updated prediction range overlaps with the previous one. This makes the continuous
Figure 2.6: Illustration of F(t) and request corrections method.
2.5.2
Employing predictions in DBA algorithms
In order to implement the predictions in the bandwidth assignment algorithm, it is
necessary to correct the requests to consider not only the packets that were in the
queue at the time of transmitting the requests, but also the packet that arrived later.
This way, it is possible to estimate the total number of the packets in the queue
in near future, including the time that the grant will be received. Also, since the
WiMAX frame is supposed to be longer than the EPON cycle (refer to Section 2.4
for the explanation), it is possible that receiving data continues between the grant
periods. The ideal solution is to consider all of these newly arrived packets and
extend the grant to transmit them, if possible. The grant can be extended until the
ONU’s transmission buffer becomes empty and all of the newly arrived packets are
transmitted.
In our proposed algorithm, F(t) predicts the newly arrived data. In order to
consider this prediction in the dynamic bandwidth assignment algorithm, it is required
to update the requests, fed into the DBA, with the predictions. Since the correction
depends on the bandwidth assignment, i.e., DBA results, it is done iteratively. This
way the DBA bandwidth assignments and request corrections are jointly calculated.
The DBA outcome without applying the request corrections is considered as
the initial bandwidth assignment. To calculate the request correction, the granted
bandwidth is modeled with the same approach as the incoming data. This model,
which is denoted byG(t), on the other hand, describes transmitted bits. It is modeled
as a line segment which starts from tg with a slope of RE. tg represents the start
G(t) =
0, t≤tg
RE ×(t−tg), t > tg
(2.7)
The reception prediction function F(t) and the transmission function G(t)
co-incide with each other at time tc. This is the time that ONU queue is expected to
become empty if enough bandwidth is available. Therefore
F(tc) = G(tc) (2.8)
By substitutingF(.) and G(.) from 2.6 and 2.7, respectively and solving the equation
for tc, we have,
tc =
tg +RQ
E, tg ≤ts−
Q RE RWts−Q−REtg
RW−RE , ts−RQE < tg < te− R1E(Q+RWte−RWts) tg +Q+RWte−RWts
RE , tg ≥te− R1E(Q+RWte−RWt1)
, (2.9)
wherets and te denote the beginning and the end of the next grant slot, respectively.
The calculation should be done for all ONUs, before starting a new iteration. Then,
the request correction of each ONU is
Rnewk =RE ×(tkc −tkg), (2.10)
where Rknew is the new request for ONU k. tkc and tkg denote tc and tg for ONU k,
respectively.
The correction process is repeated for each ONU until the granted bandwidths
stall or a predetermined maximum number of iterations is reached. Then, the granted
bandwidth is sent to the ONUs along with the grant start times and predicted
2.6
Traffic-Prediction-Assisted Algorithms
2.6.1
Inter-ONU scheduling
The proposed traffic prediction mechanism can be applied to any DBA algorithm.
Since it provides the DBA algorithms with real-time information of traffic, it generally
improves the delay performance. It is worth mentioning that the most important
modifications have to be done in the inter-ONU scheduling algorithms, which are
discussed here. There are two approaches among DBA algorithms regarding EPON
cycle length, which is a significant factor in the performance of the proposed method.
Some DBA algorithms, such as the well-known Interleaved Polling with Adaptive
Cycle Timing (IPACT) [30], use dynamic cycle length while others, such as Excess
Distribution [31], adapt fixed cycle length. In order to investigate the proposed
method’s performance in both categories, the proposed method is applied to a DBA
algorithm from each category.
The first DBA algorithm is Excess Distribution which is first proposed in [31]
and later improved in [32]. This DBA scheme first divides the available bandwidth
equally among the ONUs to define the threshold window. All of the ONU’s requests
that are less than the threshold are granted. Then, the unused remaining bandwidth
is distributed equally between the unsatisfied ONUs. The variant used in this study
adapts a two-stage scheduling algorithm, as described in Section 2.6.2, to allocate
bandwidth to each of the traffic classes. This algorithm is referred to as Excess
Distribution or ED, while the traffic-prediction-assisted version of it, is referred to as
Integrated ED. The psuedo-code of the integrated ED is shown in Algorithm 1. It
demonstrates how the prediction can be applied to a DBA algorithm. The notations
used in the pseudo-code are explained in Table 2.2. Note that the time frame in each
ONU and OLT is different due to propagation delay. For the sake of simplicity, this
effect is not considered in the pseudo-code, but it is considered in simulations.
Unlike the first algorithm that maintains the fixed EPON cycle length, the
second algorithm, namely CB-IPACT, adjusts EPON cycle length according to the
introduced traffic load. Another difference is that CB-IPACT grants the requests
Algorithm 1 proposed Inter-ONU DBA pseudo-code
Require: Q(i), i= 1, . . . , N 1: for i:= 1 to Ndo
2: R(i,1)←Q(i)
3: end for
4: for k:= 1 to Itemax do 5: Rtex ←0
6: Bext ←0
7: for i:= 1 to N do
8: if R(i, k)> Wmax then 9: Rex(i)←R(i, k)−Wmax 10: Rtex ←Rtex+Rex(i)
11: else
12: Btex ←Bext +Wmax−(R(i, k))
13: end if
14: end for
15: for i:= 1 to N do 16: if Bext > Rtex then
17: G(i)←R(i, k) + Bext −Rtex N
18: else
19: if R(i, k)< Wmax then 20: G(i)←R(i, k)
21: else
22: G(i)←Wmax+Rex(i)
Rtex ×B t ex
23: end if
24: end if
25: end for
26: UpdateTsch
27: UpdateP(i, G, Tsch, Fi(t))
28: R(i, k+ 1)←R(i, k) +P(i, G, T sch)
29: end for
Table 2.2: Notations used in Algorithm 1.
Notation Description
N Number of ONUs
R(i, k) Request of ONU iin iteration k
Q(i) Queue Length at the beginning of the grant
Itemax Maximum iteration for solving the bandwidth allocation Rtex Total extra requested bandwidth
Bext Total extra bandwidth available G(i) Granted bandwidth to ONU i
P(i, G, Tsch) Prediction of incoming traffic for ONU i according to granted time slots. Calculated according to (2.9)
the request if it is less than a predefined maximum grant. Otherwise, it grants the
maximum grant.
Grant=min(Request, M axGrant) (2.11)
Applying traffic prediction to this algorithm by the method, explained in Section 2.5,
is fairly simple. The traffic-prediction-assisted CB-IPACT is referred to as
Integrated-CBIPACT. Then, the two-stage approach, explained in Section 2.6.2, is employed to
distribute the granted bandwidth to different traffic classes.
2.6.2
Intra-ONU scheduling
After the available bandwidth is divided between the ONUs, the intra scheduler at
ONU has to divide the granted bandwidth between different traffic classes. Here, we
adopt strict priority in the ONU scheduler. Therefore, the ONU scheduler serves EF,
the highest priority class first. Then, it serves AF and after that BE queue will be
served.
When strict priority is applied in the ONU scheduler, high priority packets
that are recently received can consume the granted bandwidth that was originally
requested by the lower priority packets. It causes the delay of lower priority packets
to increase in light load ONUs. The phenomenon is called light load penalty. A
remedy for this problem that helps satisfy the QoS requirement for each traffic class
Notation Description
Nc Number of classes
R(i) Length of the queue i at the time of request Q(i) Queue Length at the beginning of the grant
G Granted bandwidth
P Predicted incoming traffic
Gc(i) Granted bandwidth for classi
Brem Remaining unused bandwidth
priority to a separate transmit buffer at the time of sending the request. This buffer
will be transmitted at the next grant regardless of the higher priority packets that
may arrive after that. After the transmit buffer is emptied, other queues are served in
order of their priority. In other words, the transmit buffer acts as the highest priority
queue. This algorithm is called two-stage DBA.
We propose a variant of two-stage DBA that does not require another buffer.
At the time of sending the request, the ONU records the length of each queue. The
recorded request is then used to determine how many packets can be sent from each
queue during the next grant.
The ONU scheduler works in two rounds. In the first round, it serves the queues
in order of their priority up to the saved request for each queue. Since the queues are
First-In-First-Out (FIFO), it means that only the packets that were in the queue at
the time of request (tr), are served. After that, the scheduler starts transmitting the
next priority queue. The second round starts after all queues are swept once and all
packets that were in the queues at the request time are transmitted. In this cycle the
ONU scheduler performs normal strict priority scheduling to serve the newly arrived
packets. The pseudo-code of the algorithm is shown in Algorithm 2.
The traffic-prediction enhanced DBA assigns bandwidth to incoming packets.
But as previously described in Section 2.6, the class of the incoming traffic is not
differentiated in order to keep the algorithm simple. To be able to use the bandwidth
that is assigned to incoming packets, the accounted predicted traffic, represented by
Gp, is also received along with the grant size. The scheduler adds Gp to the highest
Algorithm 2 The intra-ONU scheduling algorithm pseudocode
Require: R(i), i= 1, . . . , Nc Require: Q(i), i= 1, . . . , Nc Require: G, P
First round:
1: R(1)←R(1) +Gp 2: for i:= 1 toNc do
3: Gc(i)←min(R(i), G−Pi−1
k=1Gc(k)) 4: end for
Second round:
5: for i:= 1 toNc do
6: Brem ←min(0, G−PNc
k=1Gc(k))
7: Gc(i)←Gc(i) +min(Q(i)−R(i), Brem)
8: end for
into account, the remaining of Gp is used to transmit the newly received packets
of the next priority queue. This continues to lower priority queues. After the first
round, the second round is performed without any modification.The pseudo-code of
the algorithm is shown in Algorithm 2. The notations used are described in 2.3.
2.7
Maximum Throughput Analysis
The maximum throughput is achieved when the whole granted bandwidth is used.
Therefore, in order to calculate the maximum throughput, it is assumed that all ONUs
are backlogged, which has the desired result that the whole granted bandwidth would
be used.
To calculate the maximum throughput, the wasted bandwidth has to be
esti-mated. In each EPON cycle, which is denoted by C, the following factors waste the
bandwidth. The required gap between ONU’s granted slots, known as inter-ONU
guard time G1, is a contributing factor to bandwidth waste. In each cycle, there
are N gaps between the grants, where N is the number of active ONUs in the
net-work. Another contributing factor is the gap between two consecutive cycles, which
we represent as G2. The bandwidth that is used for sending the report messages also
throughput. It is assumed that the DBA algorithm that is used and the round trip
time of ONUs, let the grant slots to be assigned without any gap in between other
than the described ones. The maximum throughput is
Rmax= 1−
N ×G1−G2−N × LrepR E
C , (2.12)
whereRmaxis the maximum throughput andLrepis the length of the report message
in bits.
Some DBA algorithms such as the one presented in [31], require all ONU
re-quests to process the bandwidth assignment. In these algorithms, the idle time
be-tween frames, namely walk time, wastes a considerable amount of bandwidth. The
walk time is basically composed of three different components; waiting time for the
reception of the last ONU request, the processing time of scheduling algorithm and
the round trip time of first ONU. The last factor comes from the fact that the link
remains idle for the duration of transmitting the first ONU’s grant and receiving data
from it. Supposing that the processing time is negligible, it is equal to the first
sched-uled ONU’s round trip time. In summary, walk time is defined as the time between
reception of last report message and reception of the first data bit of the first ONU.
In this period, the link is idle and the corresponding bandwidth is wasted. Taking
the walk time into account the maximum throughput is worked out as
Rmax= 1− 1
C × N ×G1−G2−N × Lrep
RE −Trtt−Tproc
,
where Trtt is the round trip time of the ONU that its report is the last report and
Tproc is the processing time of DBA algorithm.
2.8
Simulation Platform
The performance of the proposed algorithm is extensively studied through simulations
under different scenarios. Simulation experiments are conducted with the OPnet
![Figure 2.1: Integrated EPON and WiMAX architectures [3]. c⃝2007 IEEE](https://thumb-us.123doks.com/thumbv2/123dok_us/7792447.1291649/27.612.123.537.95.302/figure-integrated-epon-wimax-architectures-c-ieee.webp)